- Bitcoin price rebounds above $109,000 after retesting its breakout from consolidation, signaling renewed bullish momentum.
- Ethereum price finds support around its throwback at $2,461, signaling potential for further upward momentum.
- XRP holds firm at $2.23 support, igniting bullish momentum and paving the way for a potential rally.
Bitcoin (BTC), Ethereum (ETH), and Ripple (XRP) are showing signs of renewed strength as the crypto market kicks off the week on a bullish note. BTC has reclaimed ground above $109,000 after confirming a breakout from its consolidation phase. Meanwhile, ETH and XRP are holding strong near their crucial support levels, signaling potential for further upward momentum.
Will BTC refresh its record highs?
Bitcoin price rebounded after retesting its previous broken upper boundary of a consolidation zone at $108,355 on Friday and rose slightly over the next two days. At the time of writing on Monday, it continues to trade higher above $109,000.
If BTC continues its upward momentum, it could extend the rally toward the May 22 all-time high at $111,980.
The Relative Strength Index (RSI) on the daily chart reads 58, above its neutral level of 50, indicating bullish momentum. The Moving Average Convergence Divergence (MACD) on the daily chart displayed a bullish crossover. It also shows rising green histogram bars above its neutral level, suggesting bullish momentum and indicating an upward trend.
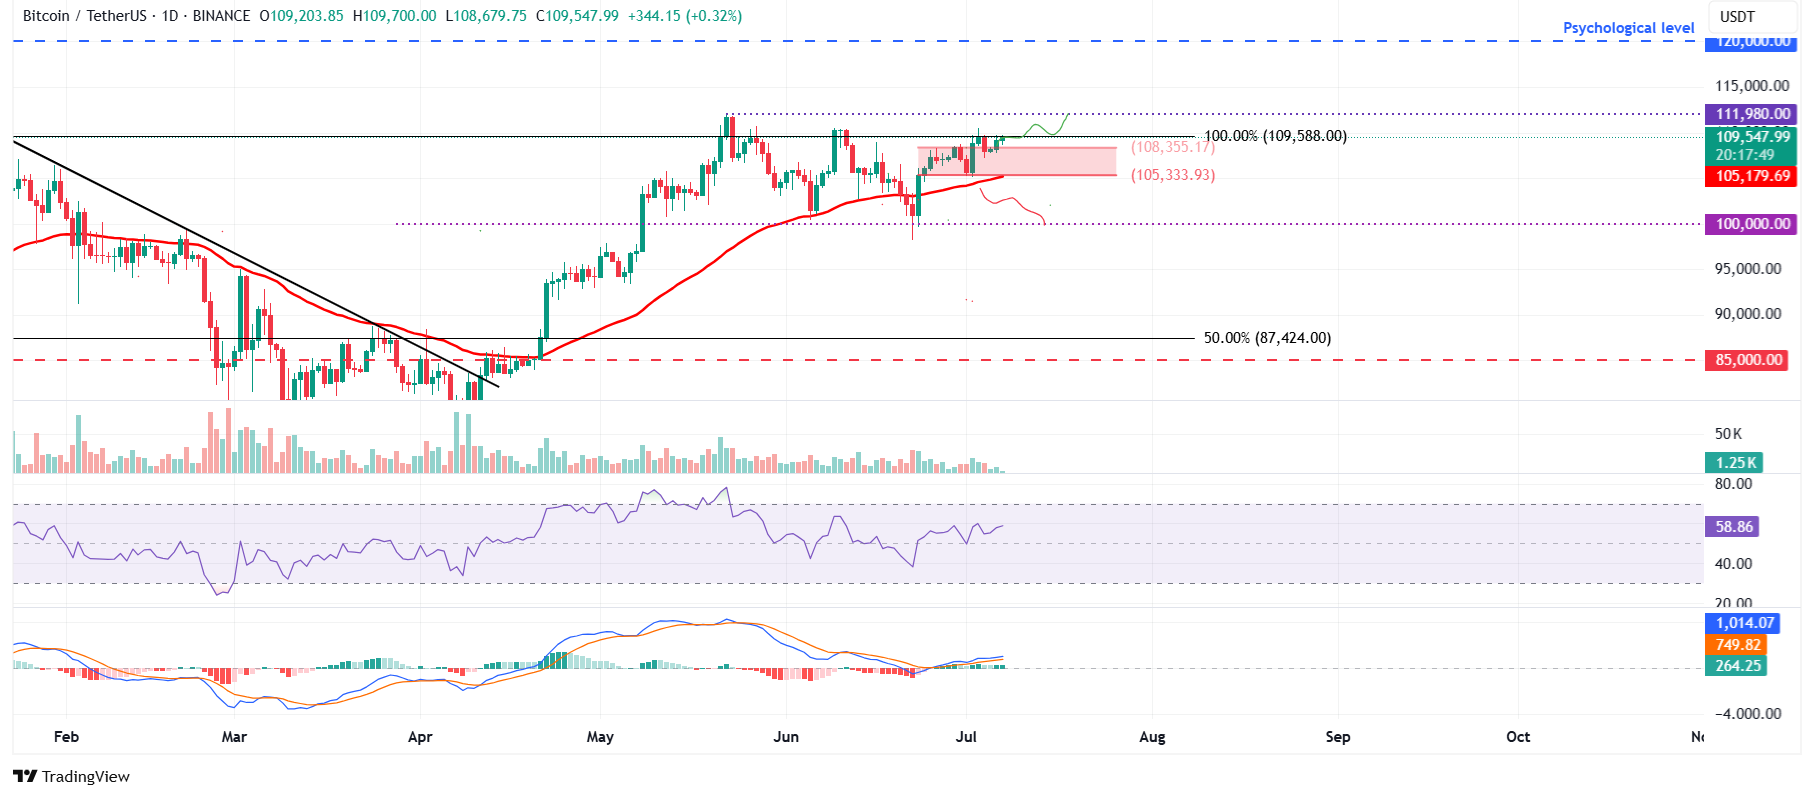
BTC/USDT daily chart
However, if BTC faces a correction and closes below its support at $108,355, it could extend the decline to retest the lower boundary of the consolidation zone at $105,333.
Ethereum rebounds after retesting its key support level
Ethereum price rebounded after finding support around its daily level of $2,461 on Friday and recovered slightly over the weekend. At the time of writing on Monday, it hovers at around $2,576.
If ETH continues its upward trend, it could extend the rally toward its next daily resistance level at $2,724.
The RSI on the daily chart reads 55, above its neutral level of 50, indicating that bullish momentum is gaining traction. The MACD indicator on the daily chart displayed a bullish crossover last week. It also shows rising green histogram bars above its neutral level, suggesting bullish momentum and indicating an upward trend.
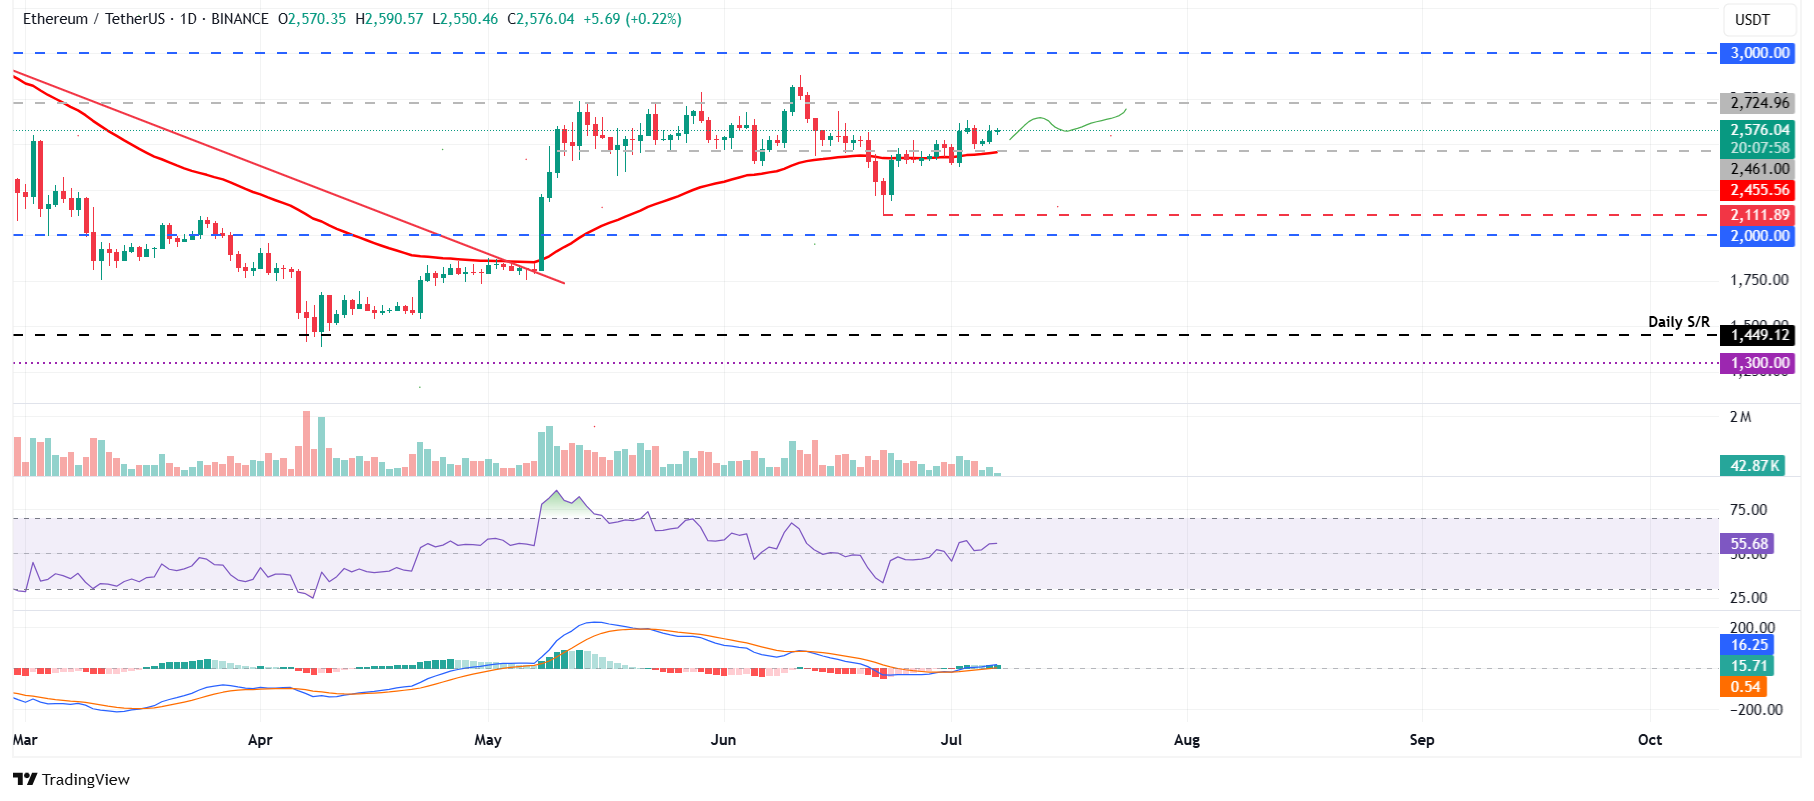
ETH/USDT daily chart
On the other hand, if ETH faces a correction, it could extend the decline to retest its daily support at $2,461.
XRP bulls are aiming for levels above $2.40
XRP price broke above the descending trendline (drawn by connecting multiple highs since mid-May) on June 30 and found support around its previous level over the next two days, rallying 4.5% until Sunday. At the time of writing on Monday, it trades at around $2.27.
If XRP continues its upward momentum, it could extend the rally toward its May 23 high of $2.47.
The RSI on the daily chart reads 56, above its neutral level of 50, indicating that bullish momentum is gaining traction. The MACD indicator on the daily chart displayed a bullish crossover last week. It also shows rising green histogram bars above its neutral level, suggesting bullish momentum and indicating an upward trend.
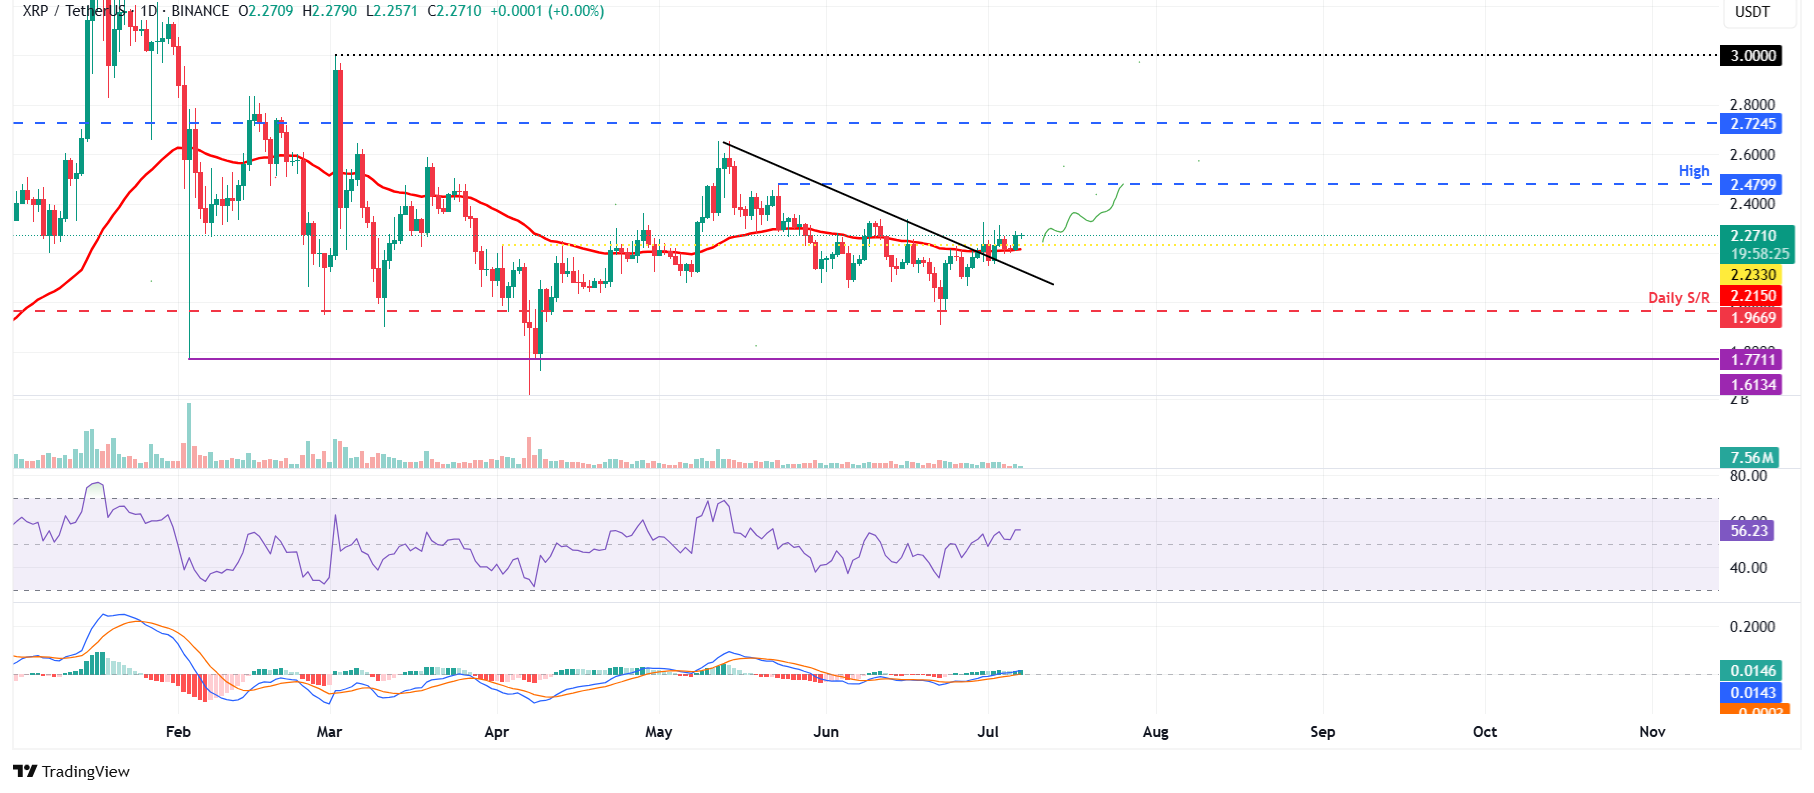
XRP/USDT daily chart
Conversely, if XRP falls and closes below its 50-day EMA at $2.21, it could extend the correction to retest its daily support at $1.96.