After facing consistent rejections below the descending trendline, Pi Network price continues to decline, now hovering around the $0.459 level. Price action has entered a key demand area, but signs of trend weakness remain, with no strong bullish structure emerging yet.
What’s Happening With Pi’s Price?
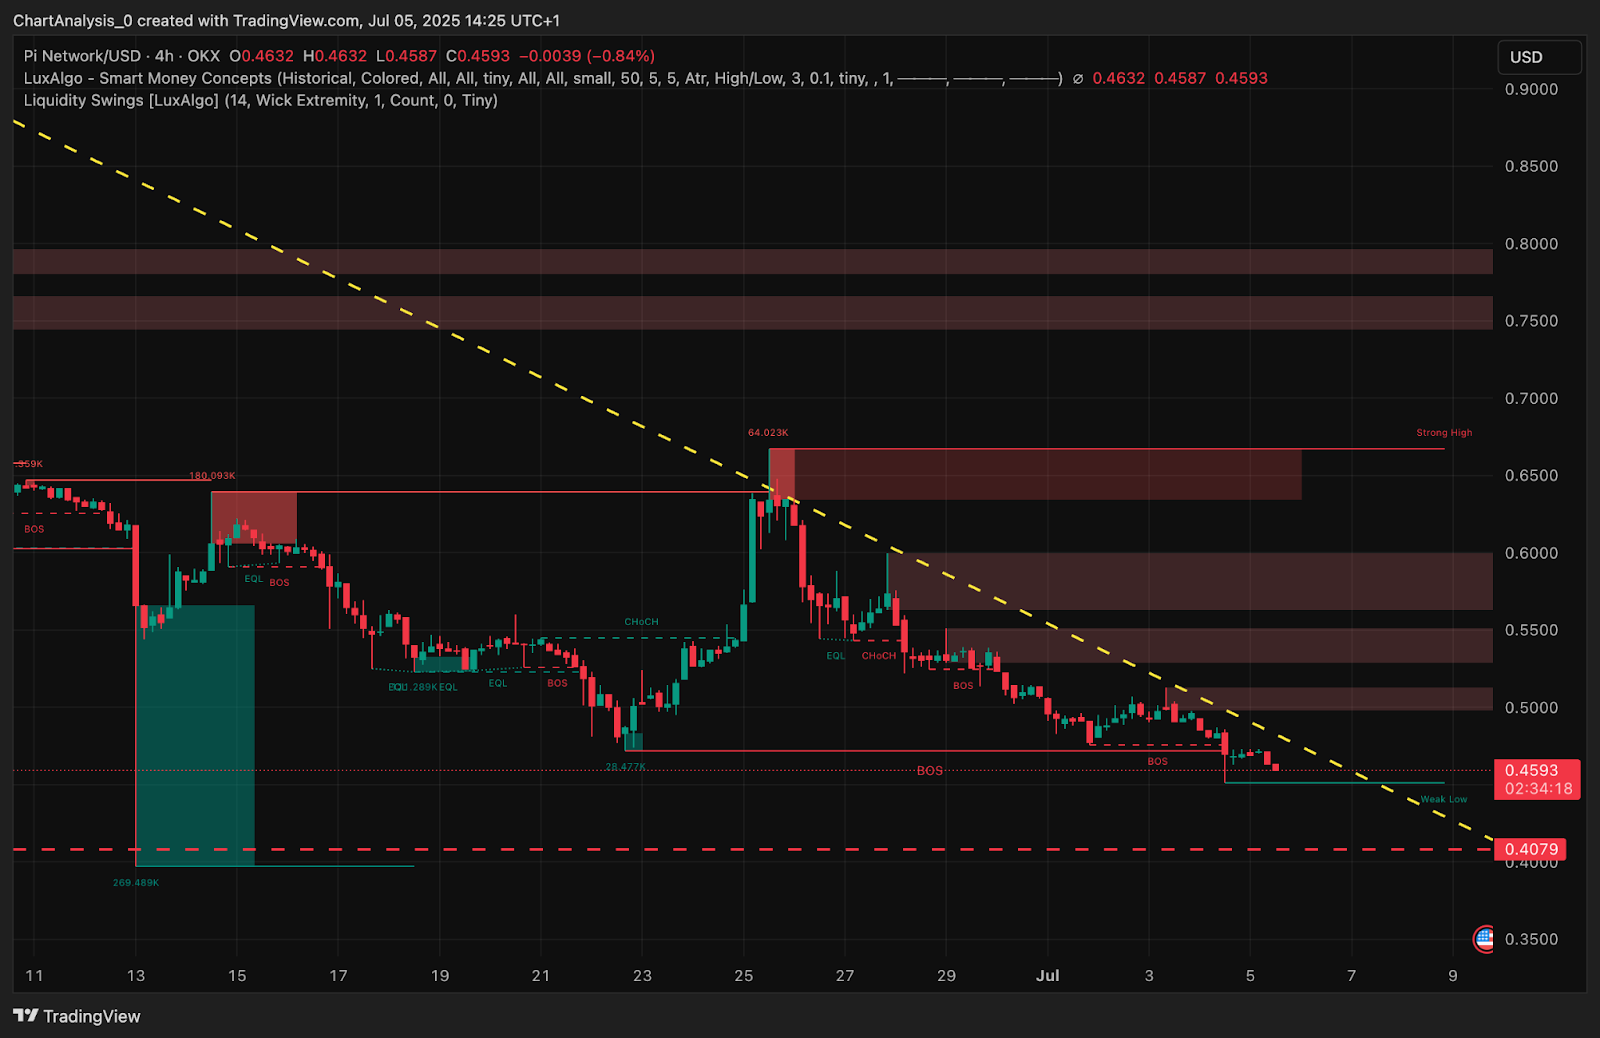
On the 4-hour chart, Pi Network price action remains trapped within a falling channel, marked by a well-respected descending trendline from the $0.64 high. Despite occasional bullish attempts, each breakout has failed to sustain, leading to successive Breaks of Structure (BOS) and Change of Character (CHoCH) zones favoring sellers.
Most recently, price formed a weak low at $0.459, with another BOS forming just below. Liquidity resting under $0.44 now becomes the next magnet for short-term market interest. Sellers have defended the $0.50–$0.55 imbalance zone consistently, while upside volume has failed to penetrate the higher supply between $0.64 and $0.66.
Why Is the Pi Network Price Going Down Today?
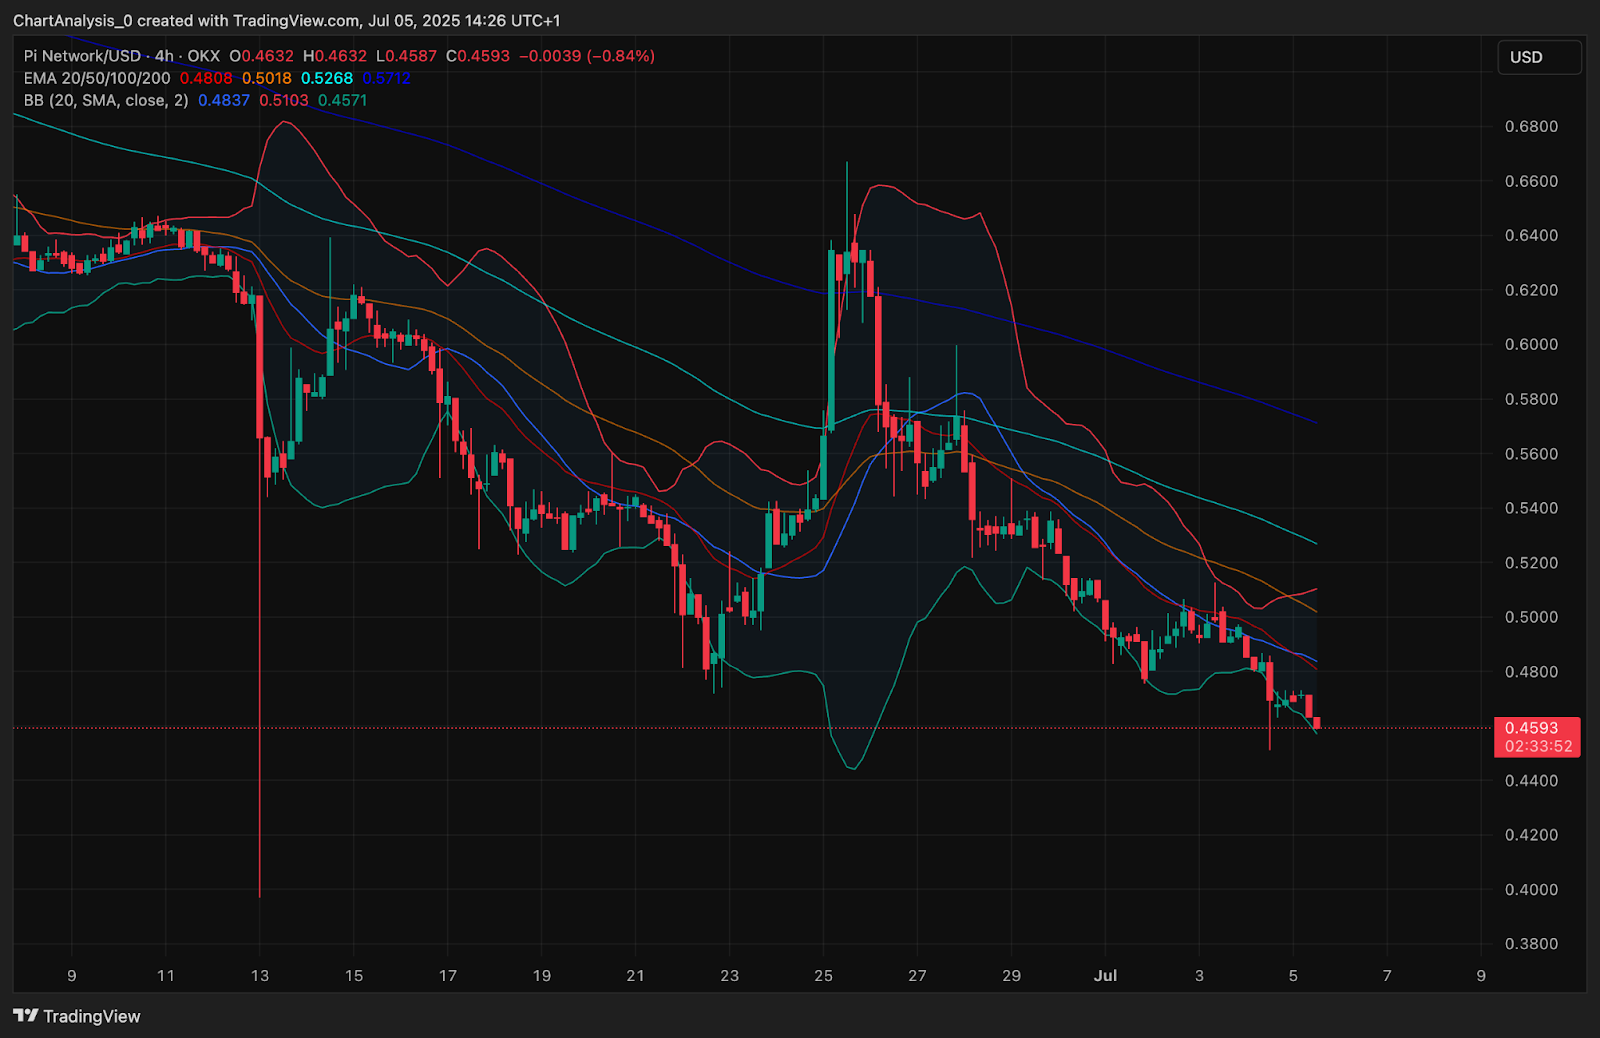
Why Pi Network price going down today can be explained by a confluence of technical weaknesses across major indicators. The 20/50/100/200 EMA cluster on the 4H chart is bearishly aligned, with price trading well below all moving averages. The closest EMA, the 20 EMA at $0.488, is acting as dynamic resistance, keeping bulls capped.
The Bollinger Bands are tightening, with price hugging the lower band near $0.457 — often a precursor to volatility spikes. With candles forming small bodies and rejecting the midline, this confirms the lack of bullish strength.
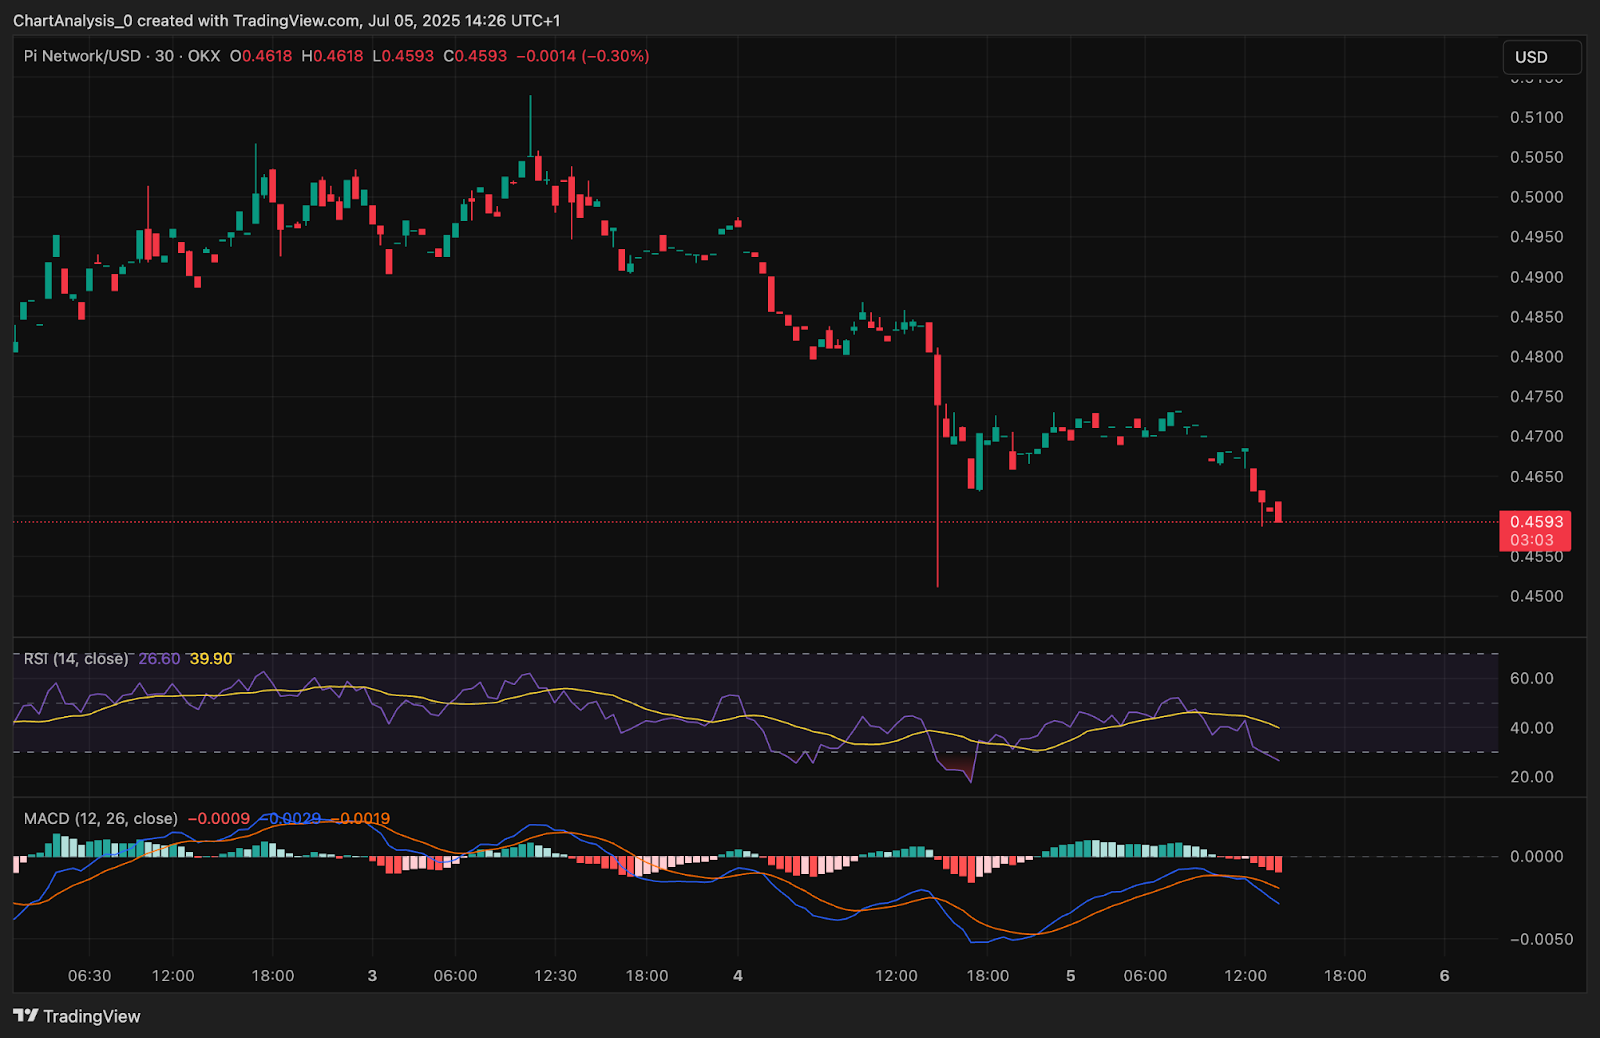
On the 30-minute chart, RSI hovers around 39.9, indicating weakening momentum but not yet fully oversold. The MACD histogram shows fading momentum, with the lines nearing a bearish crossover.
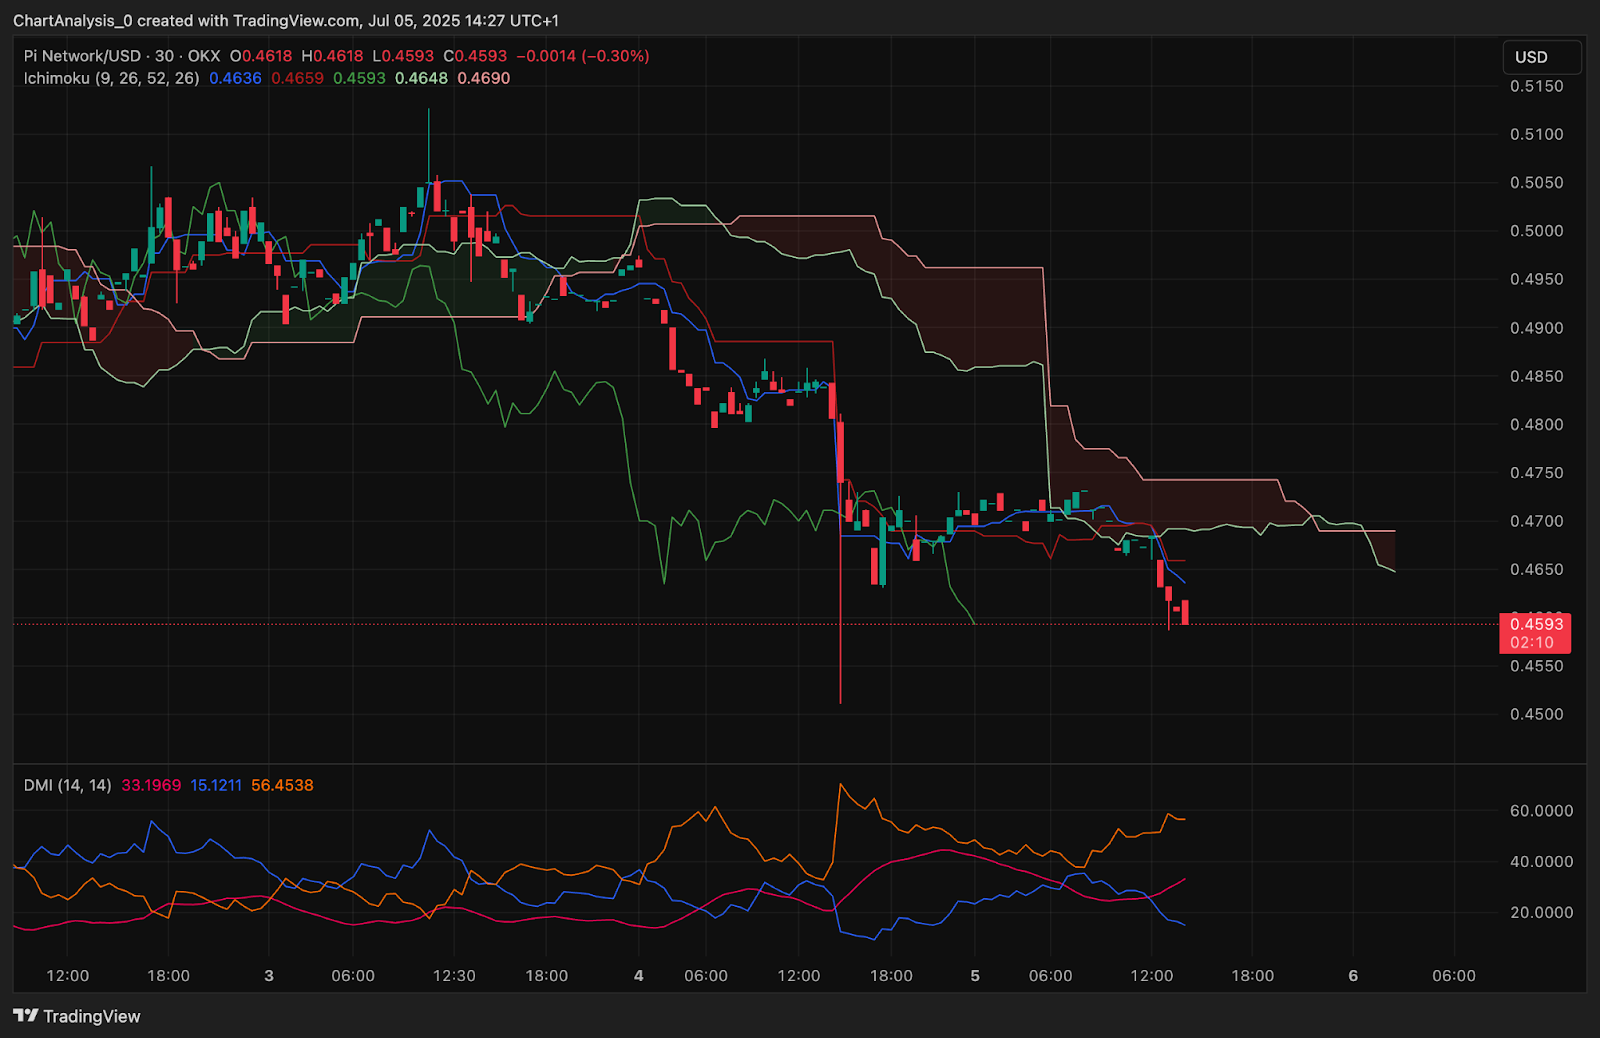
Meanwhile, Ichimoku Cloud signals continued downside. Price is trading below the cloud, with the Kijun-Sen and Tenkan-Sen offering no signs of a bullish crossover. The Lagging Span also remains under price action, reinforcing the bearish bias.
Directional Momentum Index (DMI) further confirms this setup, with a strong -DI line above +DI and a rising ADX near 56 — a signal of trending bearish strength.
Price Indicators, Signals, Graphs and Charts (24h)
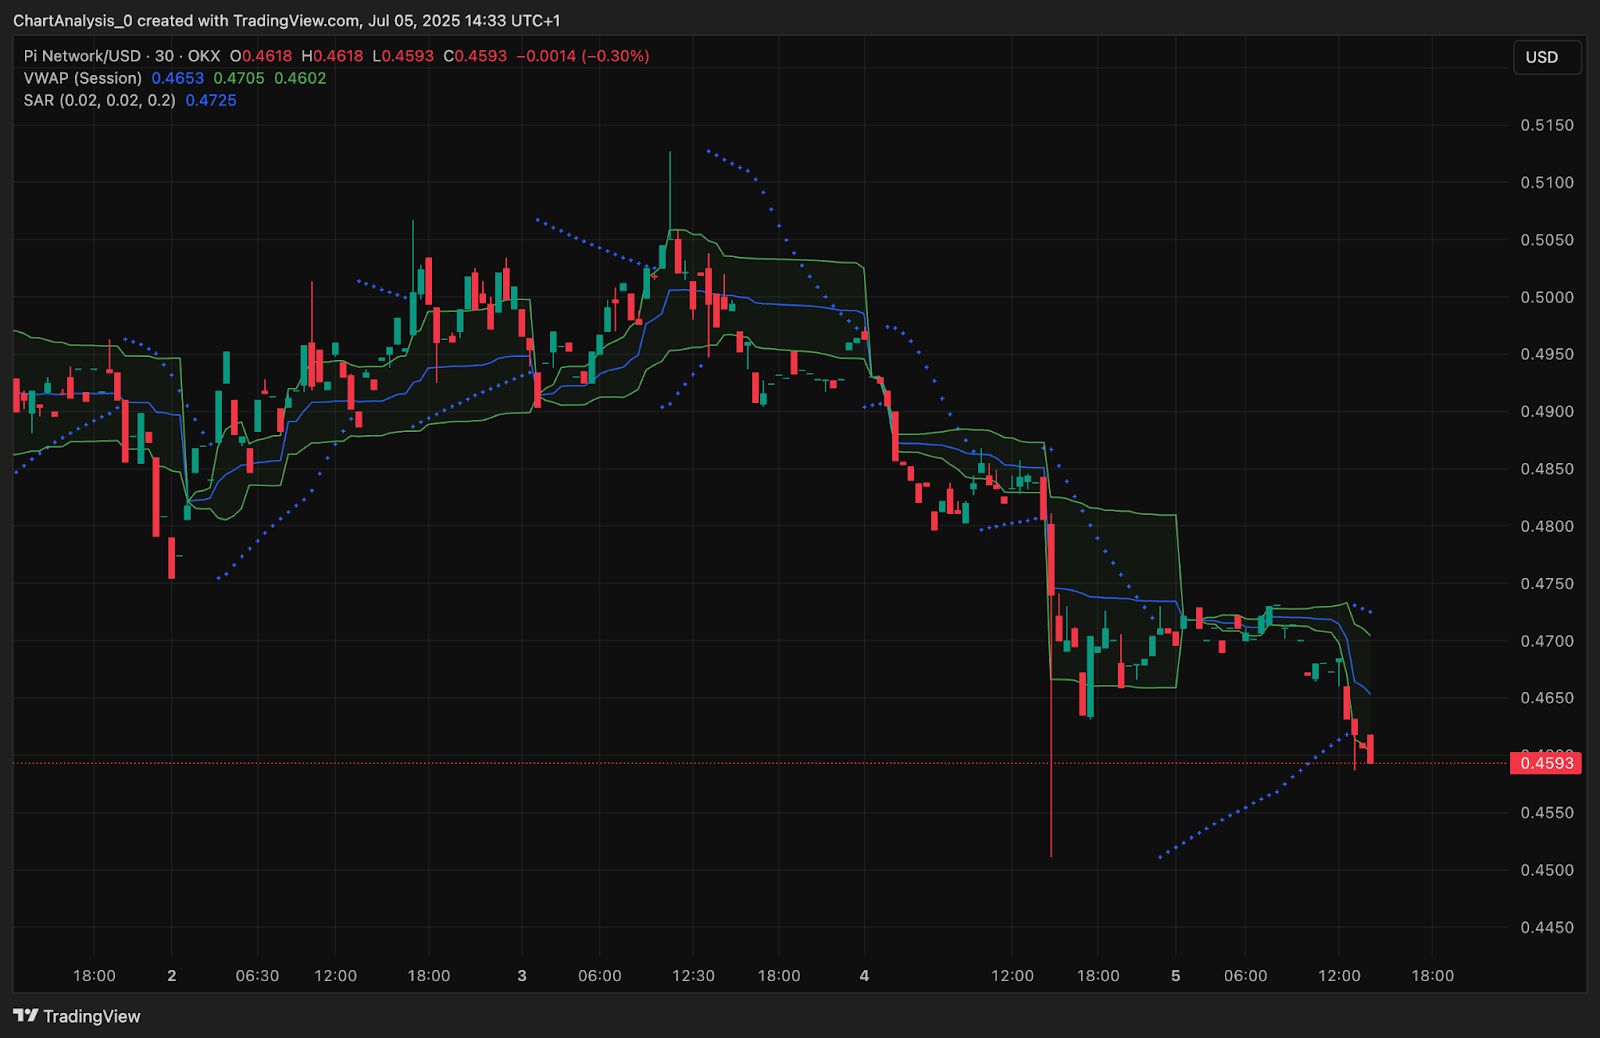
Multiple pressure signals are in play. The Parabolic SAR is firmly above price on the 30-minute chart, signaling that downside control remains intact. The VWAP indicator also sits at $0.465, now acting as an intraday resistance barrier.
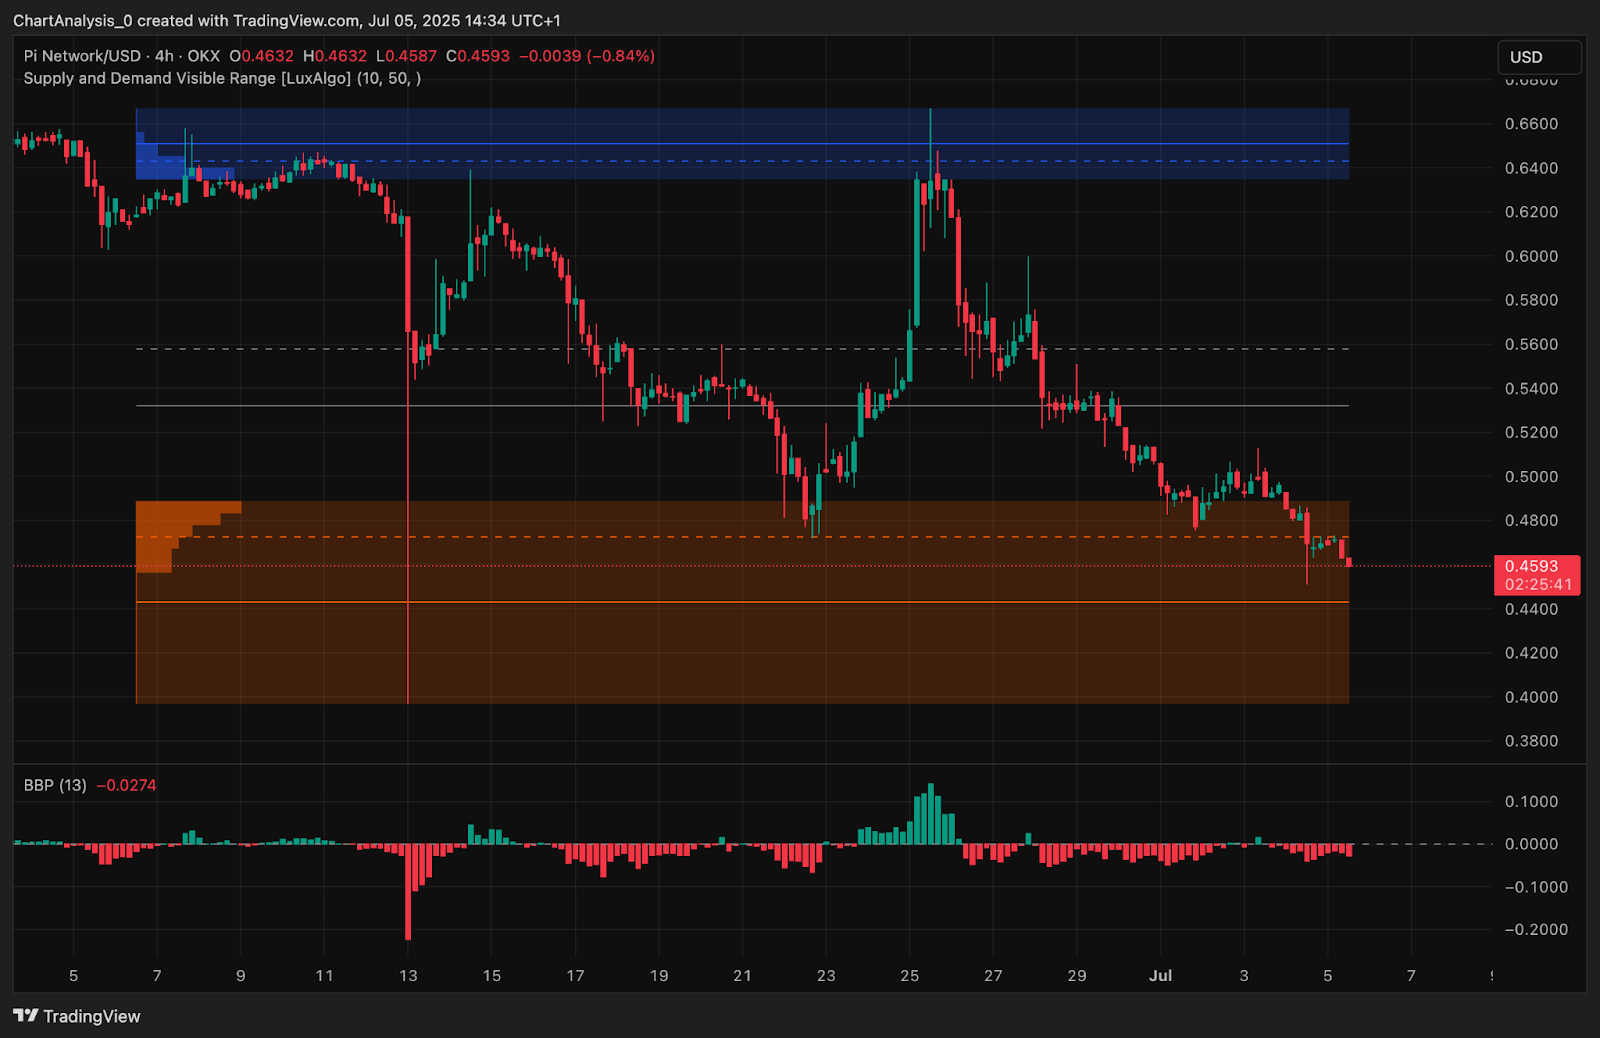
Looking at the Supply and Demand Visible Range, Pi is sitting at the top edge of a large demand block between $0.42 and $0.46. This zone has historically absorbed sell pressure, but a breakdown below $0.44 could open doors to a larger liquidity sweep into the $0.40–$0.41 region.
At the same time, BBP (Balance of Power) on the 4H is in negative territory (-0.027), reinforcing the control bears currently maintain.
PI Price Prediction: Short-Term Outlook (24h)
If bulls cannot reclaim the $0.465–$0.470 VWAP and EMA zone, the path of least resistance remains downward. A clean break below $0.456 would likely trigger a sweep toward $0.44, and possibly as low as $0.407 — the next visible low and key structural demand.
On the other hand, if Pi Network price today rebounds off the current support and closes above $0.470 with volume, the next resistance comes into play at $0.488 (20 EMA) and then $0.501 (50 EMA). However, these zones are heavily defended and will require strong momentum and structure flip to overcome.
For now, the setup favors cautious bears, while bulls must defend $0.44 to avoid deeper downside continuation.
Pi Network Price Forecast Table: July 6, 2025
| Indicator/Zone | Level (USD) | Signal |
| Resistance 1 | 0.470 | VWAP + Parabolic SAR zone |
| Resistance 2 | 0.488 | EMA20 dynamic ceiling |
| Support 1 | 0.456 | Weak low + demand edge |
| Support 2 | 0.407 | Liquidity target + prior BOS zone |
| RSI (30-min) | 39.9 | Bearish-moderate |
| MACD (30-min) | Bearish bias | Momentum fading |
| BB Width (4H) | Tightening | Precursor to breakout |
| Ichimoku Cloud (30-min) | Bearish setup | No bullish signal |
| DMI / ADX | ADX 56, -DI leads | Trending bearish momentum |
| BBP (4H) | -0.0274 | Bearish power dominance |
Disclaimer: The information presented in this article is for informational and educational purposes only. The article does not constitute financial advice or advice of any kind. Coin Edition is not responsible for any losses incurred as a result of the utilization of content, products, or services mentioned. Readers are advised to exercise caution before taking any action related to the company.