


 22
22
The $TIA price today is trading around $1.48 after erasing earlier gains from a minor bounce near the $1.66 resistance zone. Despite brief rallies, $TIA remains locked in a strong macro downtrend and is struggling to establish any consistent upside momentum. A breakdown below the critical $1.45 support could invite deeper selling pressure unless buyers step in quickly.
What’s Happening With $TIA’s Price?
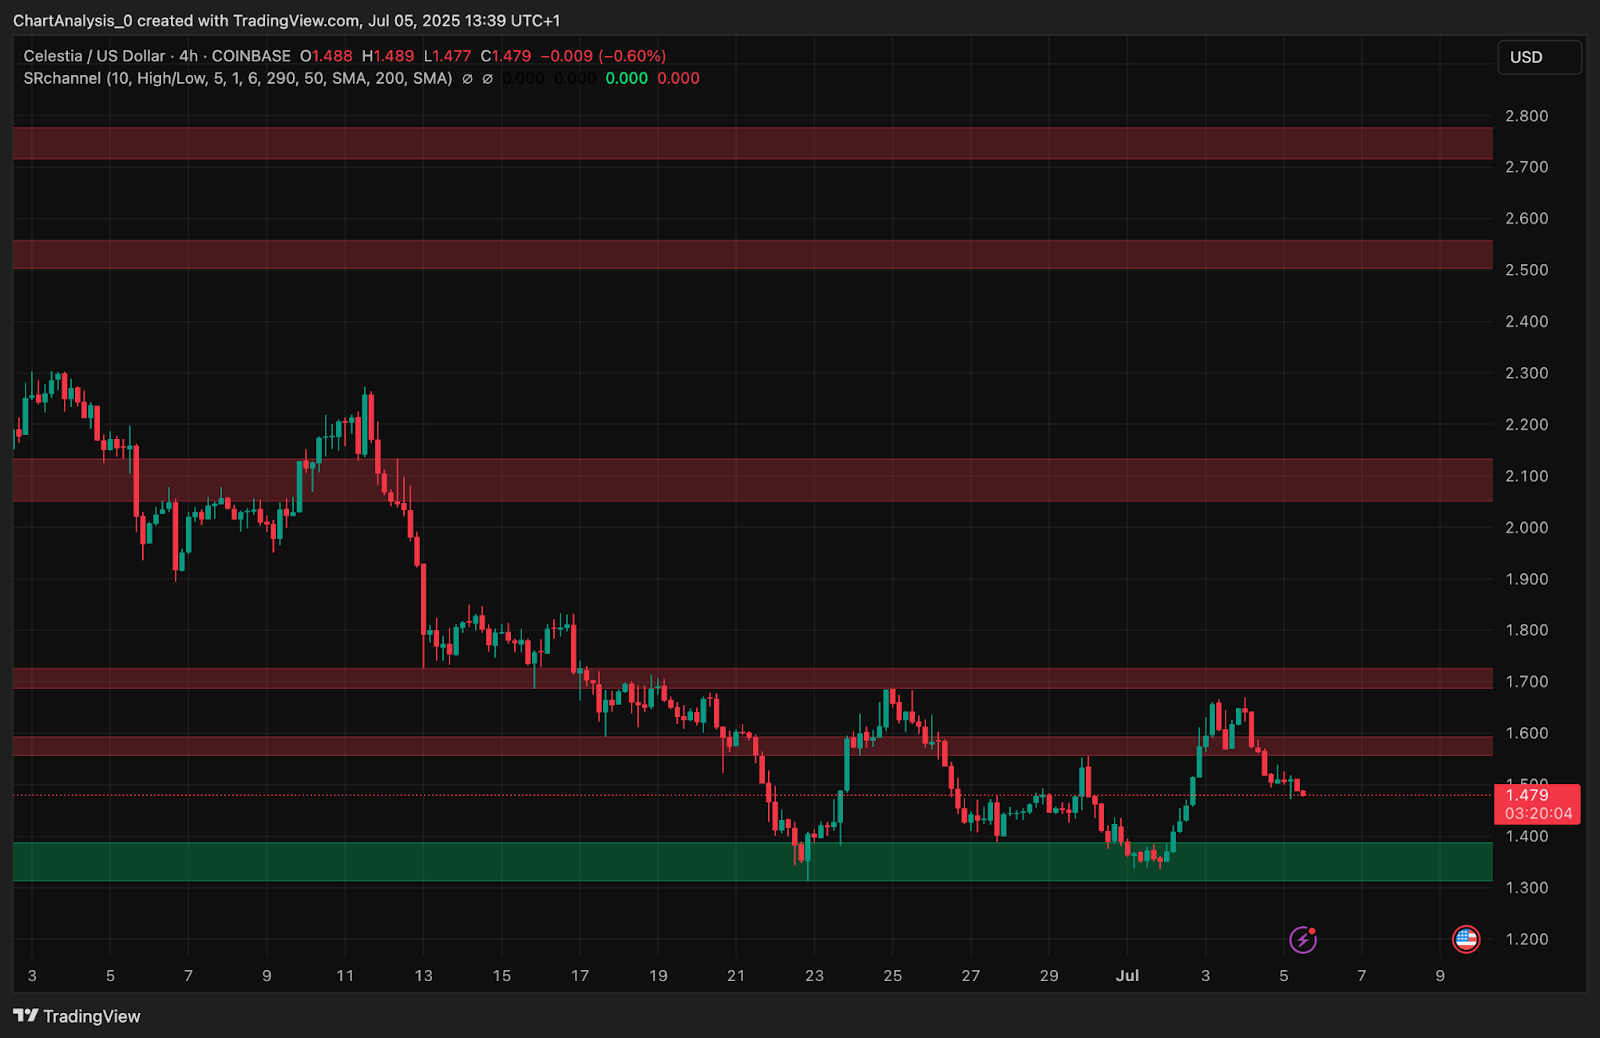
On the 4-hour chart, Celestia is nearing the bottom of a critical demand zone between $1.43 and $1.46. This area has been tested multiple times since late June, forming the last visible support range before a potential slide toward $1.38 or lower. The 20/50/100/200 EMAs on the same timeframe are all trading above price and remain steeply stacked to the downside which is a clear reflection of sustained bearish dominance.
Price action on the 1-day chart confirms the prevailing trend. $TIA has failed to break the descending structure formed since February, with resistance rejections lining up perfectly at key horizontal supply zones such as $1.66, $2.10, and $2.60. Most candles this month have closed below their opens, further confirming the lack of buyer conviction at current levels.
Why Is The $TIA Price Going Down Today?
The decline in $TIA price is being driven by multiple confluences of technical and on-chain pressure. First, the Why $TIA price going down today question is answered by the rejection from the 4-hour mid-Bollinger Band, which aligns with the $1.55–$1.60 resistance pocket. After failing to close above the Bollinger midline, the price was pushed lower in a textbook squeeze-and-reject scenario.
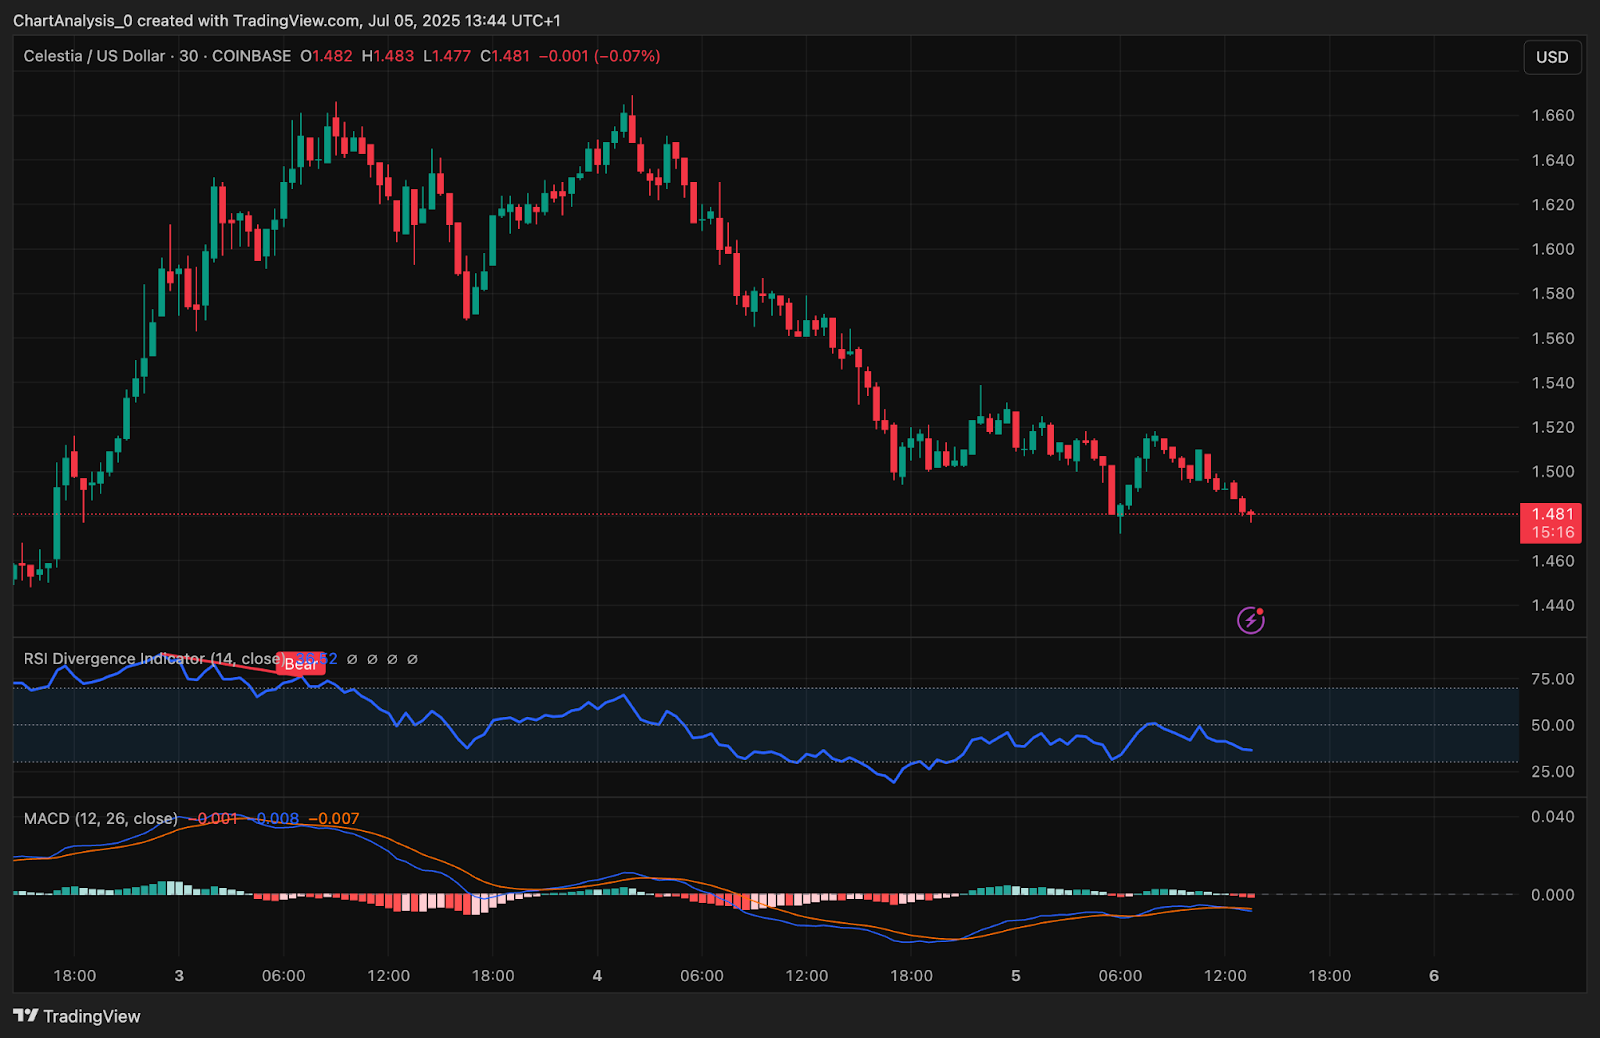
On the 30-minute chart, RSI has dropped back below 40, reflecting fading intraday strength. MACD has flipped bearish again after a shallow crossover attempt, and a marked bearish RSI divergence has emerged around the $1.66 swing high.
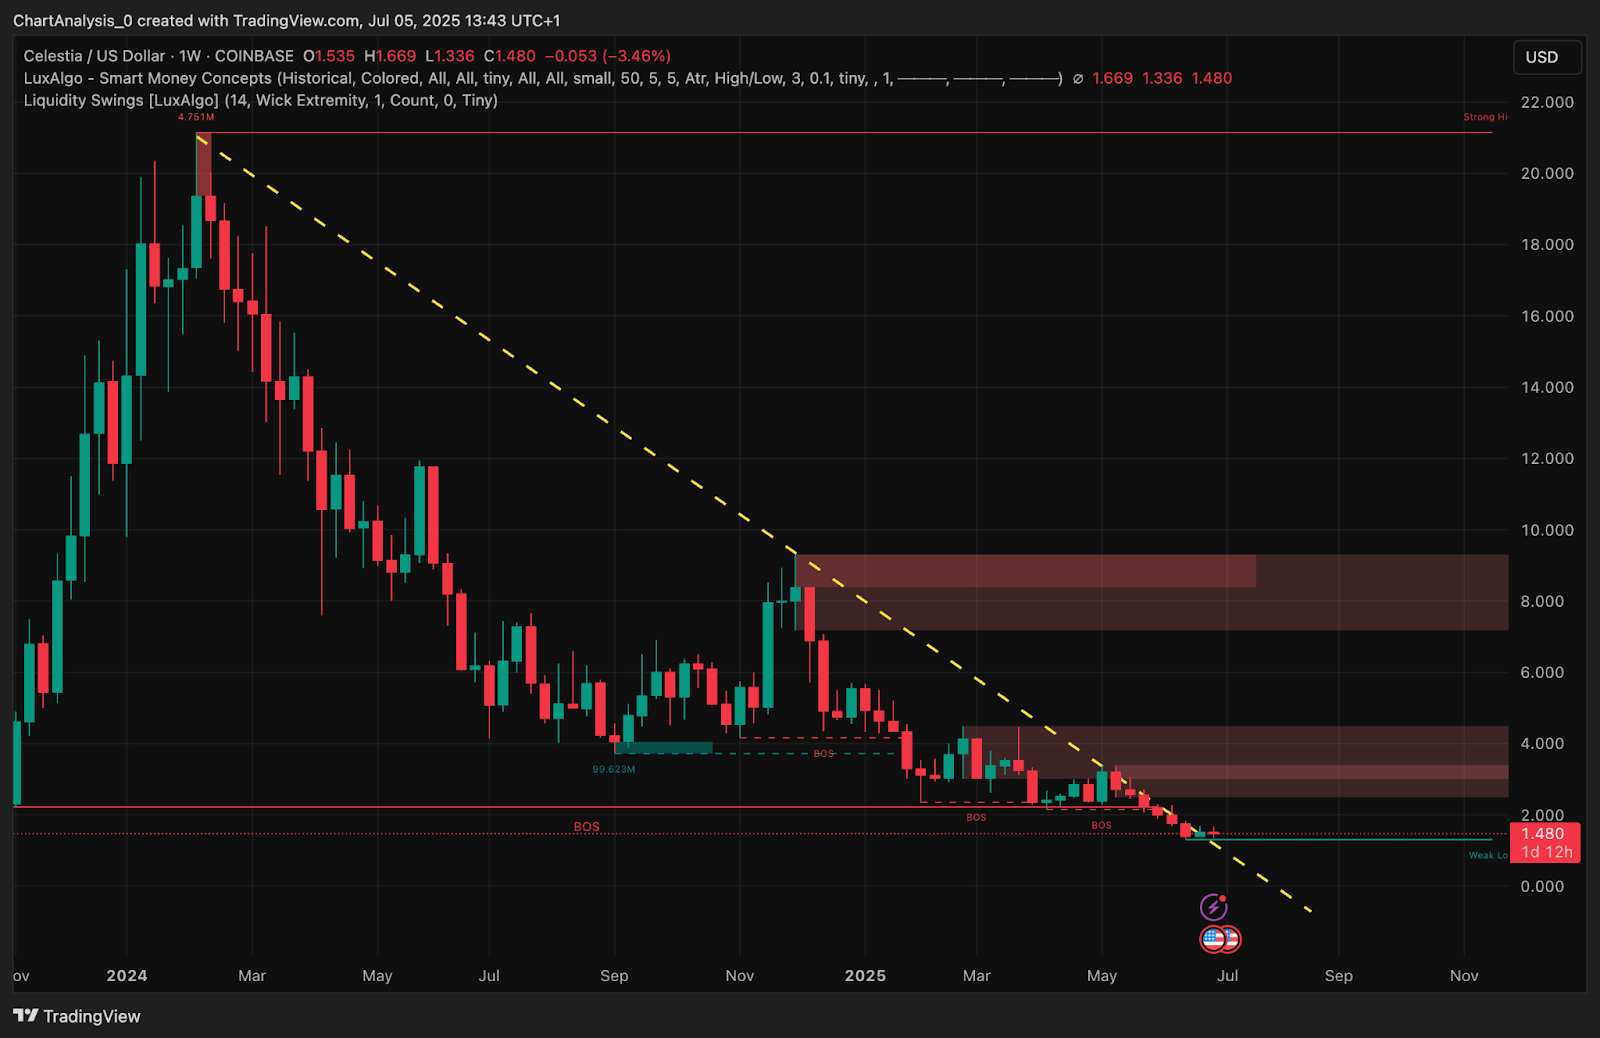
From a macro view, the weekly chart shows $TIA continuing to respect a descending trendline from the $20 peak. A breakout attempt in early June failed to sustain, and the asset is now printing consistent lower highs and lower lows. The long-term structure also shows a break of market structure (BOS) around $1.50 — now a flipped resistance zone.
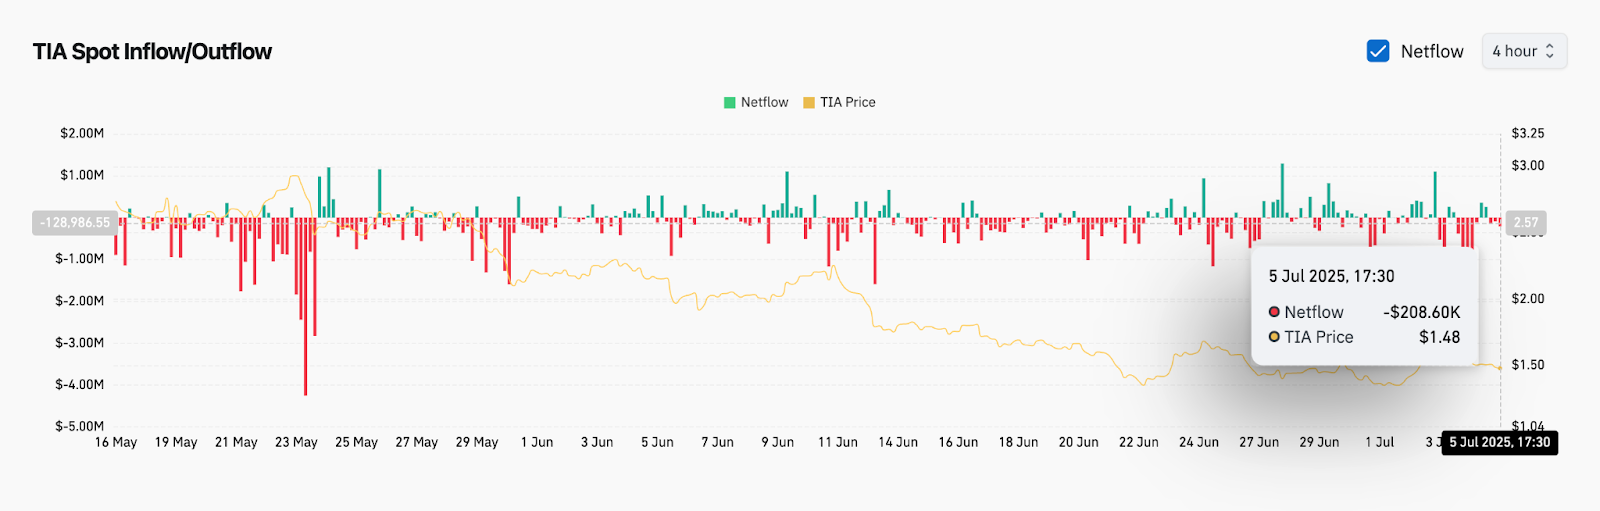
On-chain data from July 5 confirms that spot netflows remain negative, with -$208K in outflows recorded as $TIA price slipped back toward $1.48. Continuous outflows suggest traders are exiting positions, further weakening demand-side support.
Indicators Signal Weak Momentum Ahead of Key Support Retest
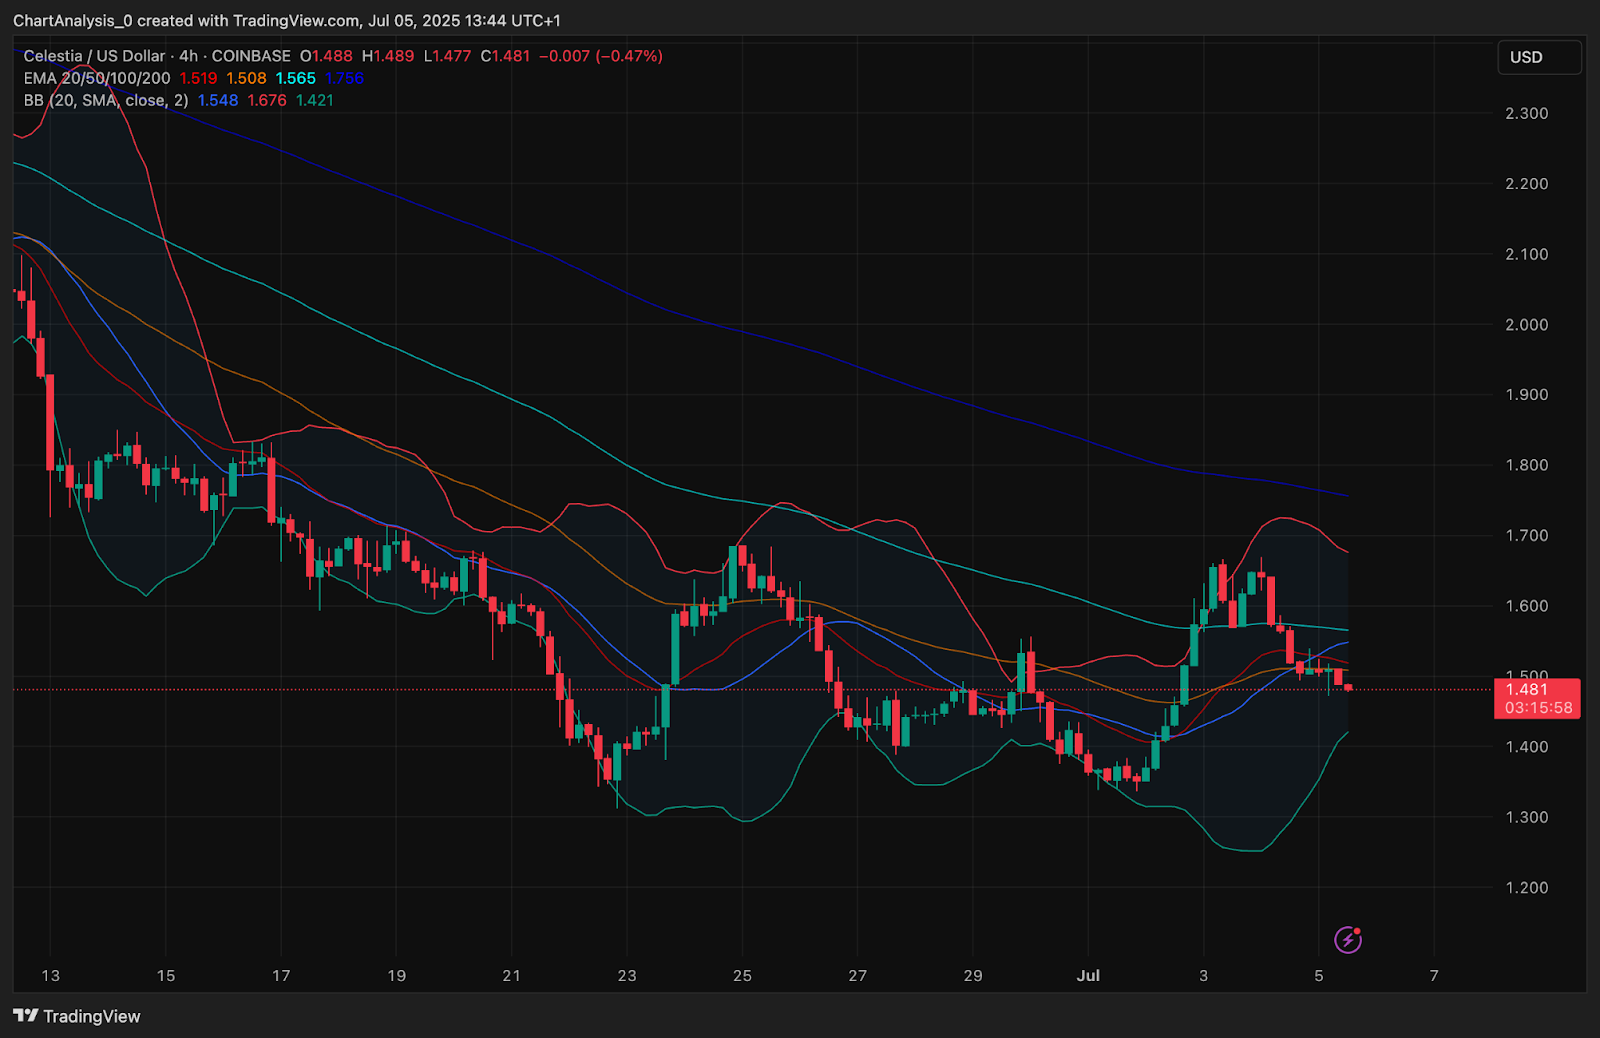
The 4-hour Bollinger Bands have started to widen again following a brief contraction, implying that directional volatility may expand in the near term. With candles approaching the lower band and no bullish engulfing patterns confirmed, downside pressure remains the more likely outcome.
EMAs offer no immediate support. The 20 EMA sits at $1.51 and has flipped into dynamic resistance. The 50 EMA ($1.50) and 100 EMA ($1.56) also remain untouched by price since July 3, underscoring the ongoing rejection of bullish attempts.
The daily chart suggests an expanding inefficiency gap down to $1.38 and $1.34 — both previous demand zones. Unless volume picks up with a strong reversal signal near $1.45, $TIA could continue bleeding into deeper accumulation territory.
$TIA Price Prediction: Short-Term Outlook (24h)
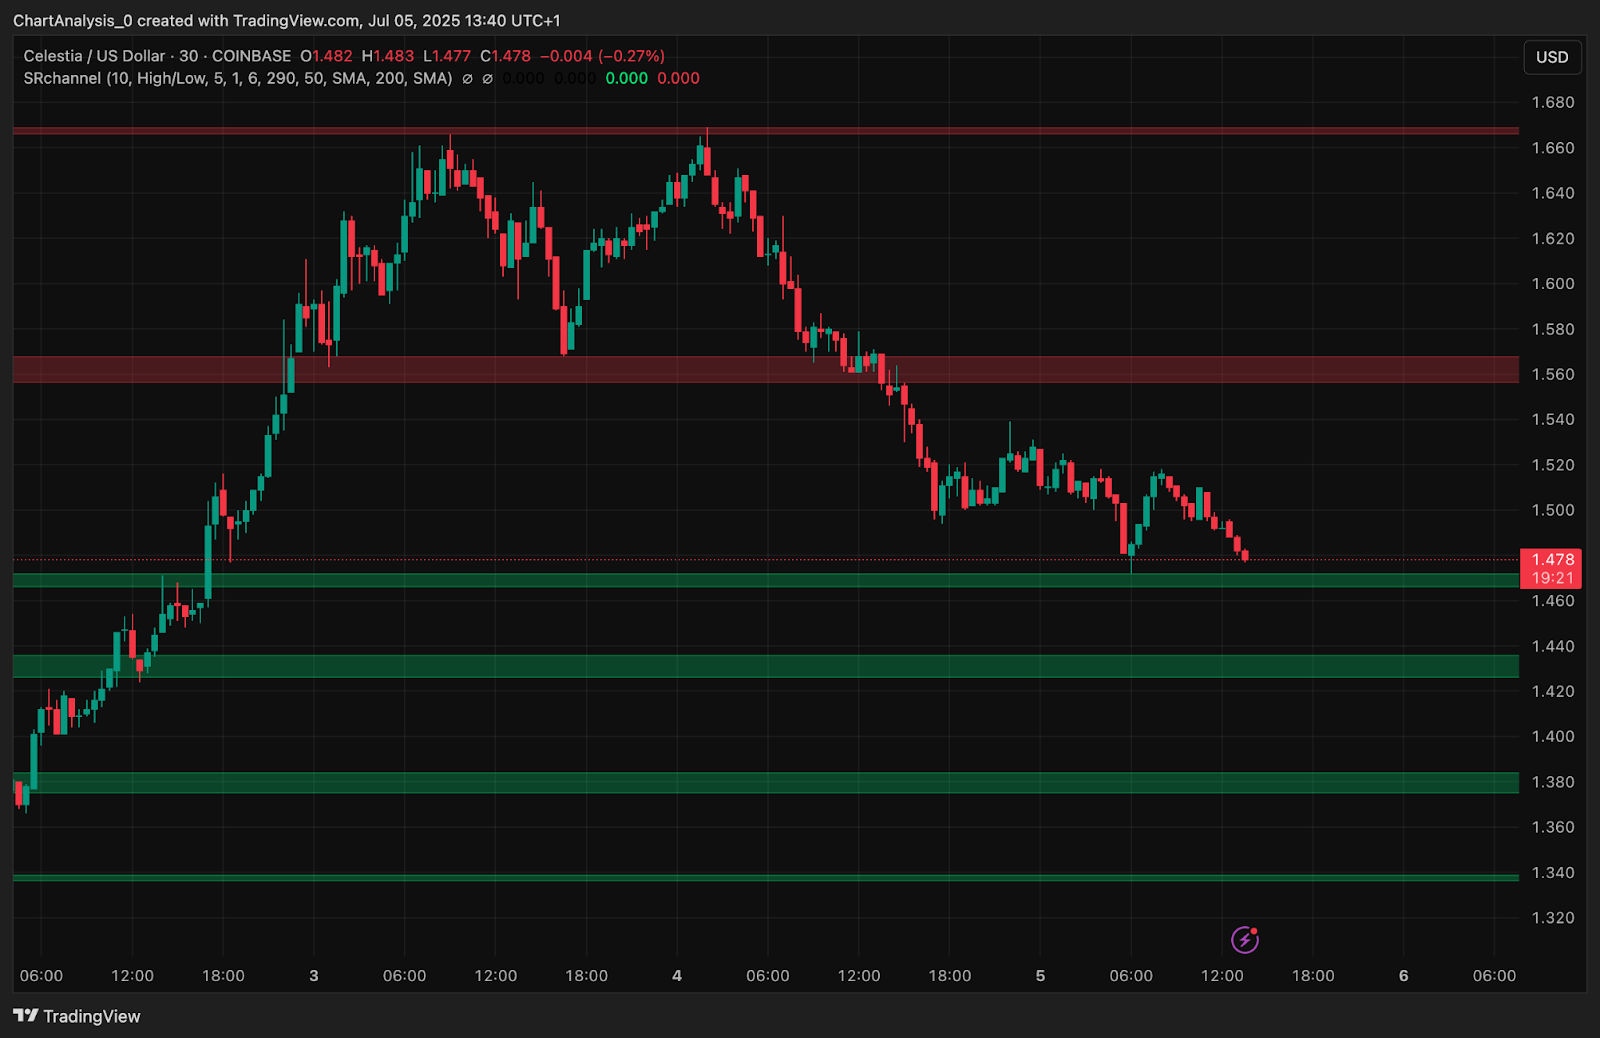
The short-term outlook for $TIA price action is bearish-neutral, with key support holding for now at $1.45–$1.46. If this area breaks, the next targets to the downside are $1.38 and $1.34. If bulls manage to defend the current zone and push past $1.52 with volume confirmation, $TIA may see a relief rally toward $1.60–$1.66.
However, until the asset reclaims the 50 EMA and invalidates the bearish RSI/MACD alignment, upside remains limited. A decisive breakdown below $1.43 would likely trigger a move toward the $1.30 psychological level — a zone not visited since the April capitulation phase.
Celestia Price Forecast Table: July 6, 2025
| Indicator/Zone | Level (USD) | Signal |
| Resistance 1 | $1.52 | Local resistance near 20 EMA (4H) |
| Resistance 2 | $1.66 | Rejection zone and previous high |
| Support 1 | $1.45 | Key intraday support |
| Support 2 | $1.38 | Next structure support |
| RSI (30-min) | ~39 | Bearish bias |
| MACD (30-min) | Bearish crossover | Fading momentum |
| EMA Cluster (20–100) (4H) | $1.50–$1.56 | Dynamic resistance |
| Bollinger Bands (4H) | Widening | Downside volatility expansion |
| Netflow (On-chain) | -$208K | Bearish pressure, capital exiting |
Disclaimer: The information presented in this article is for informational and educational purposes only. The article does not constitute financial advice or advice of any kind. Coin Edition is not responsible for any losses incurred as a result of the utilization of content, products, or services mentioned. Readers are advised to exercise caution before taking any action related to the company.