After weeks of compression, XRP price is now testing a critical trendline at the top of a long-standing weekly descending channel. The battle between bulls and bears is intensifying near the $2.22 level, with multiple timeframes signaling a potential directional move.
What’s Happening With XRP’s Price?
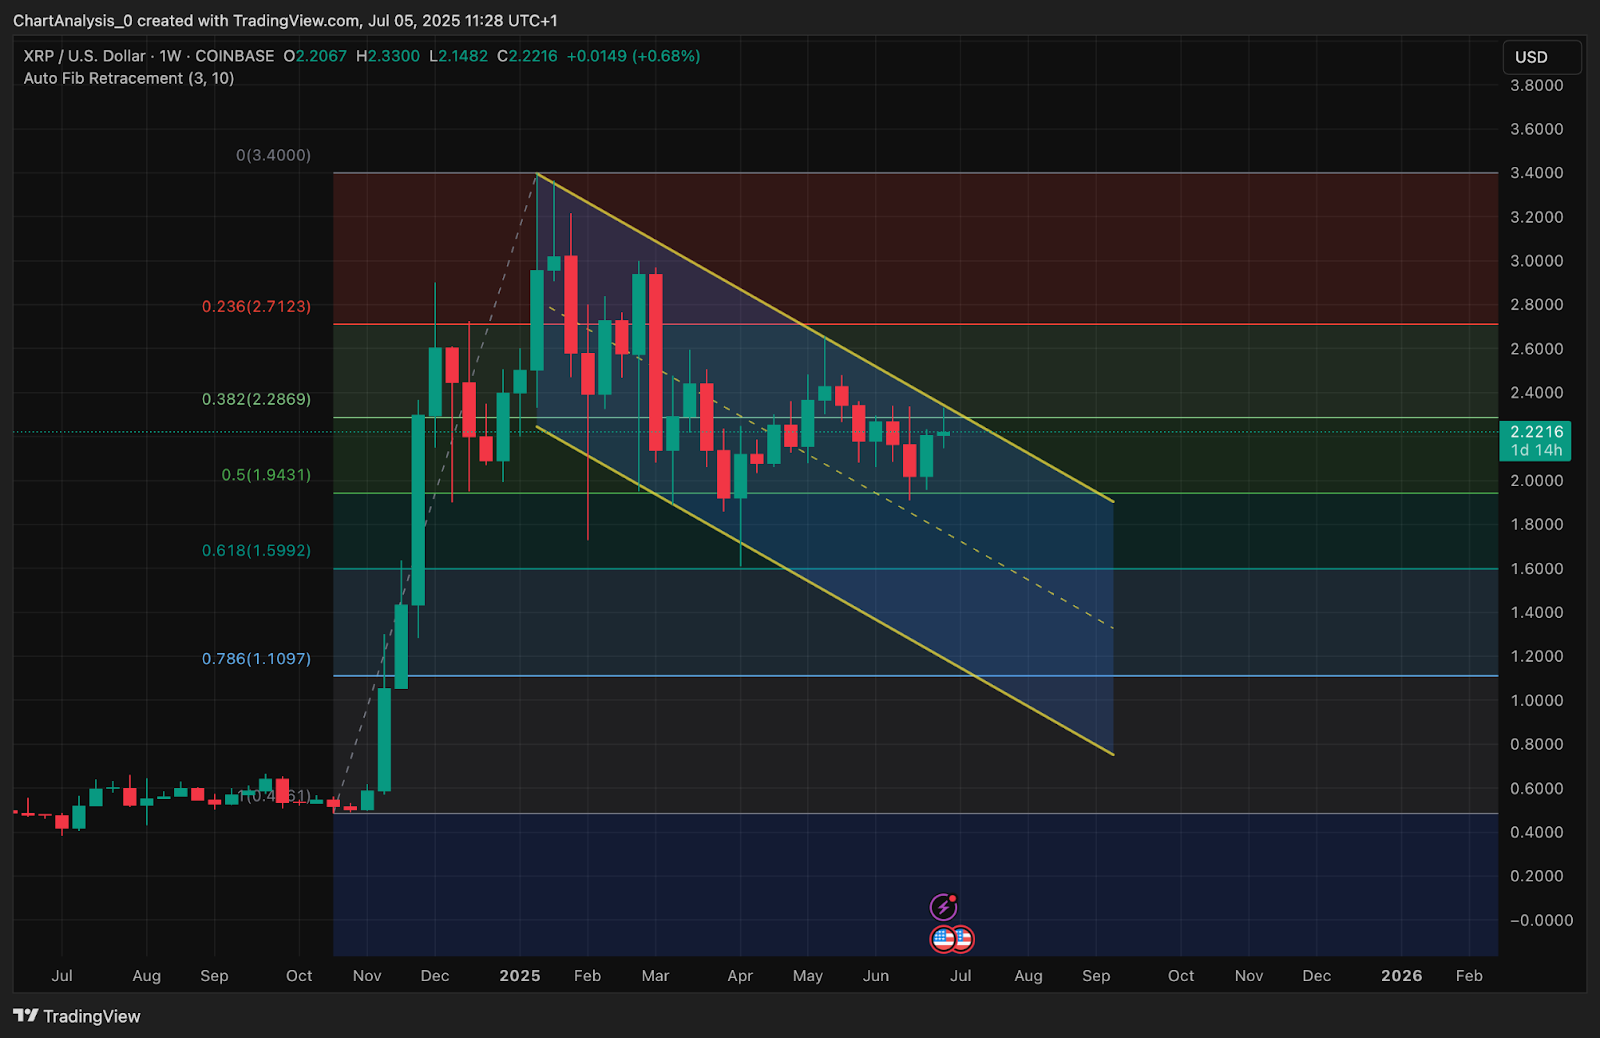
The most notable structure comes from the weekly chart, where XRP price action remains inside a well-defined descending parallel channel dating back to the Q1 high of $3.40. Price is now pressing against the channel’s upper boundary, aligned with the 0.382 Fibonacci retracement level near $2.28.
This resistance has held for several weeks, but with higher lows forming, bulls appear to be building pressure. A confirmed breakout from this descending channel could shift the longer-term trend, with upside targets near $2.71 (Fib 0.236) and $3.00+.
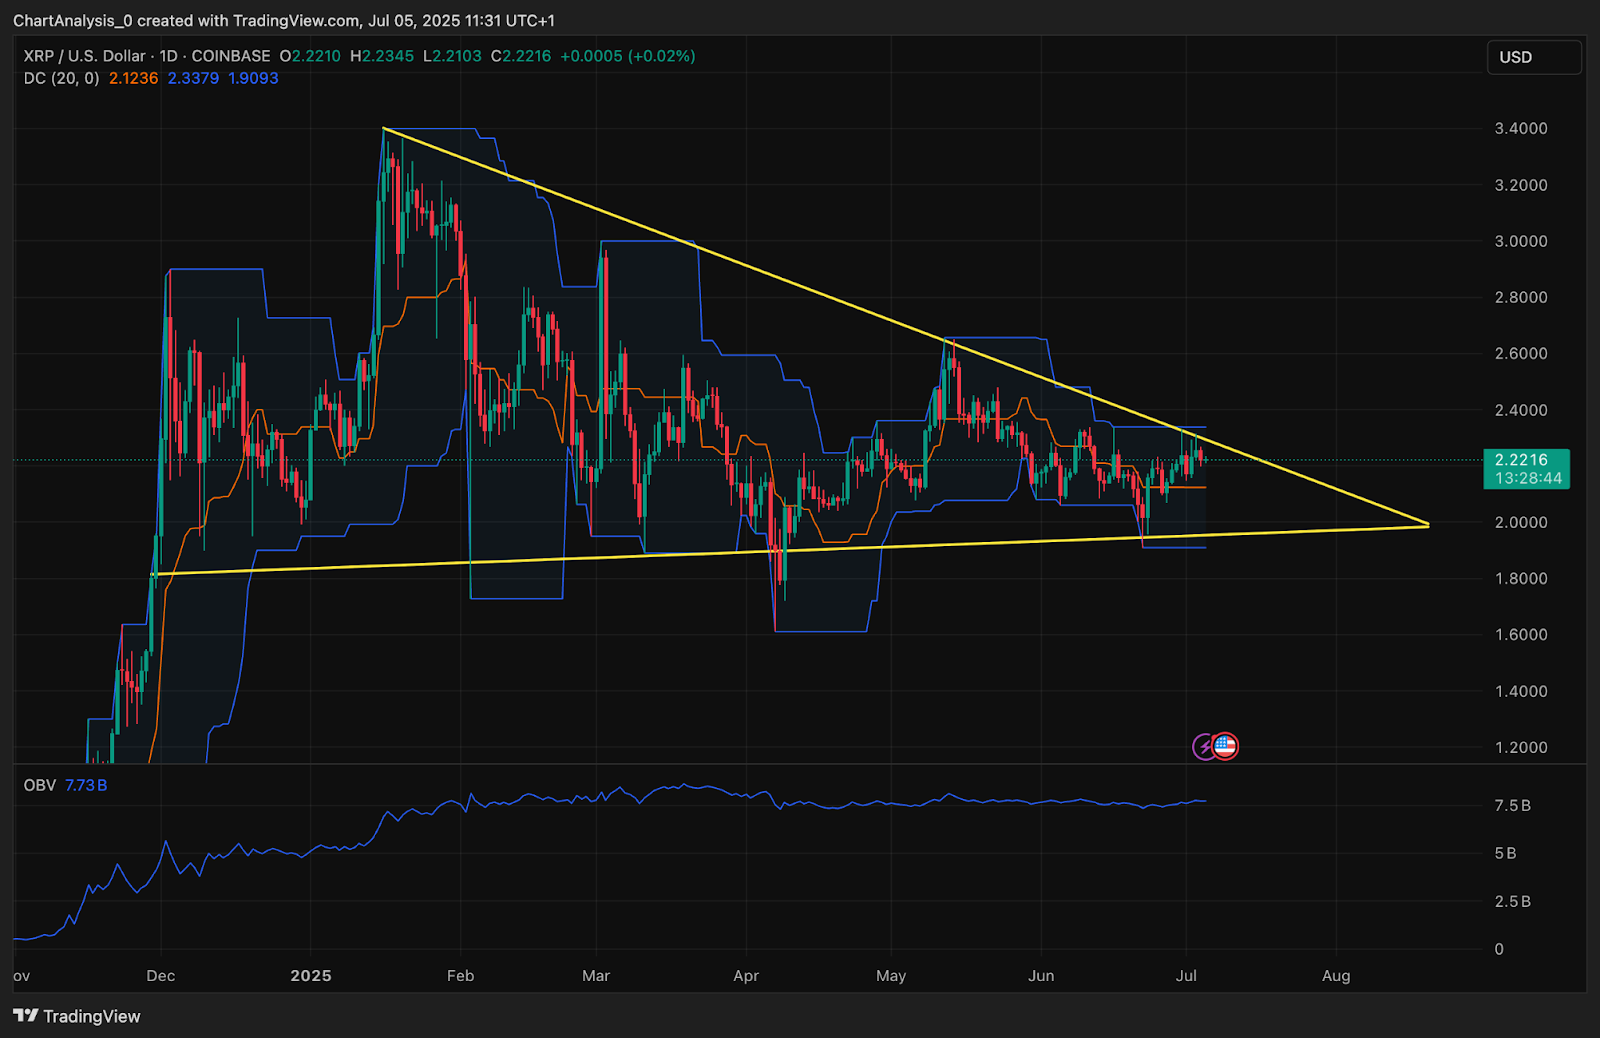
The daily chart shows XRP trading within a tightening triangle pattern, supported near $2.10 and capped near $2.30. Donchian Channel compression and steady OBV (~7.73B) confirm the coiling nature of the price structure.
On the 4-hour chart, XRP is trading above the 20/50/100 EMA cluster ($2.21–$2.22), offering dynamic support. However, repeated rejection from the upper Bollinger Band near $2.28 has prevented breakout continuation.
Why XRP Price Going Down Today?
The answer to why XRP price going down today lies in rejection from historical Smart Money zones and weakening momentum.
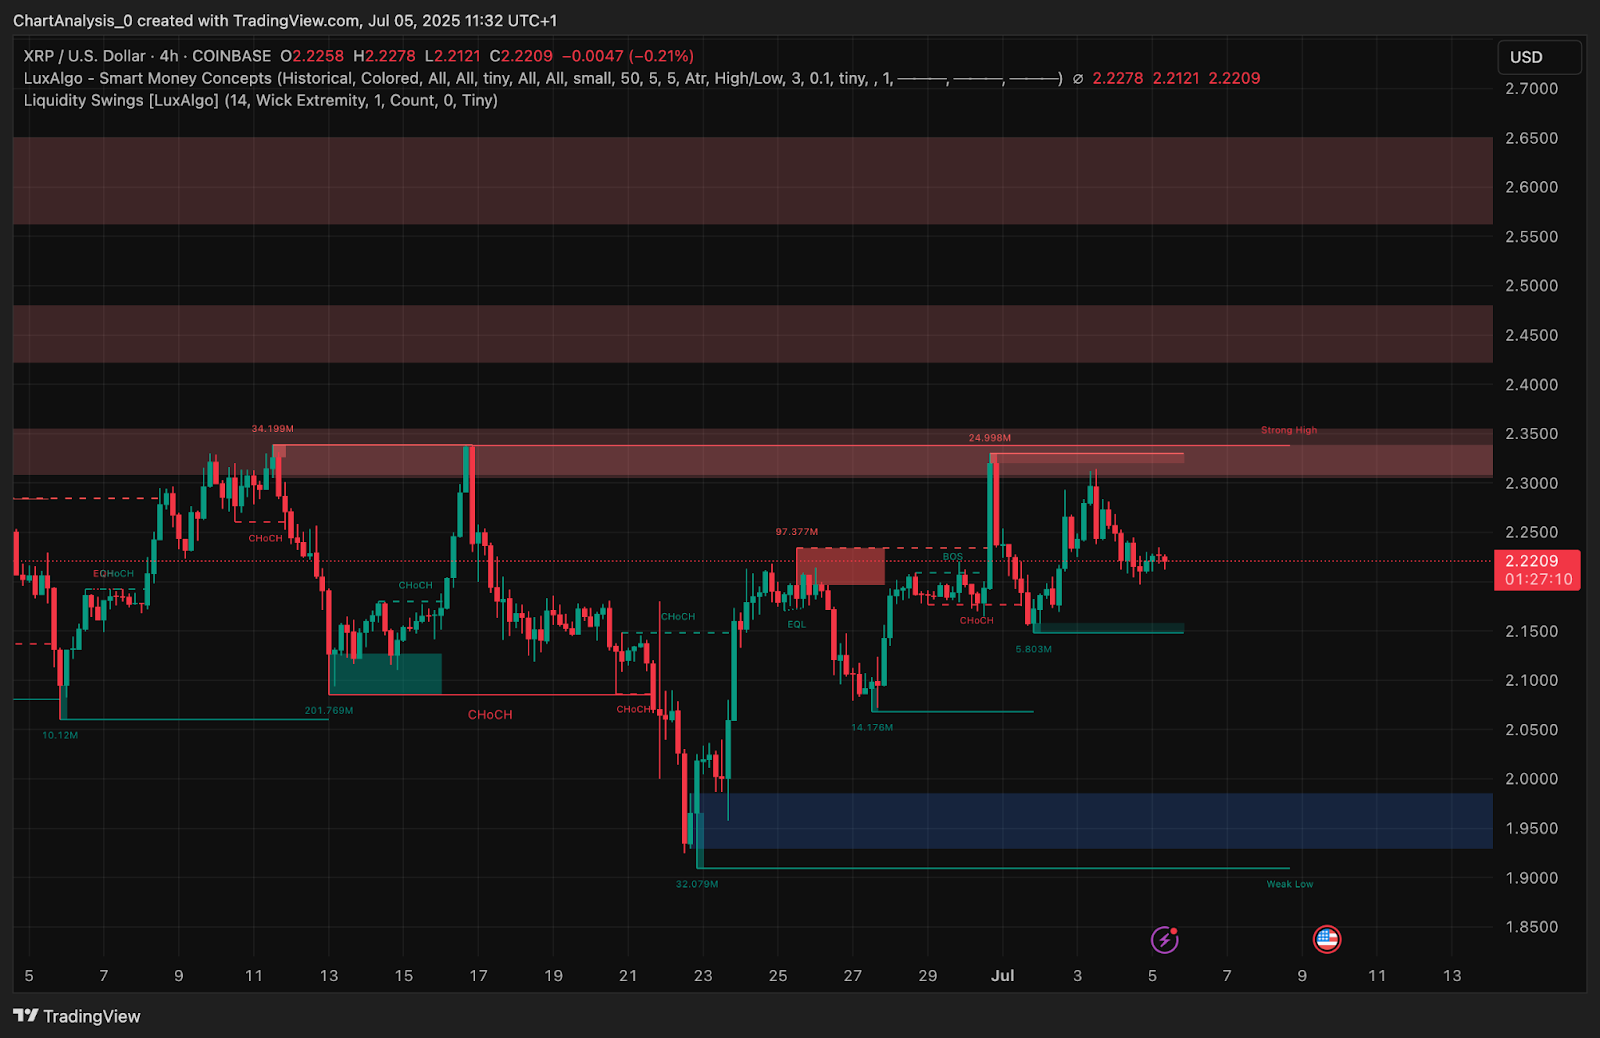
Liquidity data on the 4-hour chart shows a firm rejection from the $2.28–$2.34 supply region, labeled as a major CHoCH and “Strong High” zone. Despite attempts to reclaim this range, volume has failed to follow through.
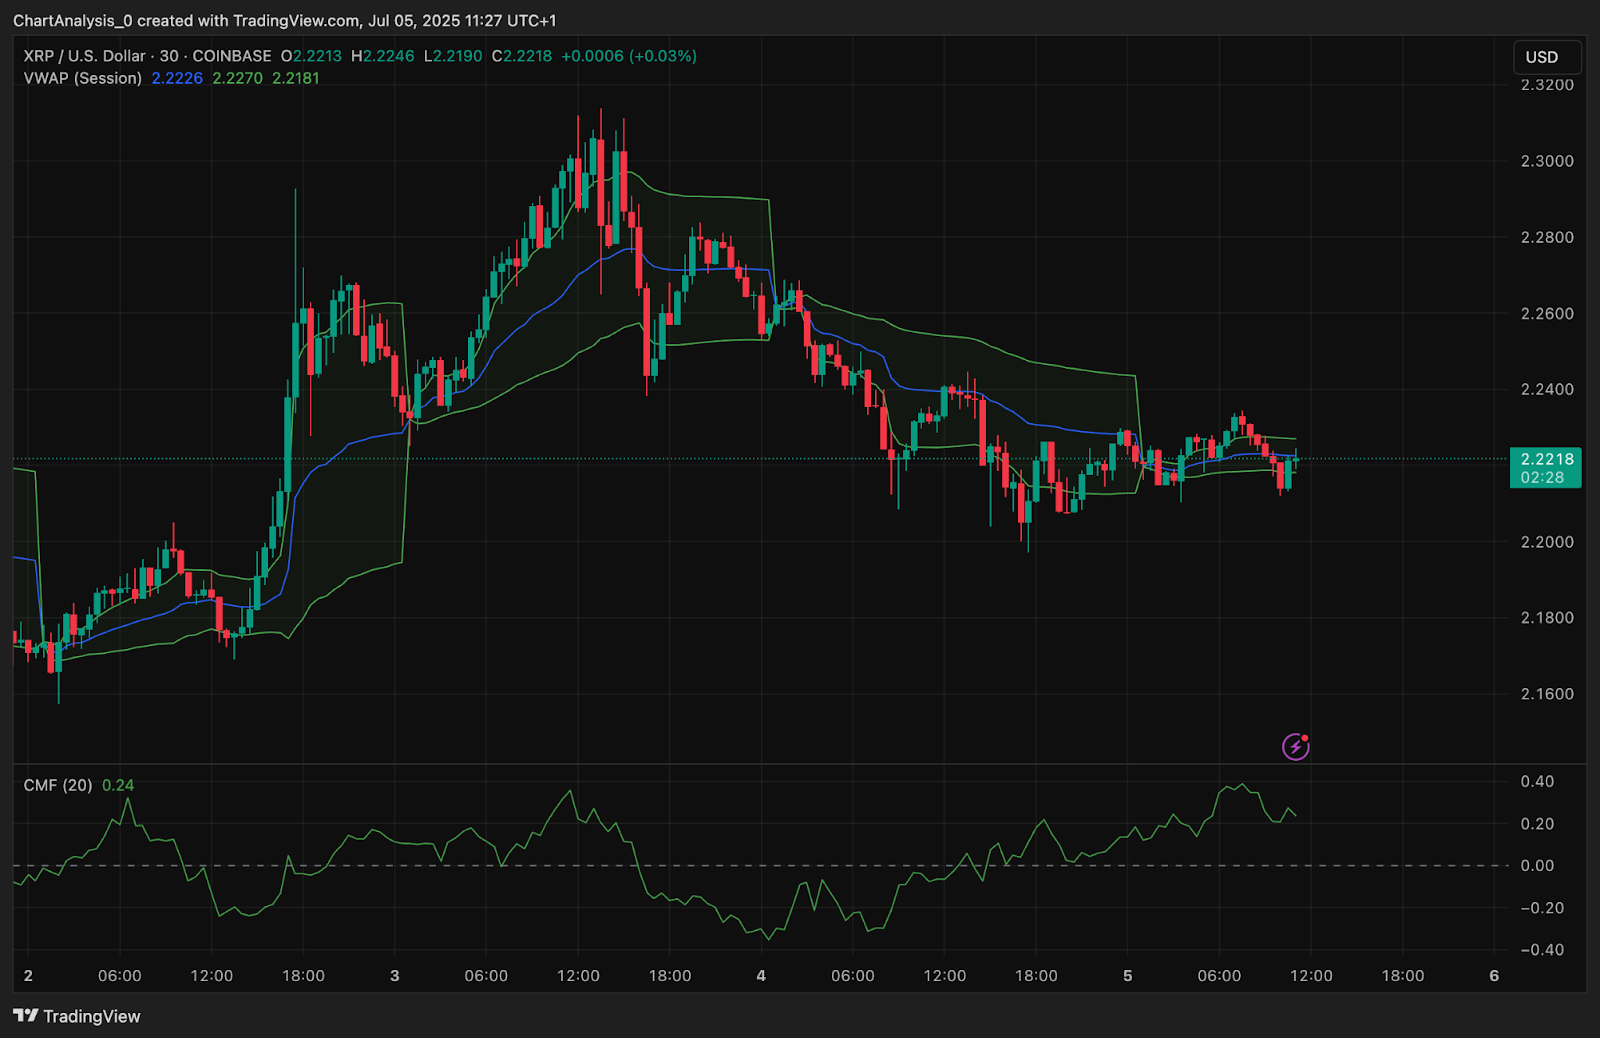
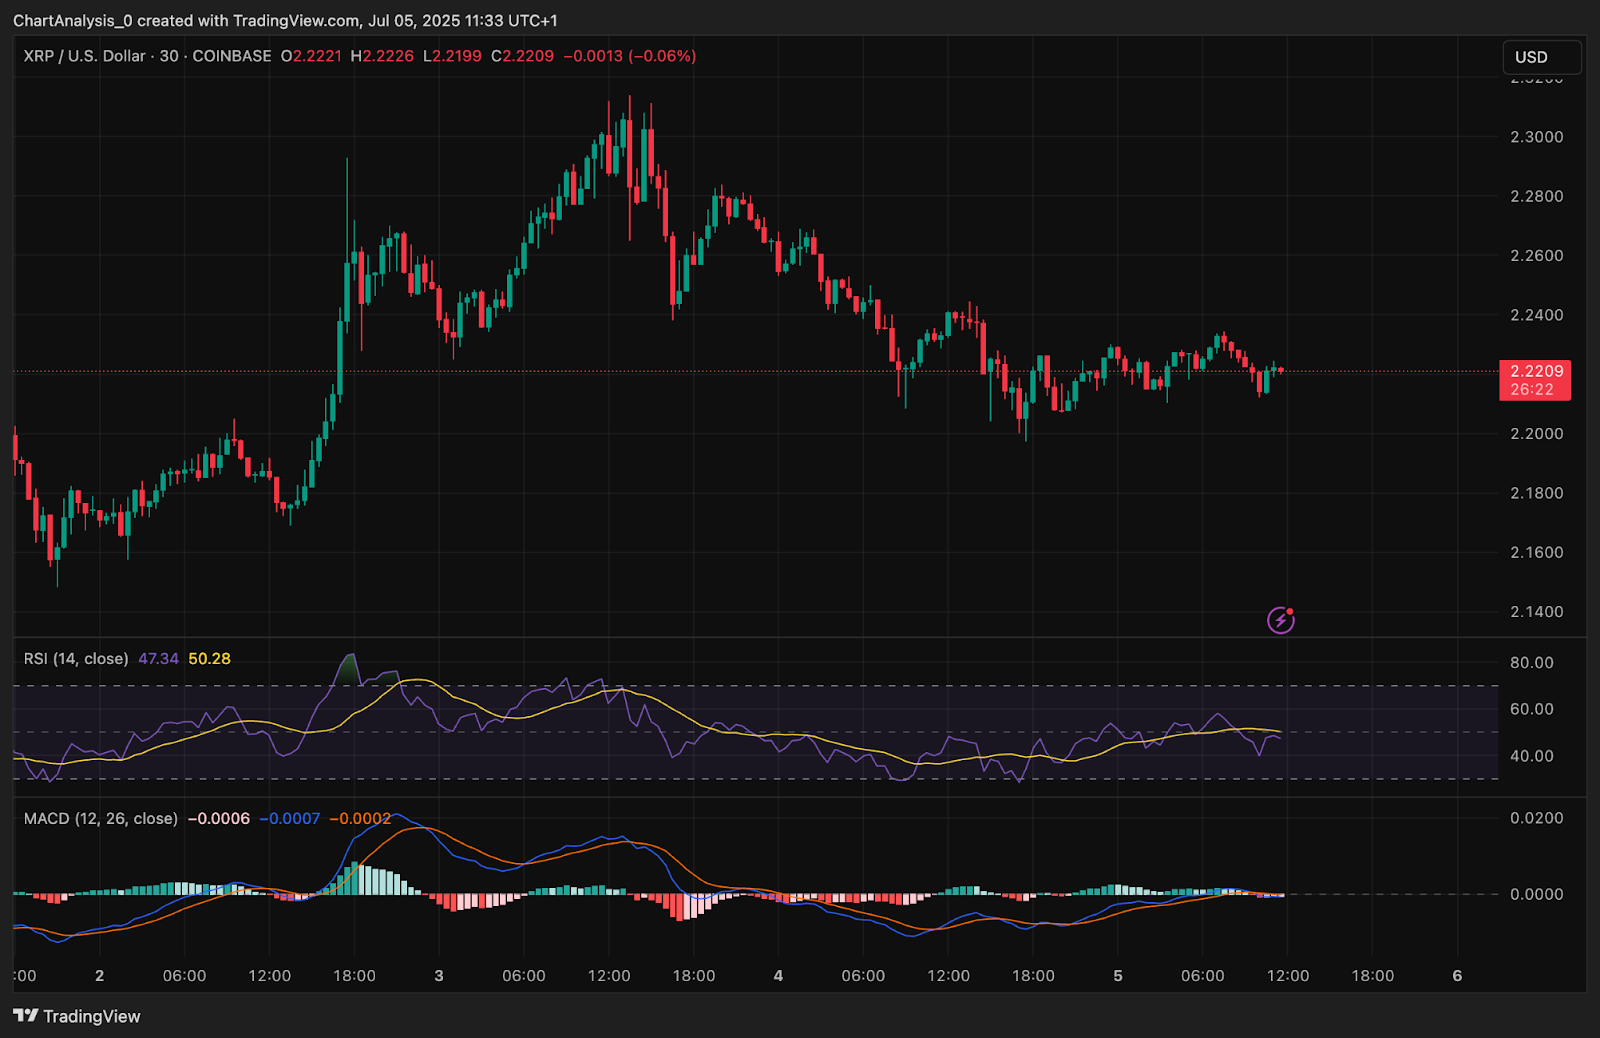
RSI on the 30-minute chart sits around 47.3, just below neutral, and MACD is flat—signaling indecision. Price is also currently below session VWAP ($2.2226), keeping bulls in check.
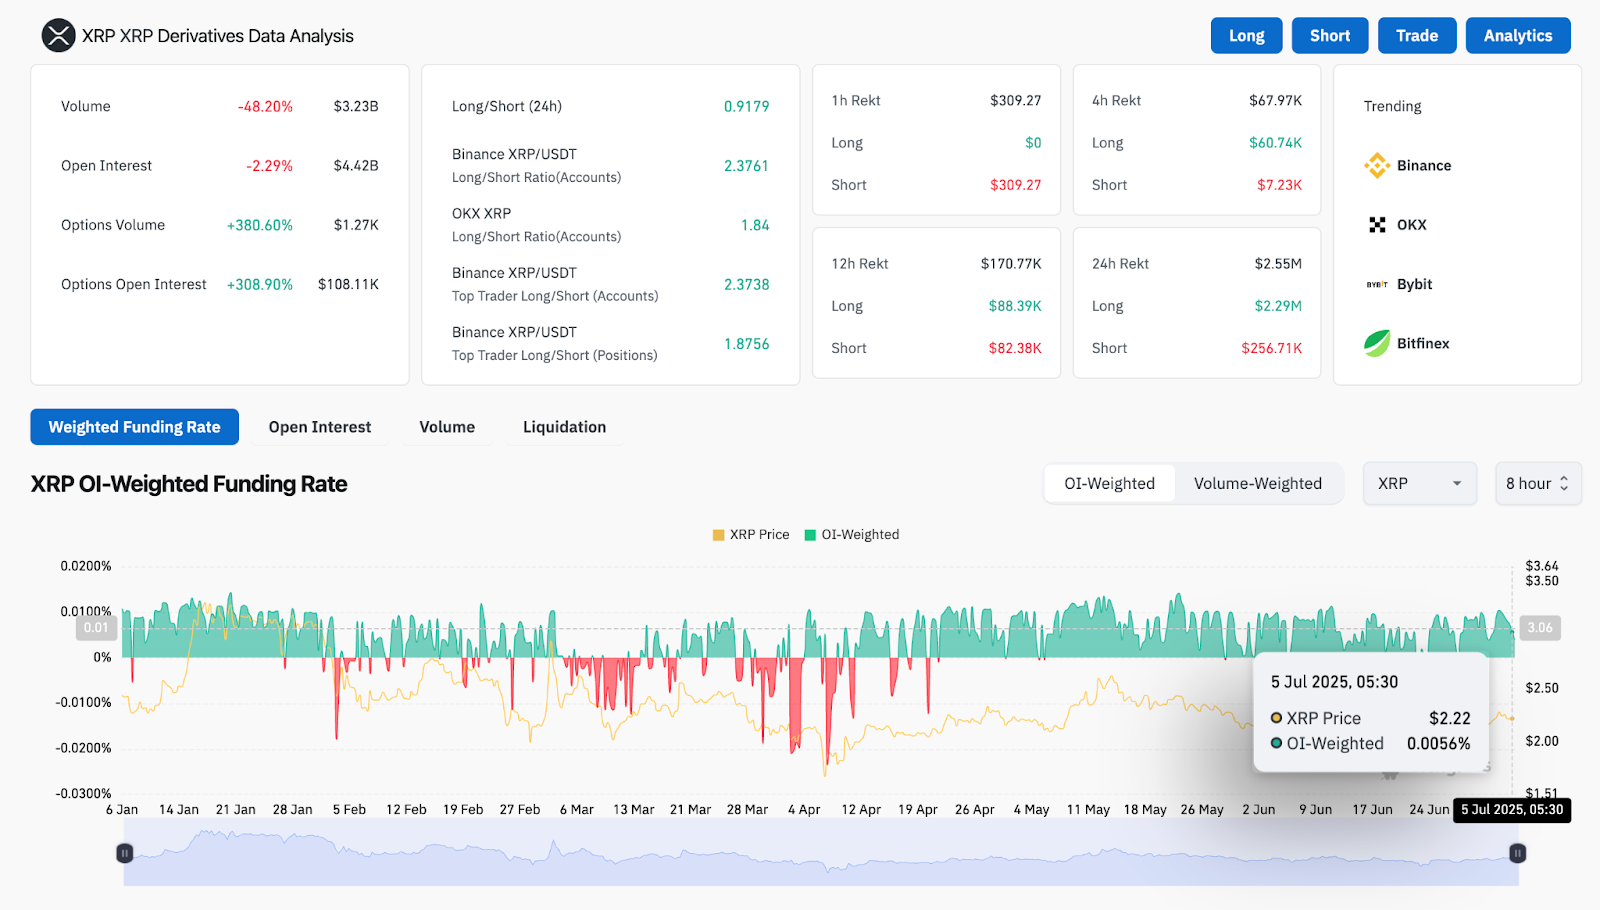
Derivatives data confirms a cautious tone. Open interest has dropped by 2.29%, while options volume surged 380%, indicating a shift toward hedging rather than outright directional bets. The long/short account ratio on Binance and OKX shows a heavy long bias (above 2.3), exposing the market to potential downside if bulls lose control.
Compression Across All Timeframes Signals Volatility Ahead
XRP price today is compressing within both short-term triangles and a macro weekly downtrend channel. This rare multi-timeframe alignment typically precedes significant breakout moves.
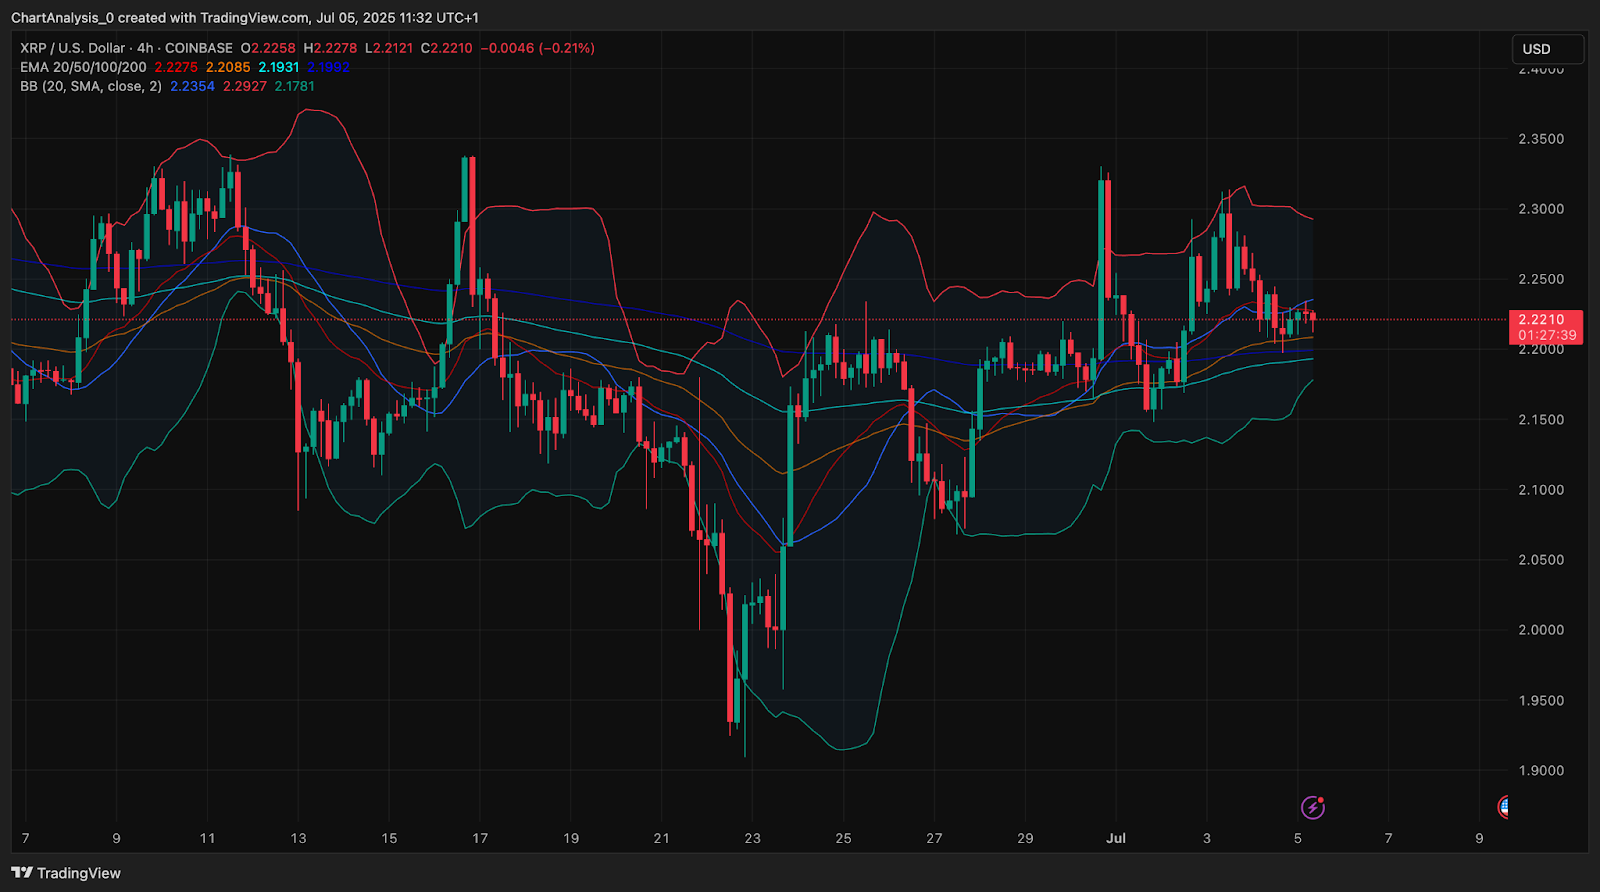
On the 4-hour chart, Bollinger Bands are narrowing, and price is pinned between EMA support ($2.21) and the upper band resistance ($2.28). CMF remains positive at 0.24, showing light capital inflow, but not enough to confirm a breakout.
Weekly Fib retracement levels are now acting as key pivots. A breakout above $2.28 would target the 0.236 level near $2.71, while failure to hold above $2.20 could drag XRP toward the 0.5 and 0.618 Fib zones at $1.94 and $1.59 respectively.
XRP Price Prediction: Short-Term Outlook (24h)
If bulls manage to push XRP price above the $2.28 resistance with strong volume and RSI confirmation above 55, price may test $2.34 followed by $2.42. A clean breakout from the weekly descending channel would confirm a broader reversal.
On the downside, failure to hold $2.20 opens the door toward $2.14 and then $2.08. A close below the rising support of the triangle would invalidate the bullish structure and reintroduce bearish momentum.
Market participants should monitor reaction around the Fib 0.382 level ($2.2869) and descending channel boundary. Any surge in volume or funding rate shift could trigger a decisive move.
XRP Price Forecast Table: July 6, 2025
| Indicator/Zone | Level (USD) | Signal Description |
| Resistance 1 | $2.28 | Fib 0.382 + descending channel ceiling |
| Resistance 2 | $2.34 | Liquidity zone + prior CHoCH region |
| Support 1 | $2.20 | Bollinger midline + EMA20/50 cluster |
| Support 2 | $2.14 | Triangle base + minor liquidity pocket |
| Weekly Fib Support | $1.94–$1.59 | 0.5–0.618 retracement zones |
| RSI (30-min) | 47.3 | Neutral-bearish momentum |
| MACD (30-min) | Flat | No momentum divergence |
| CMF | 0.24 | Weak inflow, fading |
| OBV | 7.73B | No distribution, but no accumulation spike |
| VWAP | $2.2226 | Price hovering near, but not above |
Disclaimer: The information presented in this article is for informational and educational purposes only. The article does not constitute financial advice or advice of any kind. Coin Edition is not responsible for any losses incurred as a result of the utilization of content, products, or services mentioned. Readers are advised to exercise caution before taking any action related to the company.