After recovering sharply from late June lows, Bitcoin price has entered a consolidation range below the $110,000 barrier. The 4-hour structure remains within an ascending support line, but momentum indicators show signs of exhaustion. Bulls face strong resistance at $110,500, while short-term supports have formed near $107,200.
What’s Happening With Bitcoin’s Price?
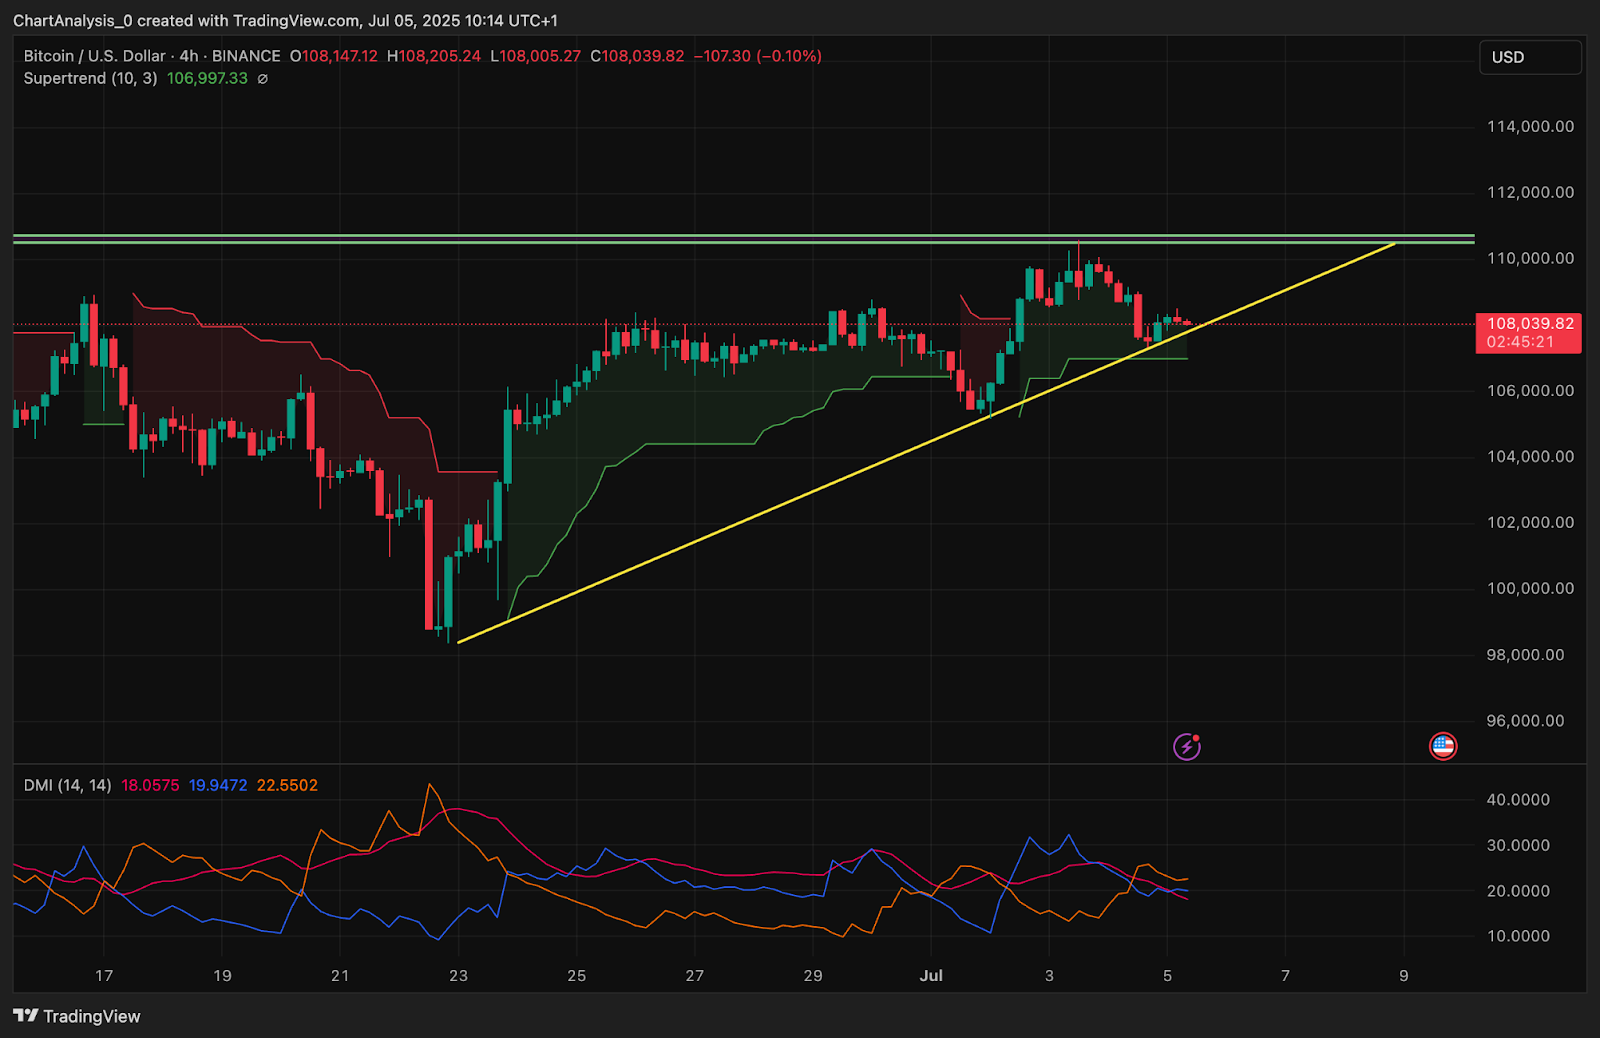
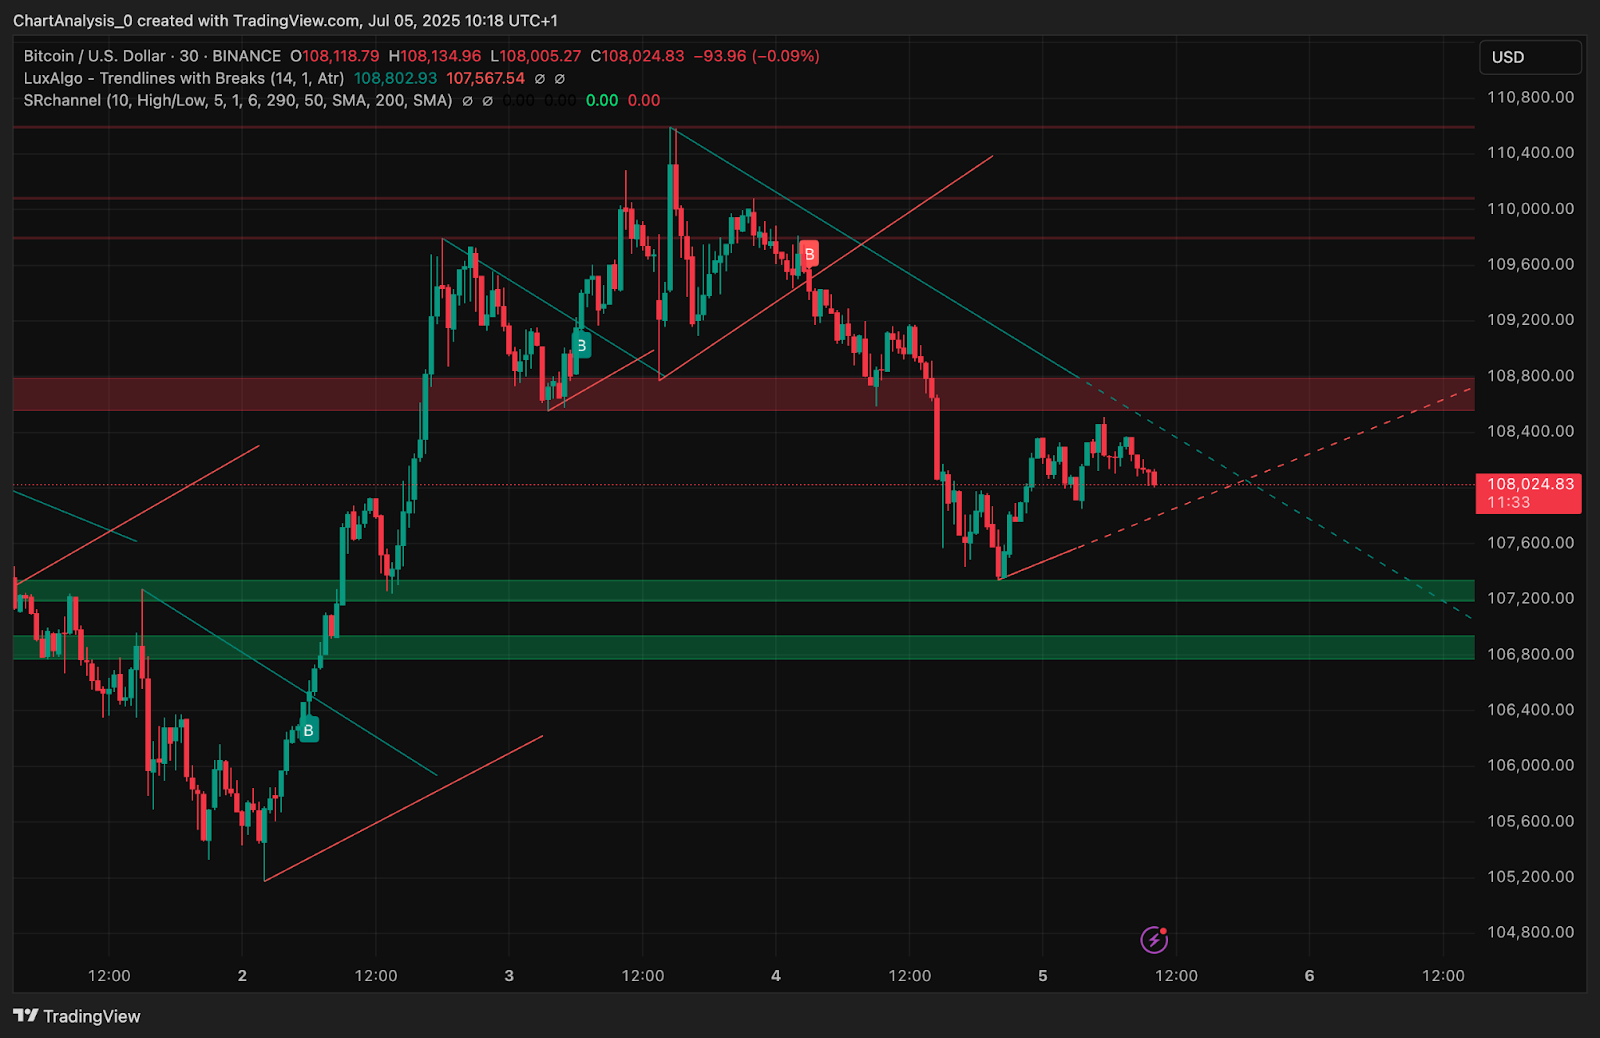
The current Bitcoin price action is testing a key ascending trendline that originates from the June 23 low. Price has stalled near $108,000 after rejecting the $110,800–$111,000 supply zone, where multiple failed breakouts occurred.
The Supertrend indicator remains bullish above $106,997, and the rising trendline is intact. However, the DMI shows weakening strength in both +DI and -DI, with ADX sliding, suggesting reduced trend momentum.
The 4-hour Bollinger Bands are contracting, indicating reduced volatility. Price is currently riding the mid-band near $108,600. A breakout beyond the upper band ($110,600) or a break below $107,000 will likely define the next directional move.
Why Bitcoin Price Going Down Today?
The question of why Bitcoin price going down today can be answered by observing bearish divergences and resistance exhaustion.
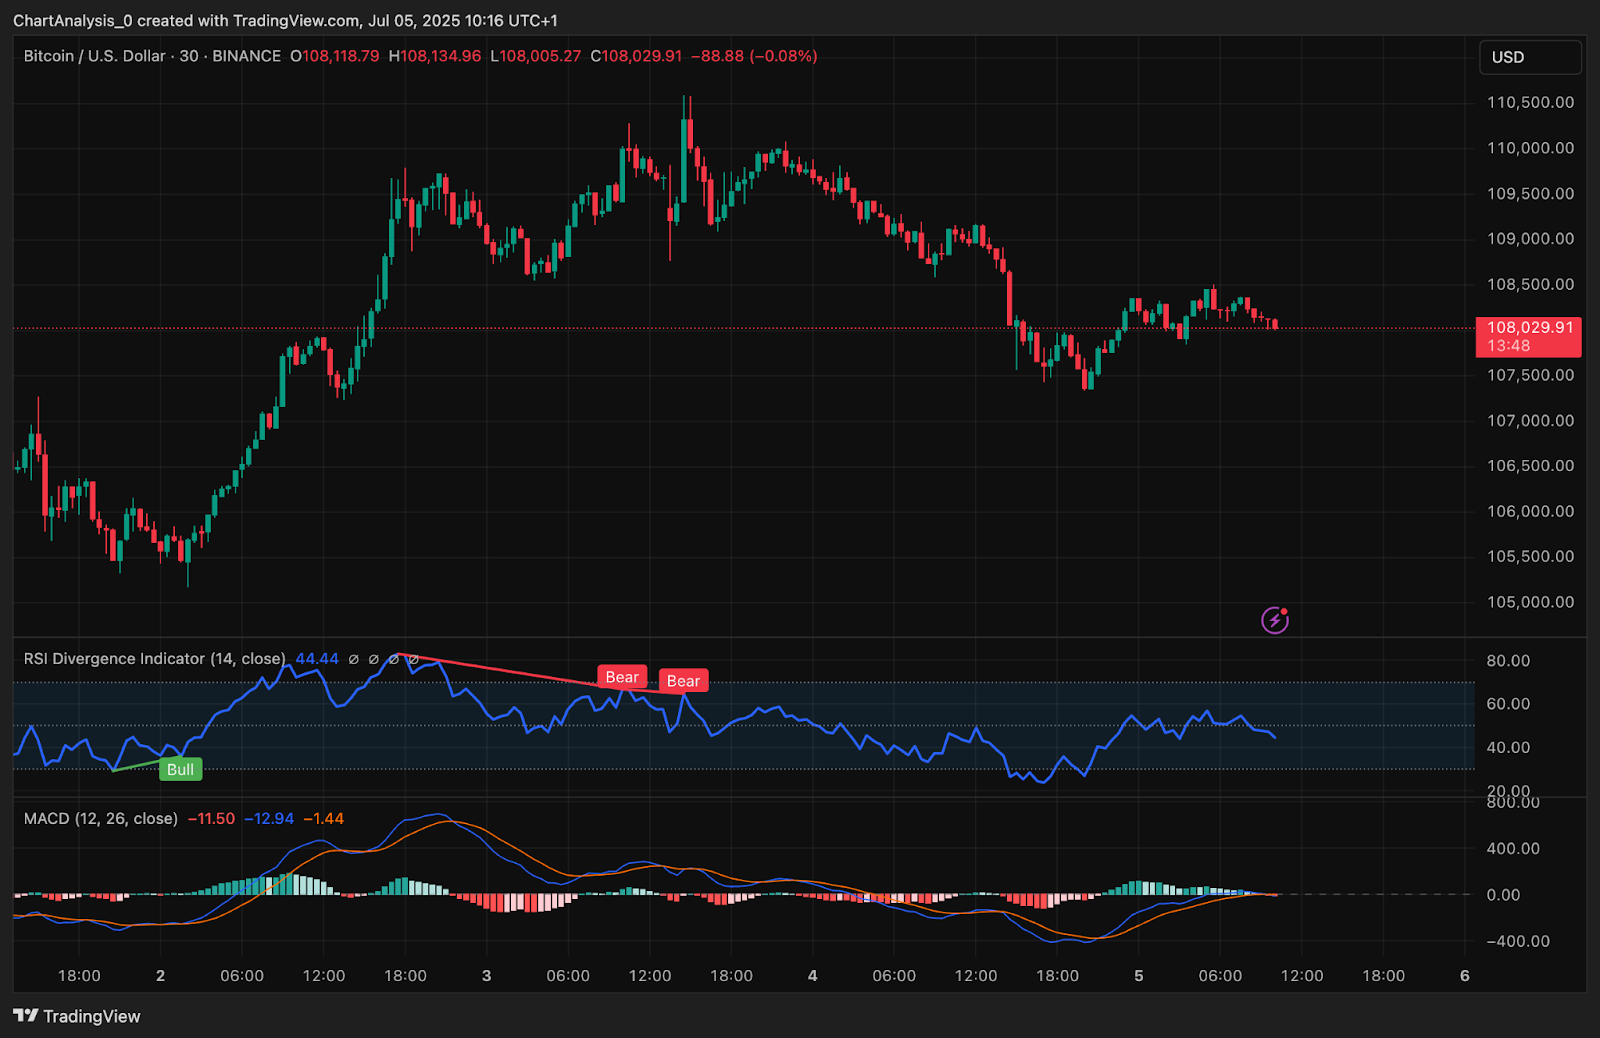
On the 30-minute chart, the RSI shows two clear bearish divergence labels while price made higher highs, signaling weakening bullish momentum. The RSI currently sits near 44.4, indicating a shift below neutral.
MACD on the same timeframe shows a negative crossover and flat histogram, further confirming the lack of upward momentum.
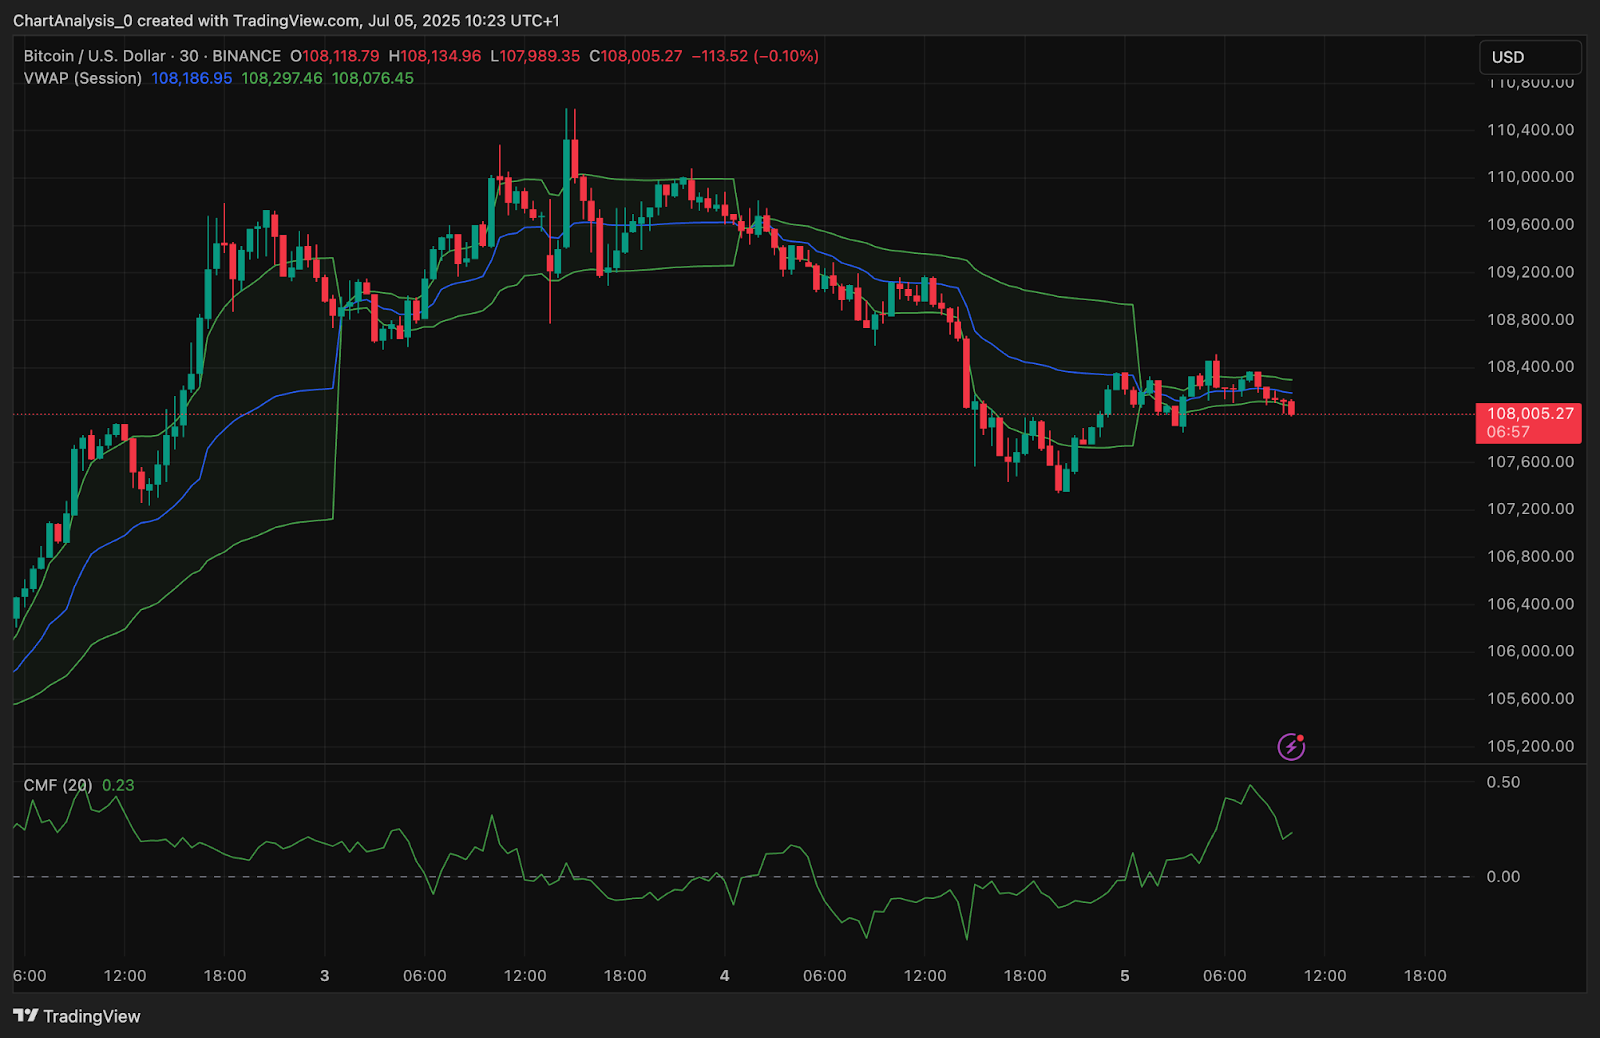
VWAP analysis shows BTC trading just below the session VWAP of $108,186, with the upper deviation line acting as dynamic resistance. This is pressuring intraday traders and short-term scalpers.
Chaikin Money Flow (CMF) remains positive (0.23), suggesting inflow remains supportive, although it has declined slightly from earlier sessions.
Liquidity zones on the lower timeframes indicate strong demand between $107,000 and $106,800, while overhead supply sits at $108,800–$109,400, capping short-term rallies.
Bollinger Bands Compression and Trendline Hold Define Breakout Risk
The Bitcoin price today continues to coil within a compression zone as indicated by tight Bollinger Band width and symmetrical triangle structure on lower timeframes.
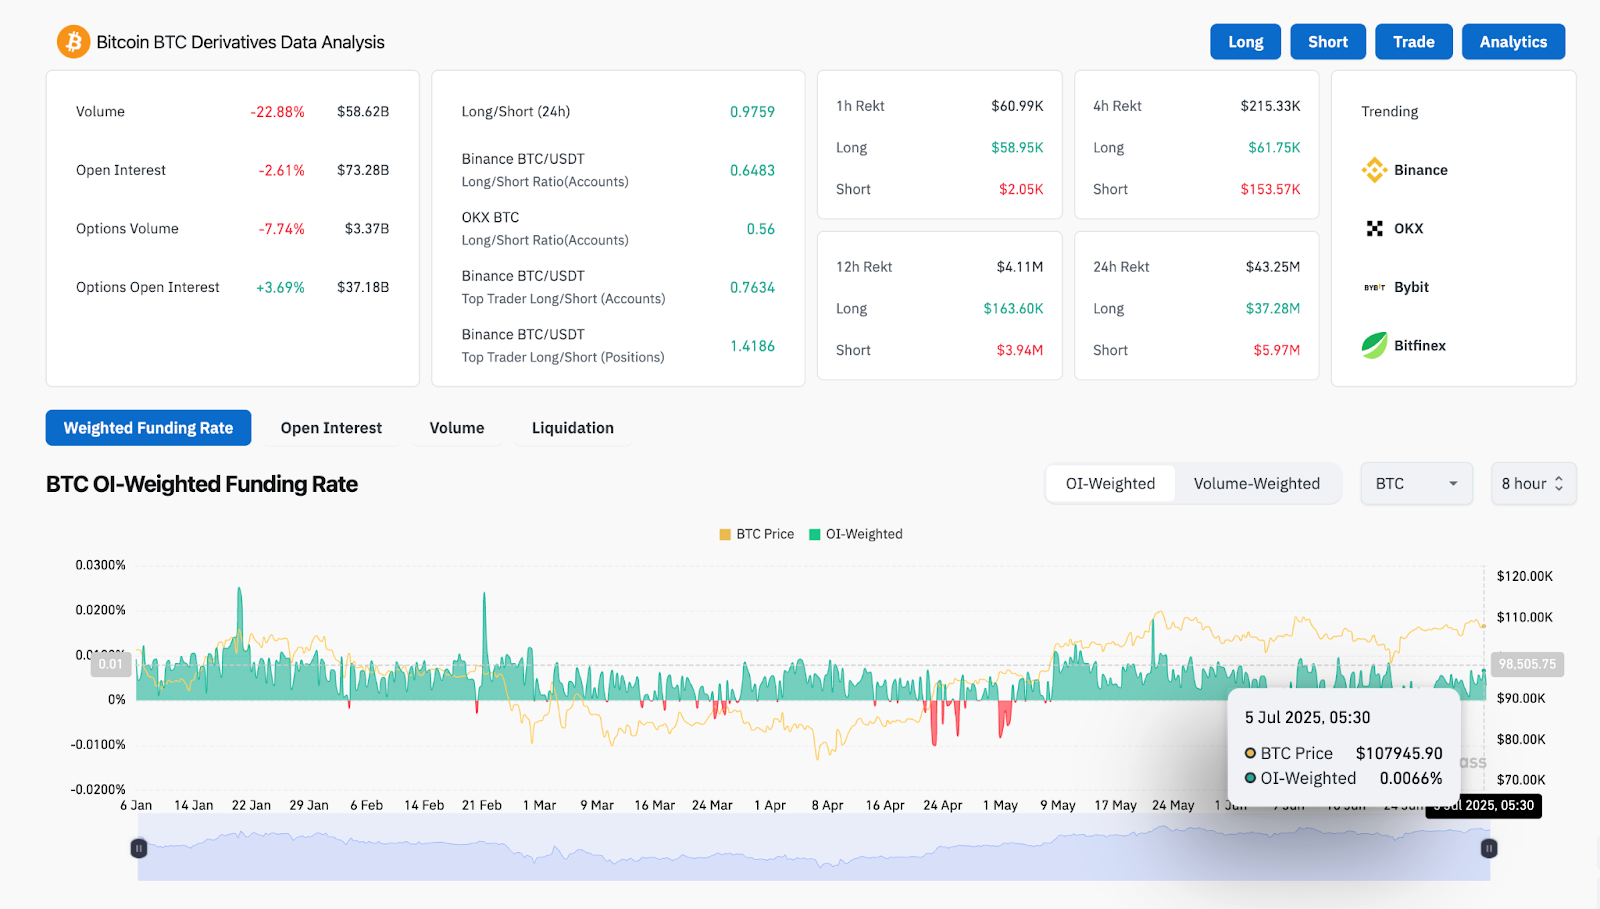
Open interest has dropped -2.6% in the past 24 hours, while options volume dipped -7.7%. This reflects a general cooldown in aggressive positioning. Despite this, options open interest rose +3.69%, signaling hedge-based accumulation, likely due to directional uncertainty.
The derivatives dashboard also shows more long bias from top traders (Binance ratio 1.41), but the overall long/short account ratio across exchanges remains neutral at 0.97 — another sign of hesitation.
BTC Price Prediction: Short-Term Outlook (24h)
The next 24 hours are pivotal. If bulls maintain the ascending trendline and reclaim the $108,800–$109,000 resistance band, Bitcoin price spikes toward $110,500 are likely. However, rejection near this zone and a break below $107,000 could open the door toward $106,200 and possibly $105,500.
Traders should monitor whether price can hold above the Supertrend support at $106,997 and the lower Bollinger Band. Any candle close below these levels with volume may confirm a breakdown. If the RSI recovers above 50 and MACD crosses positive again, upside targets will re-engage.
Bitcoin Price Forecast Table: July 6, 2025
| Indicator/Zone | Level (USD) | Signal Description |
| Resistance 1 | $108,800 | Supply zone ceiling, intraday cap |
| Resistance 2 | $110,500 | Triangle breakout target |
| Support 1 | $107,000 | Trendline + structure base |
| Support 2 | $106,200 | Lower liquidity pocket |
| RSI (30-min) | 44.4 | Bearish divergence + below neutral |
| MACD (30-min) | -1.44 | Bearish crossover confirmed |
| Bollinger Band Mid (4H) | $108,657 | Pivot area for volatility expansion |
| VWAP Session Level | $108,186 | Currently trading just below |
| Supertrend (4H) | $106,997 | Key dynamic support |
| CMF (30-min) | 0.23 | Positive inflow, but weakening |
Disclaimer: The information presented in this article is for informational and educational purposes only. The article does not constitute financial advice or advice of any kind. Coin Edition is not responsible for any losses incurred as a result of the utilization of content, products, or services mentioned. Readers are advised to exercise caution before taking any action related to the company.