Following months of unrelenting decline and low trading activity, Shiba Inu is beginning to show signs of a possible reversal. As of press time, SHIB is trading at about $0.0000113, indicating a slight but discernible local uptrend that is developing in spite of the meme coin industry's general weakness.
According to the chart, SHIB has been consolidating above the critical support range, which is located between $0.0000095 and $0.0000110. Over the last few weeks, this zone has consistently absorbed selling pressure, which is encouraging for any attempt at a bounce. Furthermore, the Relative Strength Index (RSI) has moved out of the extremely oversold area and is currently trading close to 42, indicating that the bearish momentum is finally waning.
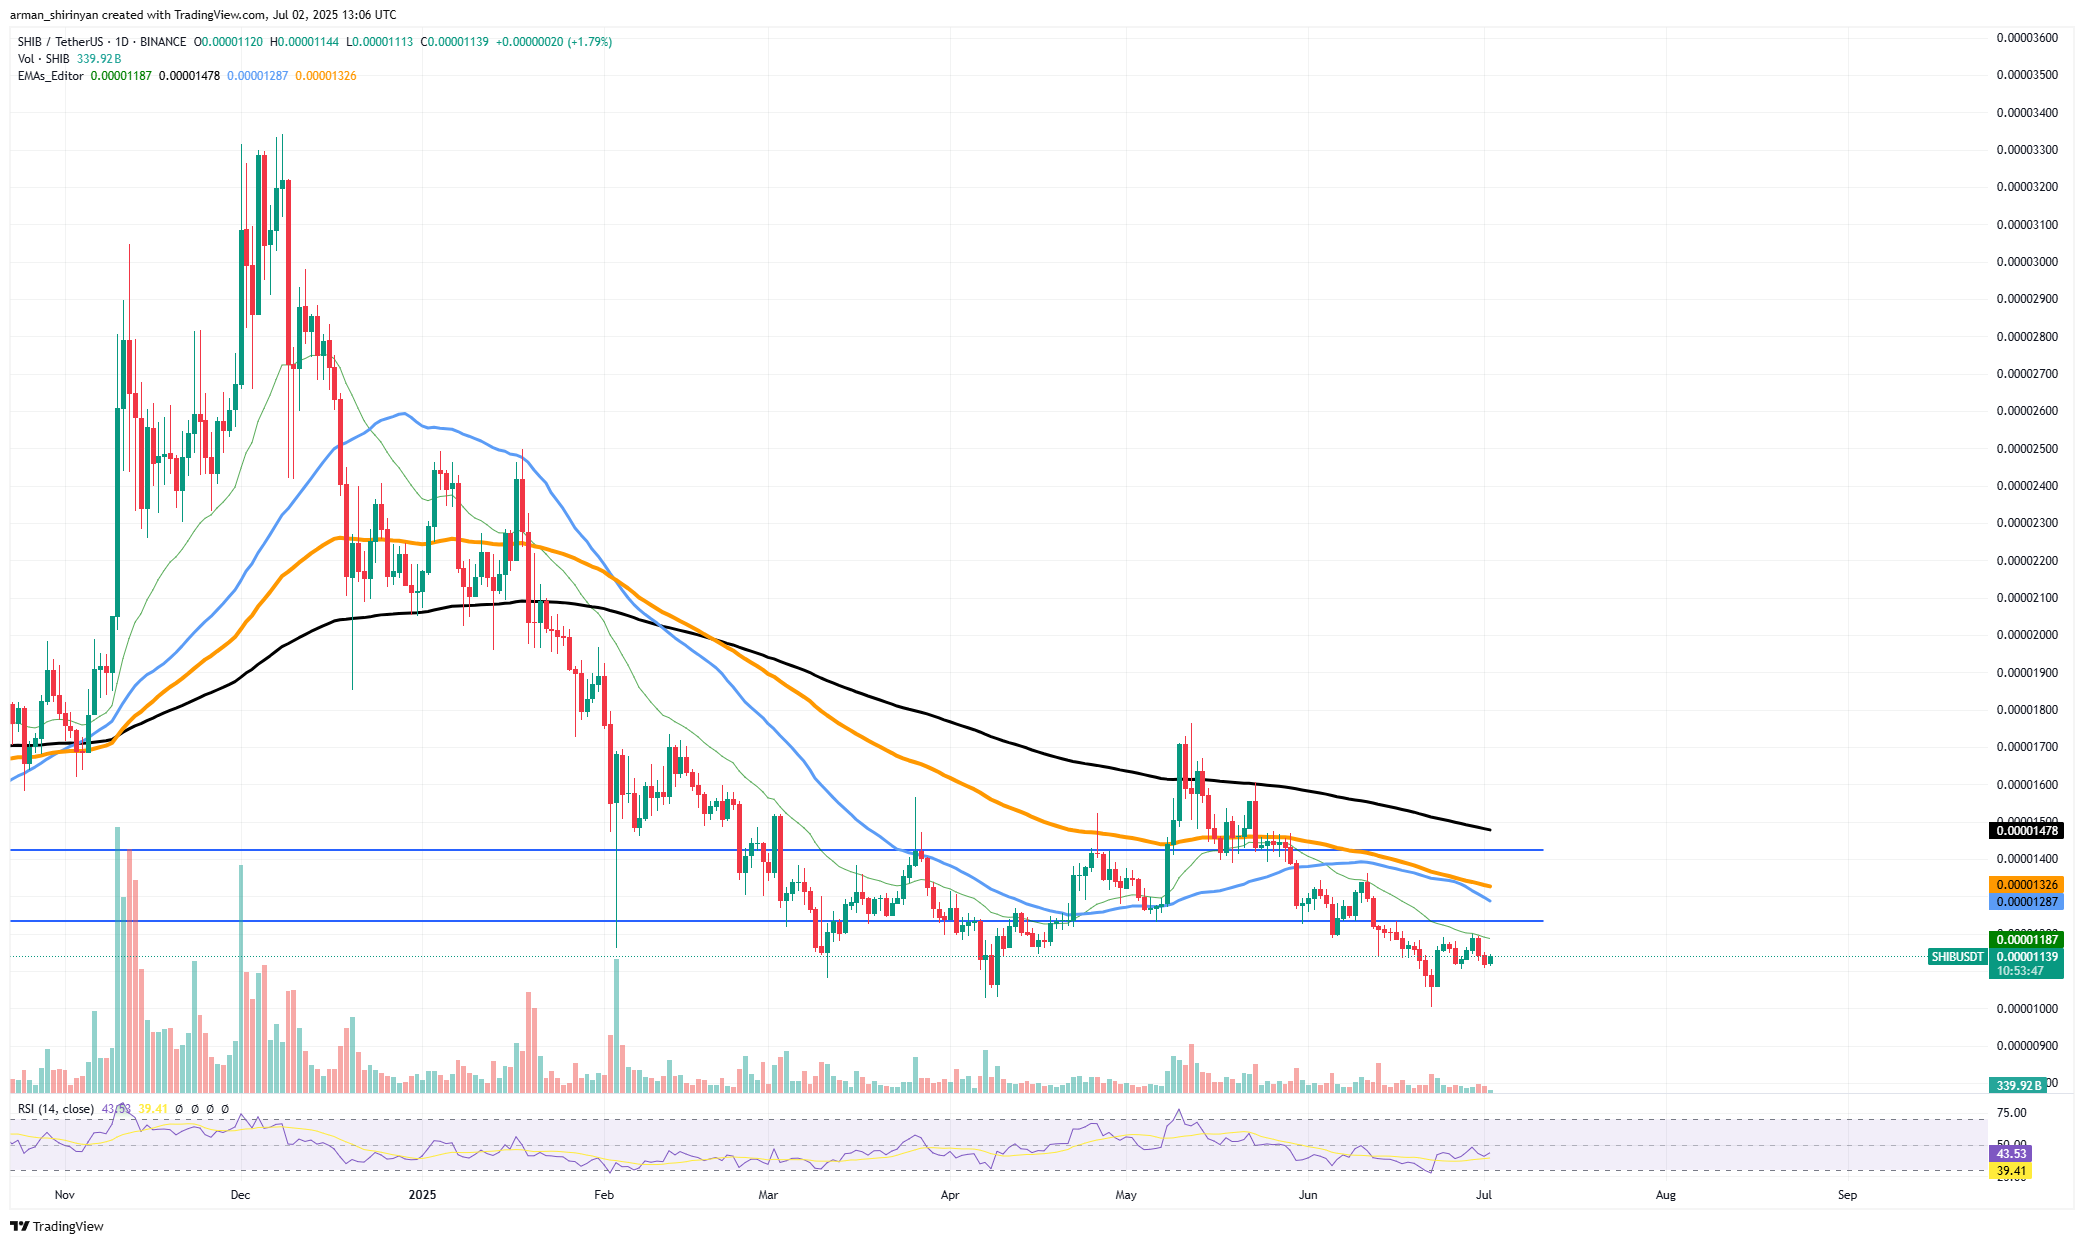
In the past recoveries, these averages frequently signaled the start of countertrend rallies. It would support the claim that the asset is moving from a downtrend into a more extensive recovery phase if the price could retest and break through the next cluster of resistance, especially the 50-day EMA around $0.00001286.
In contrast to the high-volatility periods earlier this year, volume is still comparatively muted, so traders should not get too excited about an explosive breakout. The local trend of higher lows, however, suggests that buyers are progressively regaining confidence. SHIB will be able to prove that the market is definitely entering a reversal scenario rather than just another dead cat bounce if it can continue to rise and recover $0.0000130-$0.0000140.
Solana moves up
Although Solana does not have a golden cross, one of the most common technical catalysts that traders look for, it has been quietly maintaining an upward trend. When the 50-day moving average crosses over into the 200-day moving average, it creates a golden cross — which frequently indicates a significant change in market sentiment.
However, Solana has been able to increase in value even in the absence of this technical validation demonstrating the asset's inherent resilience. SOL is still working to level off above the $140 support level, trading at about $147 at press time. Since June the local price structure has produced a string of higher lows, indicating a phase of modest accumulation that may progress into a longer-term advance.
However, the asset's 100-day and 200-day moving averages are closely clustered in the $160-$165 range, which represents a formidable ceiling. Solana's rallies have been frequently capped below $170 over the last quarter, which can be explained by this convergence of resistance. The relative strength index (RSI), which is currently trading close to 48, suggests that SOL is not yet overbought and has the potential to rise if buying interest resumes.
A further encouraging indication that larger holders are not liquidating their positions in bulk is the volume, which has remained comparatively stable during recent pullbacks. In the future, traders should keep an eye on three crucial levels. First, in order to preserve the integrity of the upward trend, the $140 level needs to remain a local floor.
Speculations around Bitcoin
Once again Bitcoin is at the center of market speculation as it gets closer to a crucial resistance level that might determine its course in the upcoming weeks. Bitcoin is consolidating below a descending trendline that has limited its gains since the last significant rally, according to the chart.
Currently trading at about $107,400, Bitcoin is getting closer to the $110,000-$112,000, range which may serve as the starting point for a significant move toward the eagerly anticipated $120,000 breakout. There is currently no clear indication that the market is bullish or bearish. Indicating underlying accumulation, Bitcoin has set a string of higher lows since its March bottom around $82,000.
The rally is primarily driven by momentum traders and short liquidations rather than broad-based buying, as evidenced by the trendline's repeated rejections, which show a lack of conviction and new capital inflows. It would be important if there was a breakout above $112,000 since it would render the declining pattern invalid and pave the way for a surge into the $120,000 region.
In addition to being a psychological benchmark, that level extends the previous breakout measured move targets. However, prudence is necessary. With the RSI circling 51, there is a lot of space for volatility to go either way.
The market may find it difficult to maintain an impulsive move in the absence of fresh spot demand because volume is still muted, in comparison to strong spikes seen in earlier expansions. There is a greater chance that Bitcoin will retrace toward the 100-day moving average close to $100,500 if it is unable to overcome resistance. This could cause sentiment to return to uncertainty.