


 30
30
$XRP climbed to $2.21 on June 29, 2025, marking a 1.3% gain on the day. The cryptocurrency posted a 24-hour trading volume of $1.32 billion and a market capitalization of $130.54 billion, trading within an intraday range of $2.18 to $2.22.
$XRP
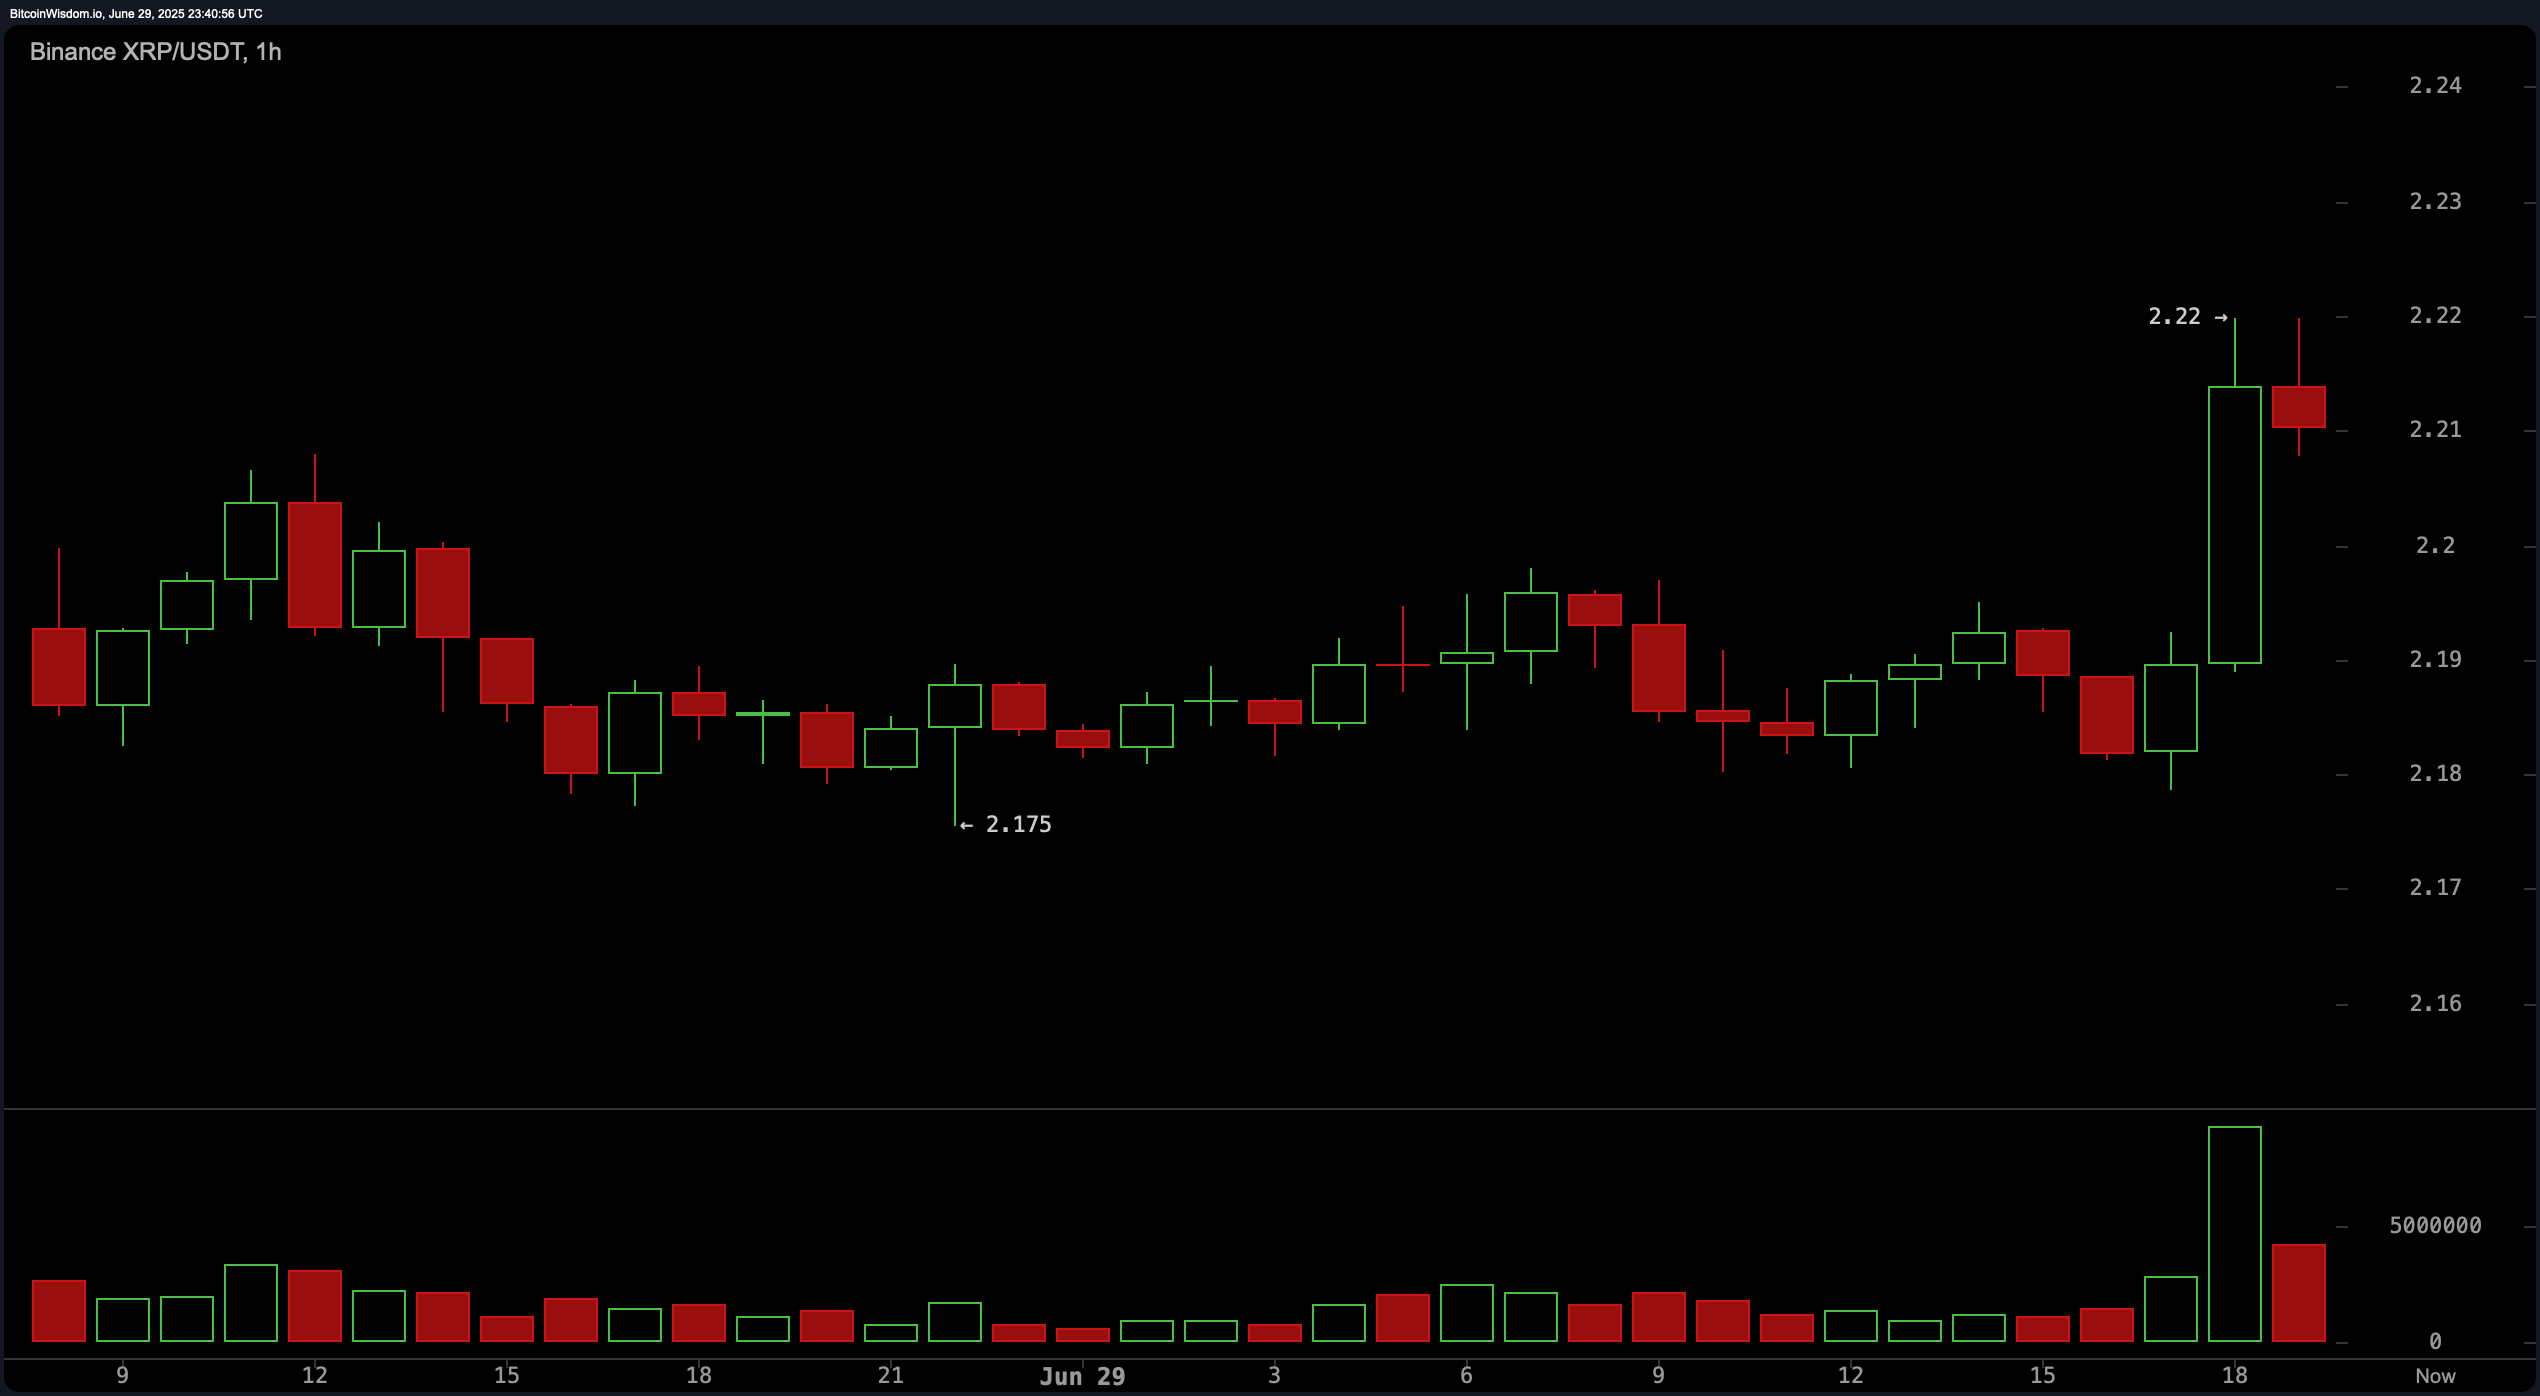
The 1-hour $XRP/ $USDT chart highlights short-term momentum that is skewing bullish. Following a spike to $2.22, the price retraced slightly, forming a potential bull flag—a common continuation pattern in trending markets. Volume surged with a large green candle prior to reaching the $2.22 high, indicating buyer strength. Strong support around $2.175 underpins the formation, suggesting that a breakout could occur if the price closes above $2.22 with renewed volume. Traders may look to enter near $2.208–$2.210 with upside targets between $2.218–$2.220, supported by tight order book clustering.
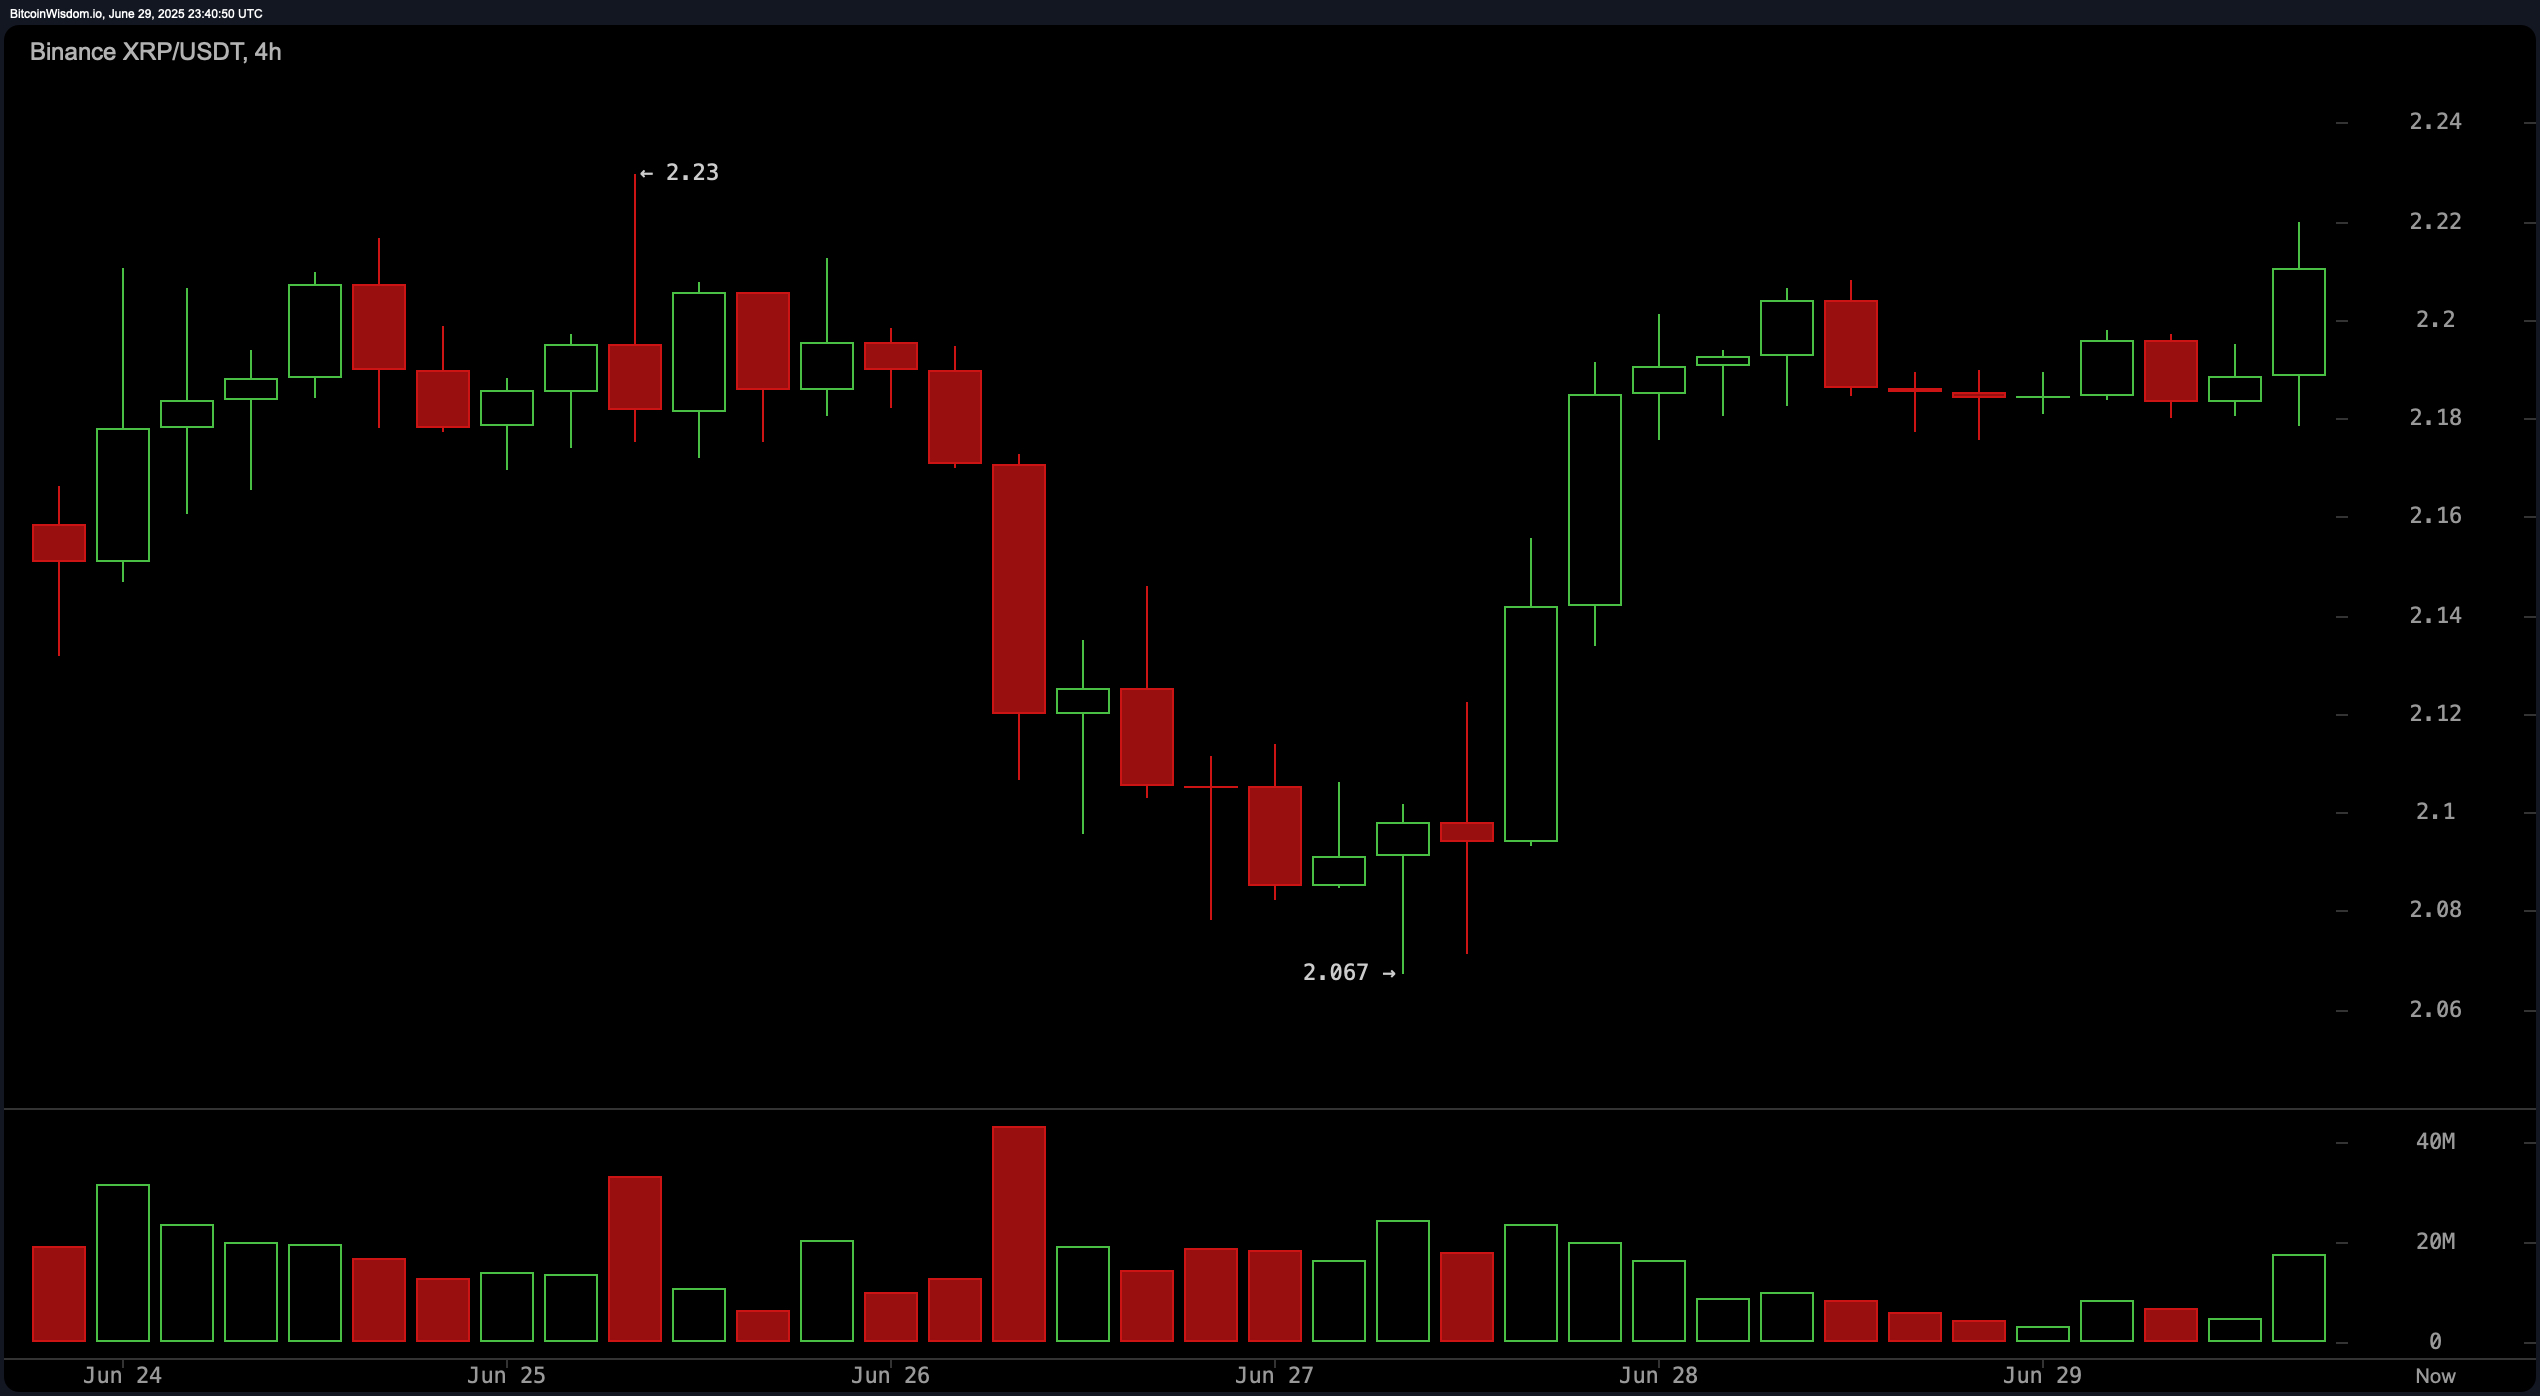
On the 4-hour chart, $XRP is demonstrating a decently strong mid-term recovery characterized by a V-shaped rebound. The asset held support at $2.067 and is now attempting to push above the $2.22 resistance. Volume analysis confirms that green candle closes are associated with increased activity, a classic bullish signal. A successful breakout above $2.22 could propel the price toward the $2.25–$2.28 zone. If upward momentum continues, the structure supports the idea of sustained gains, particularly in tandem with broad market optimism.
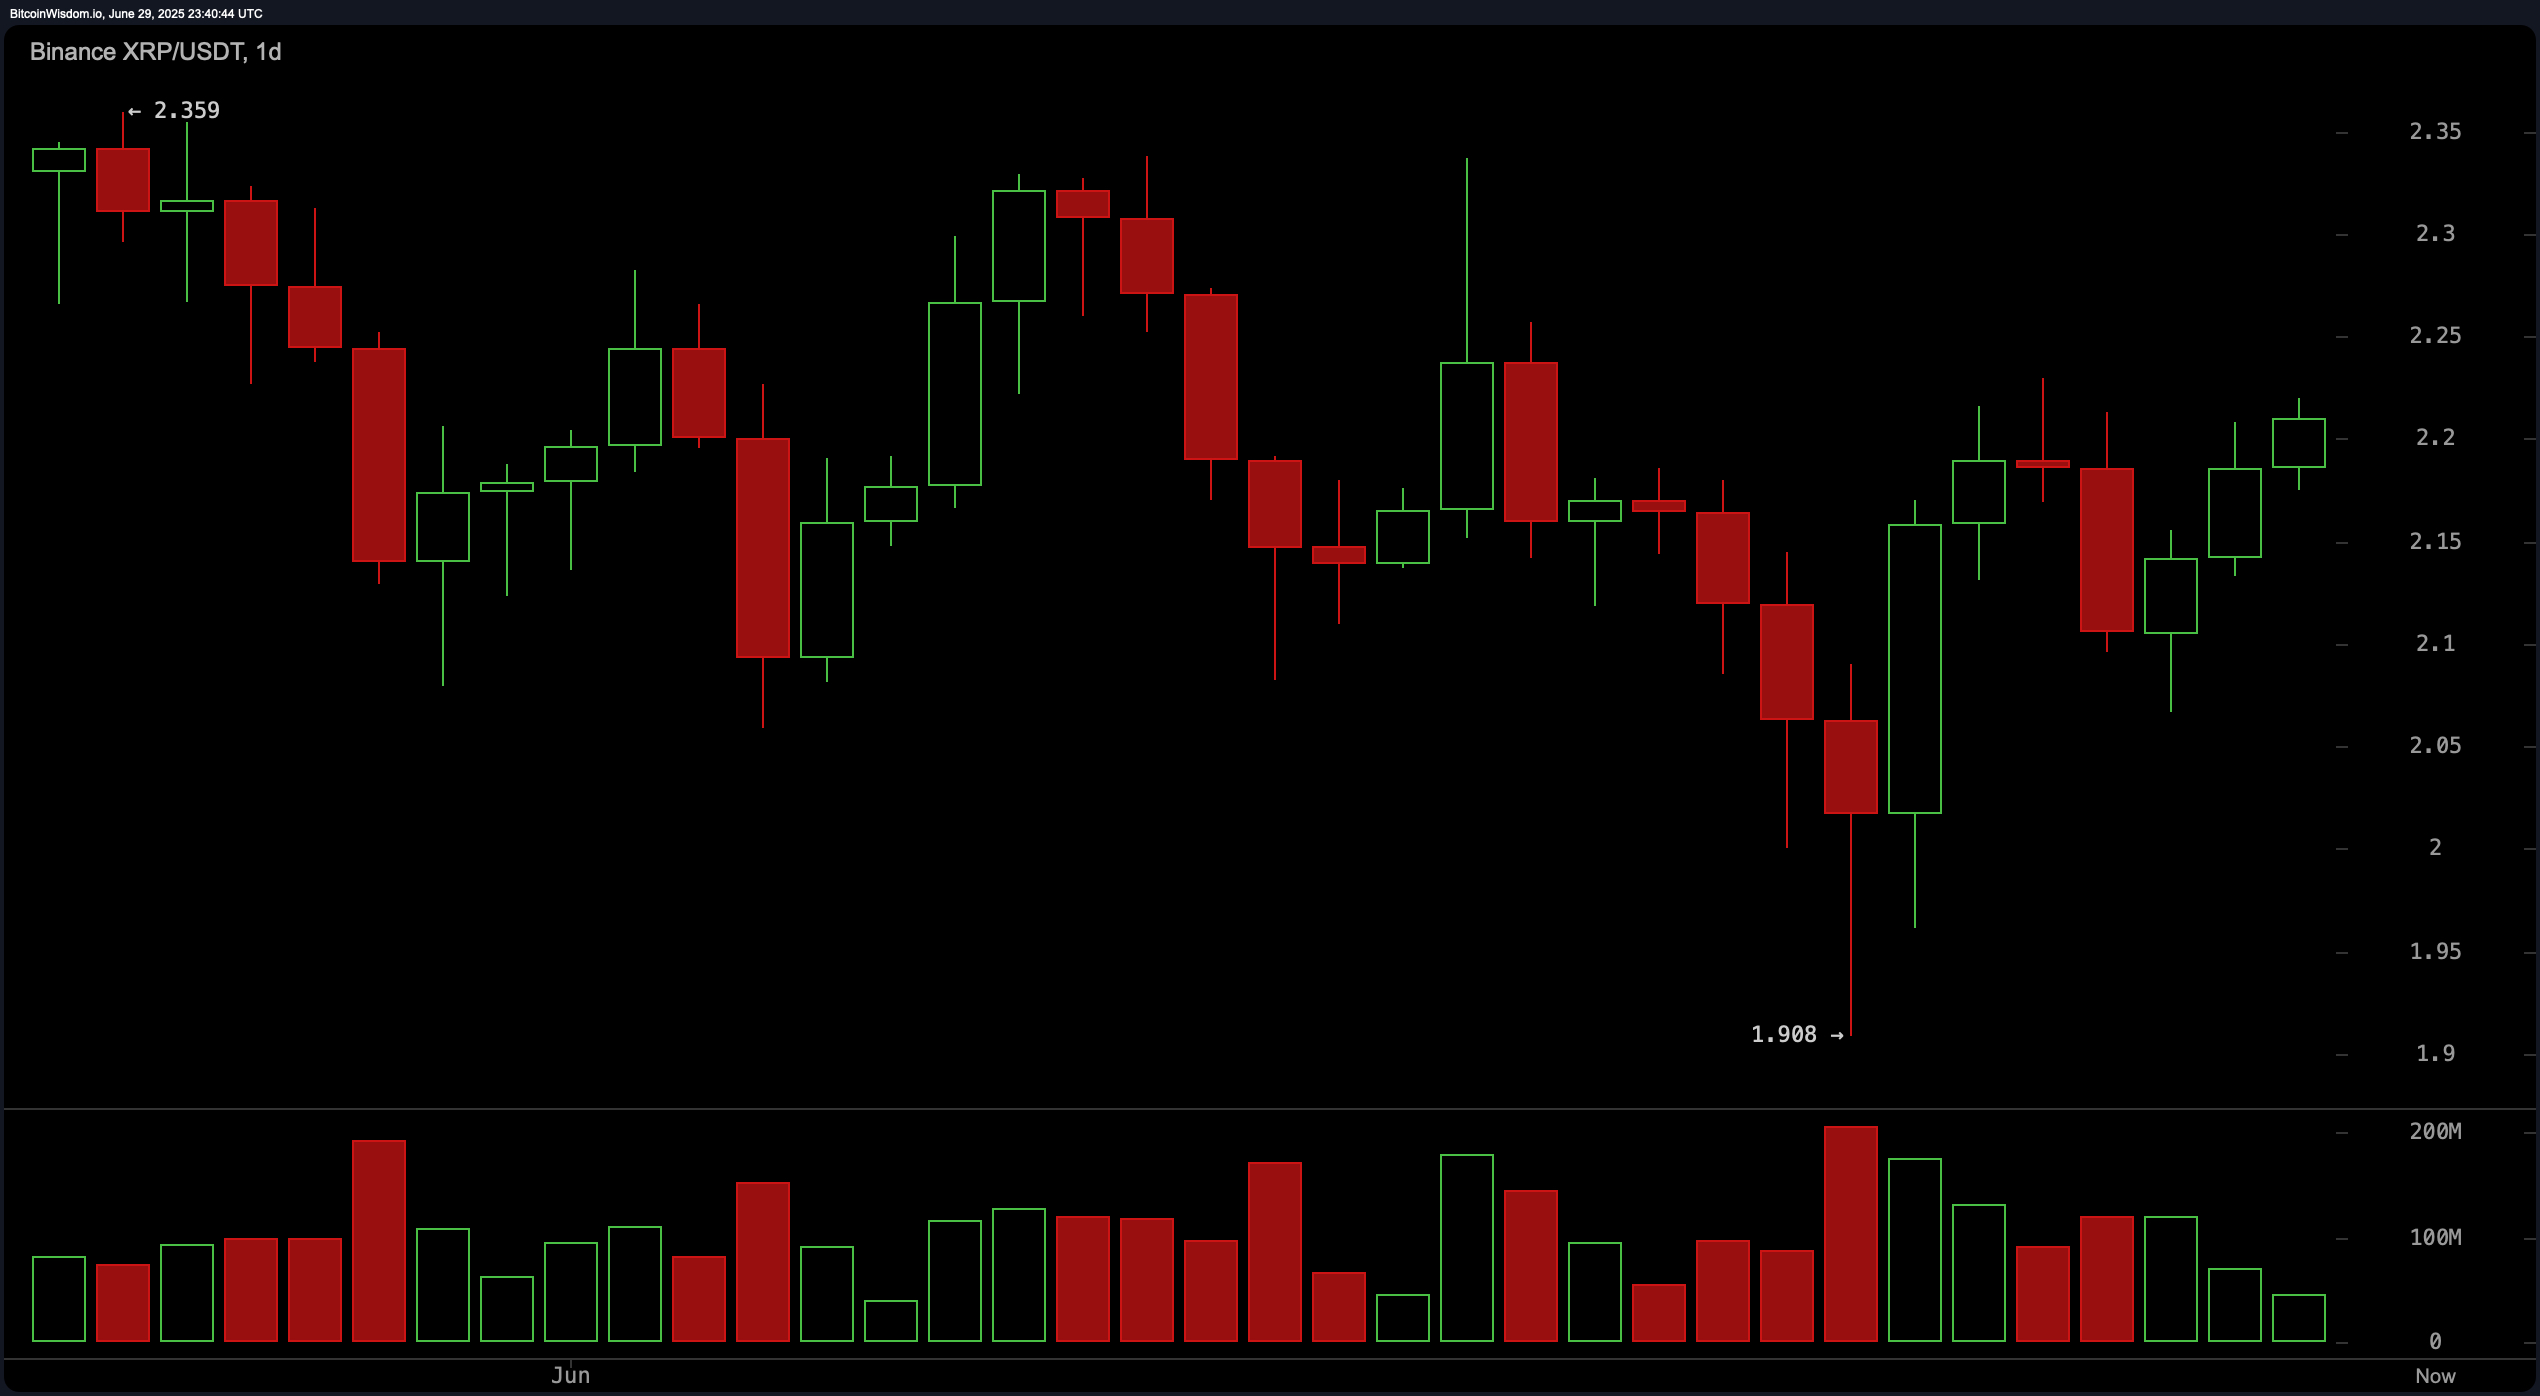
The daily chart confirms that the broader trend has shifted from bearish to sideways-to-bullish following a double-bottom near $1.908. Price is currently approaching the $2.22–$2.25 resistance zone after setting higher lows, with increasing volume on recent bullish candles. This reflects strengthening sentiment and a potential continuation of the upward trend. The bullish structure is reinforced by the Fibonacci retracement, which shows current price hovering between the 0.236 ($2.2526) and 0.382 ($2.1867) levels. A break above the 0.236 resistance could serve as a confirmation of trend reversal.
Oscillator readings remain largely neutral but lean slightly bullish. The relative strength index (RSI) is at 52.34, while the Stochastic oscillator is at 63.13, both suggesting balance between buying and selling pressures. The commodity channel index (CCI) at 49.64 and the average directional index (ADX) at 14.95 both support a non-trending market phase, yet the momentum indicator registers a modest 0.0447 bullish signal. The Awesome oscillator posts a value of −0.0164, indicating mild bearish divergence, though the moving average convergence divergence (MACD) level at −0.0180 suggests a pending bullish crossover.
Moving average (MA) signals across the board are predominantly bullish across short-term durations. The exponential moving averages (EMAs) and simple moving averages (SMAs) for 10, 20, and 30 periods are all in bullish territory. However, some longer-term averages show divergence: the 50-period SMA and both the 100-period EMA and SMA reflect sell signals, while the 200-period EMA still suggests buying interest. The 200-period SMA at $2.3677 remains above current price levels, implying potential overhead resistance. Bollinger Bands indicate increased volatility with price testing the upper band, hinting at either breakout continuation or short-term pullback, contingent on volume behavior.
Bull Verdict:
$XRP’s price action across multiple timeframes indicates strong bullish momentum, especially if it can sustain a close above $2.22 with volume. The presence of higher lows, bullish candlestick formations, and short-term buy signals across most moving averages support the case for a move toward the $2.25–$2.30 resistance zone. A clean break above the 0.236 Fibonacci retracement level could trigger accelerated gains.
Bear Verdict:
Despite near-term strength, several oscillators remain neutral, and longer-term moving averages such as the 100-period and 200-period Simple Moving Averages signal caution. $XRP is also trading near the upper Bollinger Band, historically a zone prone to short-term pullbacks. Failure to hold $2.21 support or a rejection at $2.22 could open the door for a retracement to $2.13 or even $2.08.
Final Take:
$XRP is at a critical juncture. While bullish momentum is clearly building, confirmation via a decisive breakout above $2.22 with volume is essential to sustain further gains. Traders should monitor volume closely and respect support at $2.21 and $2.17 to manage risk effectively. Cautious optimism is warranted given the constructive setup, but the broader trend still hinges on follow-through.

