


 19
19
After a sharp decline in recent weeks, the asset is stabilizing near the $USDT 0.85–0.90 region. Price action has become tighter, indicating reduced volatility and suggesting a consolidation phase. Several market indicators, including rising Open Interest and changes in momentum, support the view that accumulation could be underway.
Open Interest Signals Potential Repositioning
Recent hourly chart data highlights the price of $WLD entering a consolidation range after a significant downtrend. From around June 20th, the price declined sharply before stabilizing just above $USDT 0.85. This phase was accompanied by decreasing volatility and smaller candle bodies, suggesting a reduction in aggressive selling pressure. The market appeared to find temporary support in this region, which has held over several sessions.
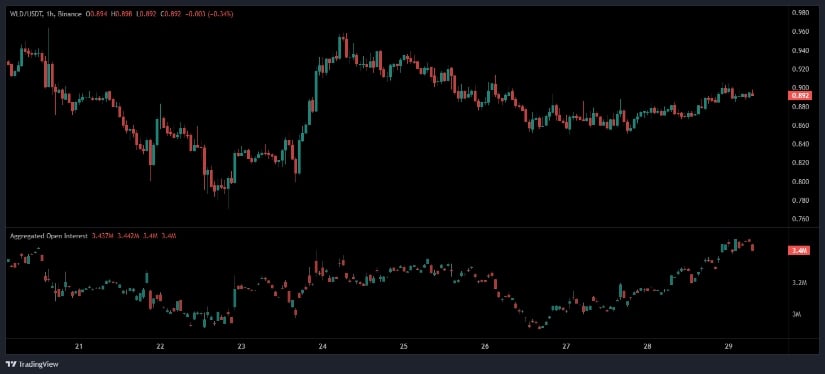
Source: Open Interest
Simultaneously, Aggregated Open Interest (OI) dropped during the sharp price decline, signaling the exit or liquidation of long positions. However, beginning on June 27, OI began to climb again, despite the price remaining stable.
This increase in OI suggests new positions are being opened, potentially by market participants preparing for a directional move. Such a pattern—rising OI with minimal price movement—can imply growing speculative interest, which may precede a breakout in either direction.
This divergence between stable price action and increasing OI creates a possible inflection zone. If the price begins to rise alongside continued OI growth, a short squeeze or breakout rally may follow. On the other hand, if the price begins to decline while OI remains elevated, it may reflect short positioning or a bearish trap. In either case, the build-up in OI at a consolidation level is often a precursor to a major market move.
Worldcoin Price Prediction Market Metrics Indicate Active Participation
As of June 29, 2025, Worldcoin is priced at $USDT 0.89, marking a 1.74% increase over the previous 24 hours. The market capitalization currently stands at approximately $USDT 1.49 billion, with a 24-hour trading volume of around $USDT 92.8 million.
These figures indicate that Worldcoin Price Prediction remains actively traded and continues to capture attention within the digital asset space. The circulating supply is estimated at 1.67 billion $WLD, placing the asset at rank 73 among global cryptocurrencies.
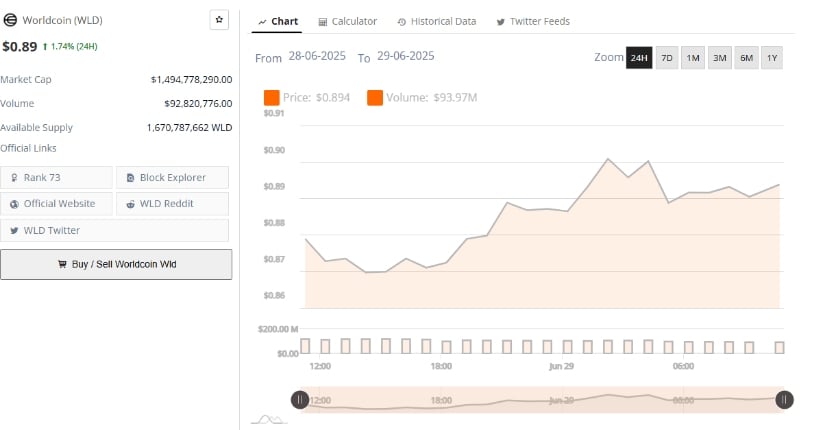
Source: Brave New Coin
Worldcoin aims to establish a global identity and financial network functioning as a public utility. Its focus is on creating infrastructure for digital identity, accessibility, and integration with emerging AI technologies.
These objectives set it apart from many other tokens that are primarily designed for transactional or store-of-value purposes. As digital identity and AI infrastructure continue to gain relevance globally, projects like Worldcoin may find increased institutional and public interest.
Despite recent price corrections, Worldcoin’s broader utility-driven roadmap provides a structural foundation that has supported market engagement. The slight rebound in price and continued market activity suggest that confidence remains, even amid short-term technical weakness. Sustained engagement and participation will be critical for $WLD to regain higher valuation zones and potentially revisit past resistance levels in the coming quarters.
Technical Indicators Point Toward Base Formation
The daily chart for $WLD/$USDT shows a prolonged downtrend from a high of $USDT 2.803. The price has now stabilized around the $USDT 0.89 range, failing to break below the recent support near $USDT 0.85.
While the series of lower highs and lower lows continues to define the longer-term trend, recent price movement has narrowed, indicating a pause in downward momentum. Previous rallies in April and May did not lead to lasting reversals, as resistance levels above $USDT 1.10 consistently rejected upward attempts.
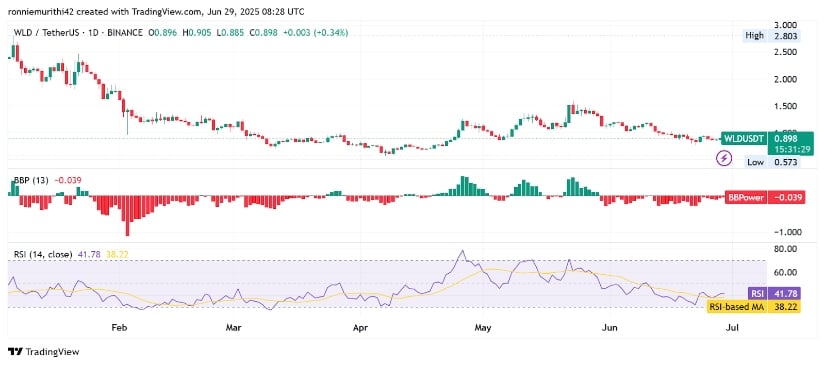
Source: TradingView
The Bulls vs Bears Power (BBPower) indicator currently stands at -0.038, confirming that bearish momentum is still present, though not accelerating. The lack of prolonged green bars in the histogram reflects limited buying strength, with rallies being short-lived. However, the reduced depth of red bars suggests that seller momentum is gradually weakening. A shift into sustained green territory would be required to support a change in trend.
The Relative Strength Index (RSI) reads 41.35, still under the neutral level of 50, but above its moving average of 38.19. This crossover is often viewed as a potential early signal of bullish momentum. Although not yet a definitive reversal, it does indicate that selling pressure may be diminishing.
For a confirmed trend shift, traders are watching for RSI to breach and hold above the 50 mark, along with a price move above $USDT 1.00. Until these milestones are achieved, the current consolidation may continue as the market gauges its next directional phase.
