


 16
16
The Aptos price today is hovering near $5.19 after a sharp recovery from sub-$4.00 lows earlier this week. The breakout above multiple descending trendlines and reclaim of the $5.00 level signals renewed bullish momentum. However, $APT is now testing a previously rejected liquidity zone, raising questions about the sustainability of this rally.
What’s Happening With Aptos’s Price?
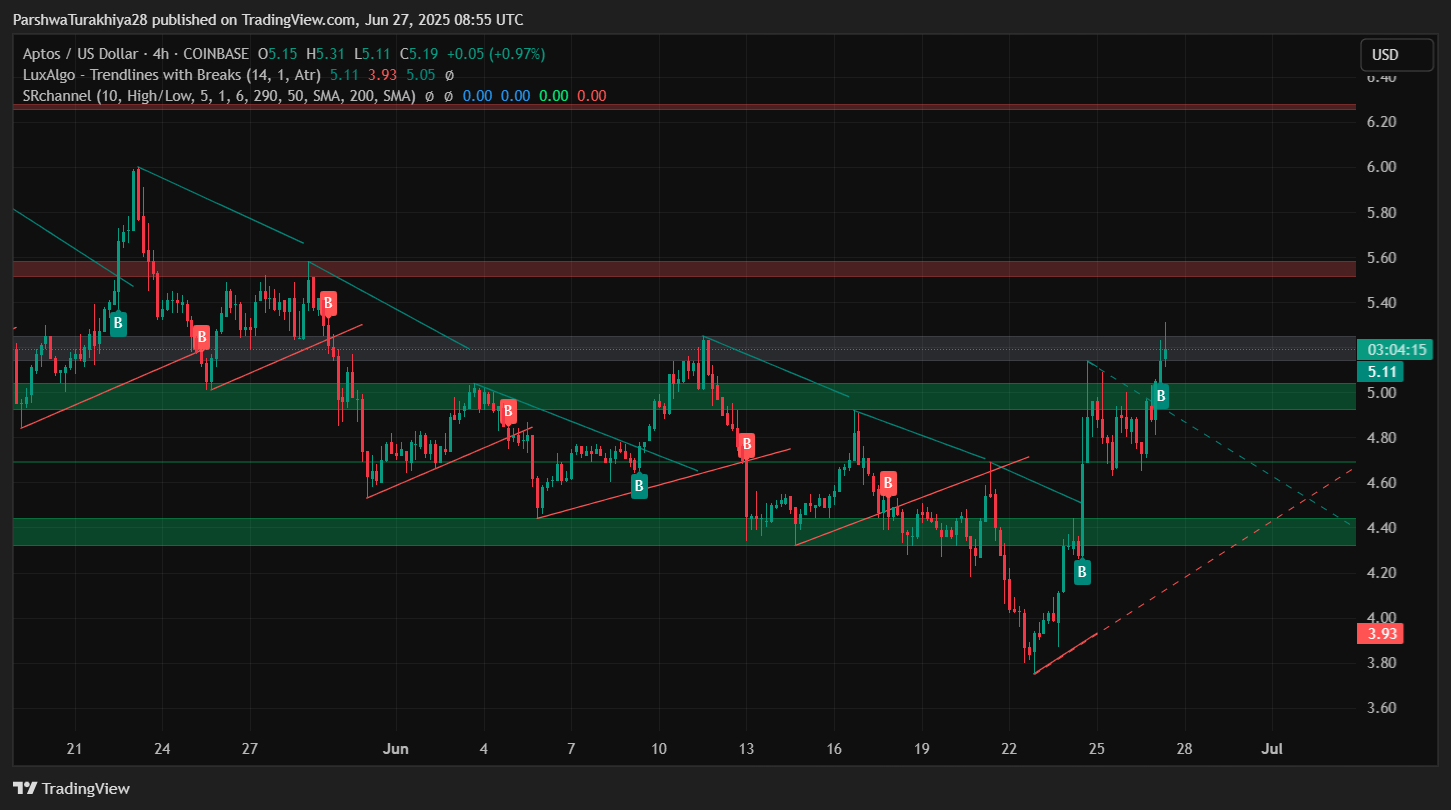
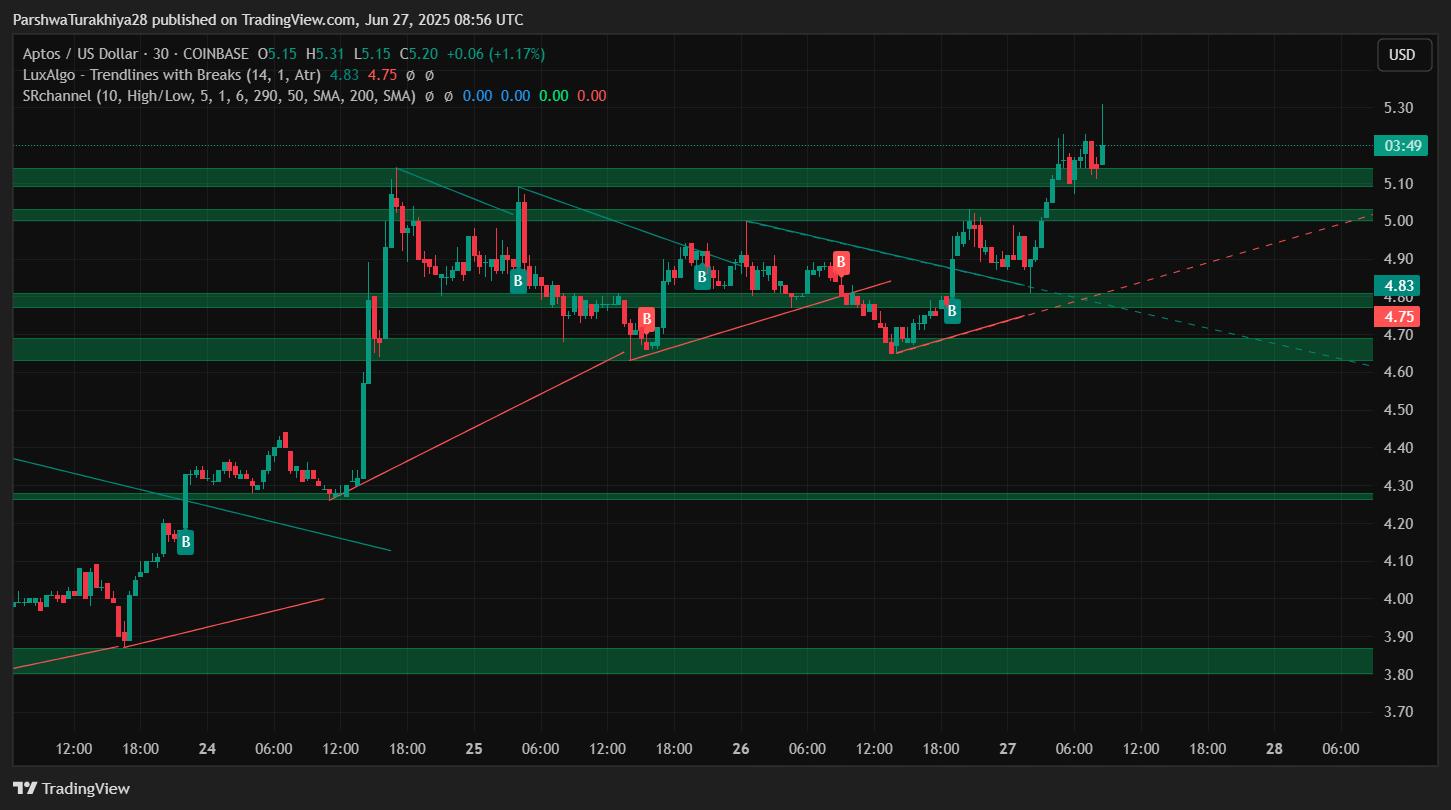
On the 4-hour chart, $APT has completed a bullish break of structure (BOS) after invalidating a major swing high from June 21. Price surged from the $3.95 region and cleared the $4.75–$5.00 resistance band, supported by a strong impulse candle that printed above $5.10. This upward move also broke the descending channel that had capped price action since early June.
The price is now consolidating inside a minor supply zone just below $5.35, which previously led to a selloff earlier in the month. A successful hold above $5.00 could flip this zone into demand, allowing the next leg higher to test $5.55–$5.66.
Why Is the Aptos Price Going Up Today?
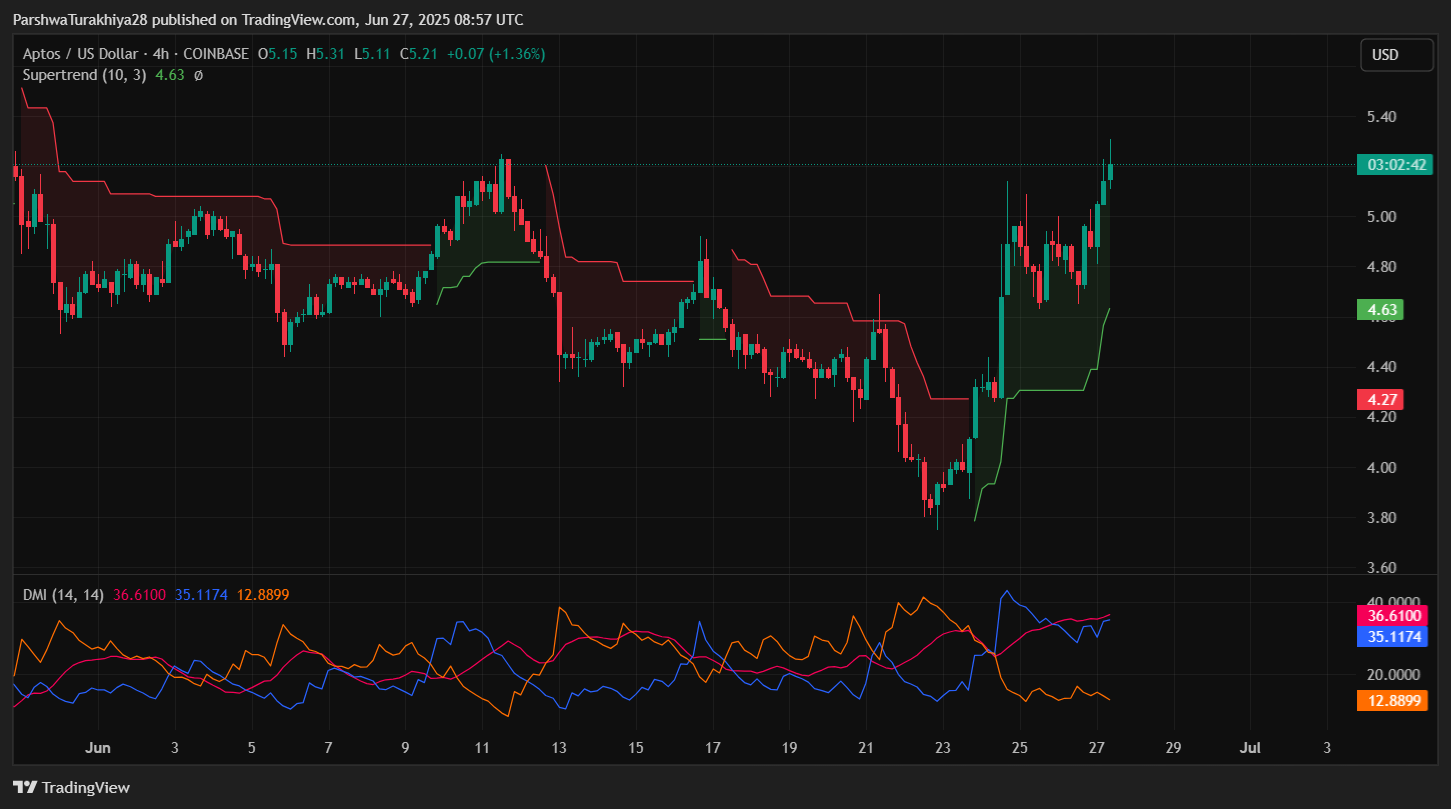
The reason why Aptos price going up today lies in a confluence of strong technical signals and momentum shifts. The Supertrend on the 4-hour chart flipped bullish after $APT closed above $4.63, reinforcing the breakout. At the same time, the Directional Movement Index (DMI) shows the +DI line leading and ADX rising — confirming trend strength.
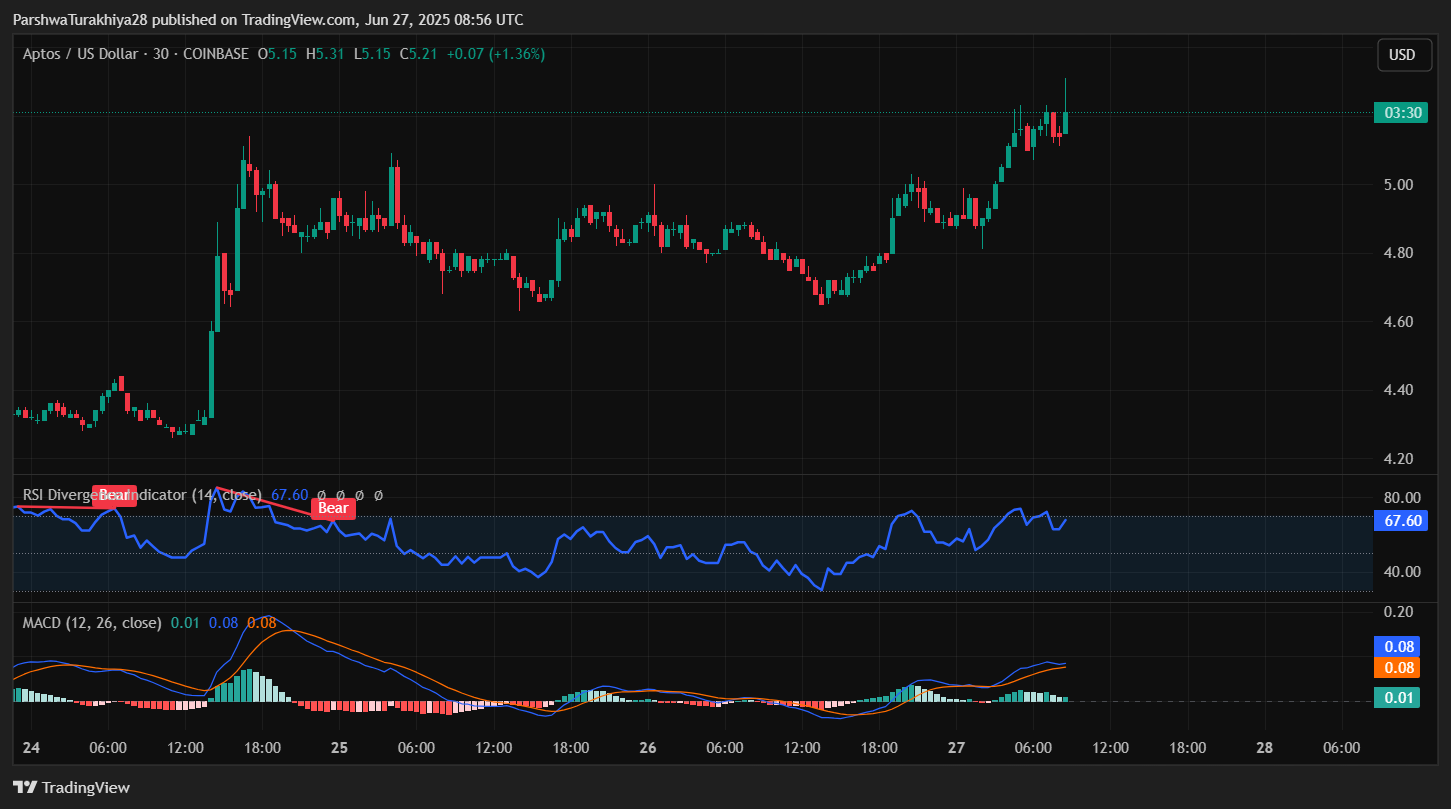
The RSI on the 30-minute chart is at 67.6, just below the overbought threshold, indicating strong momentum without immediate exhaustion. Meanwhile, the MACD is in positive territory with a widening histogram, suggesting bullish continuation in the near term.
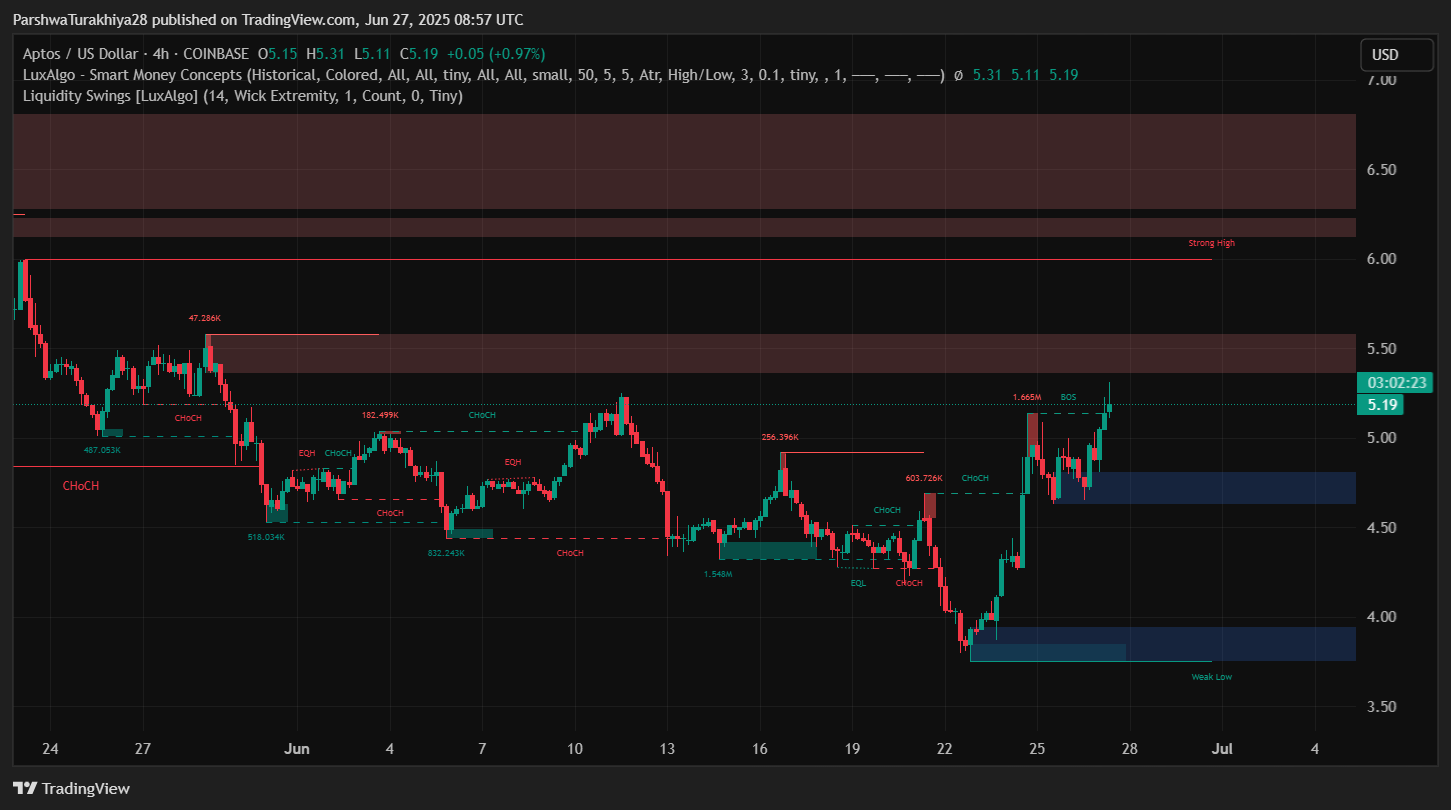
Smart Money Concept data highlights a BOS with a major liquidity sweep, showing that $APT has cleared prior equal highs and tapped into fresh buy-side liquidity. This price action also coincides with a break above VWAP resistance, and current candles are holding above the session VWAP band — indicating buyers remain in control.
Aptos Price Indicators Flash Breakout Potential
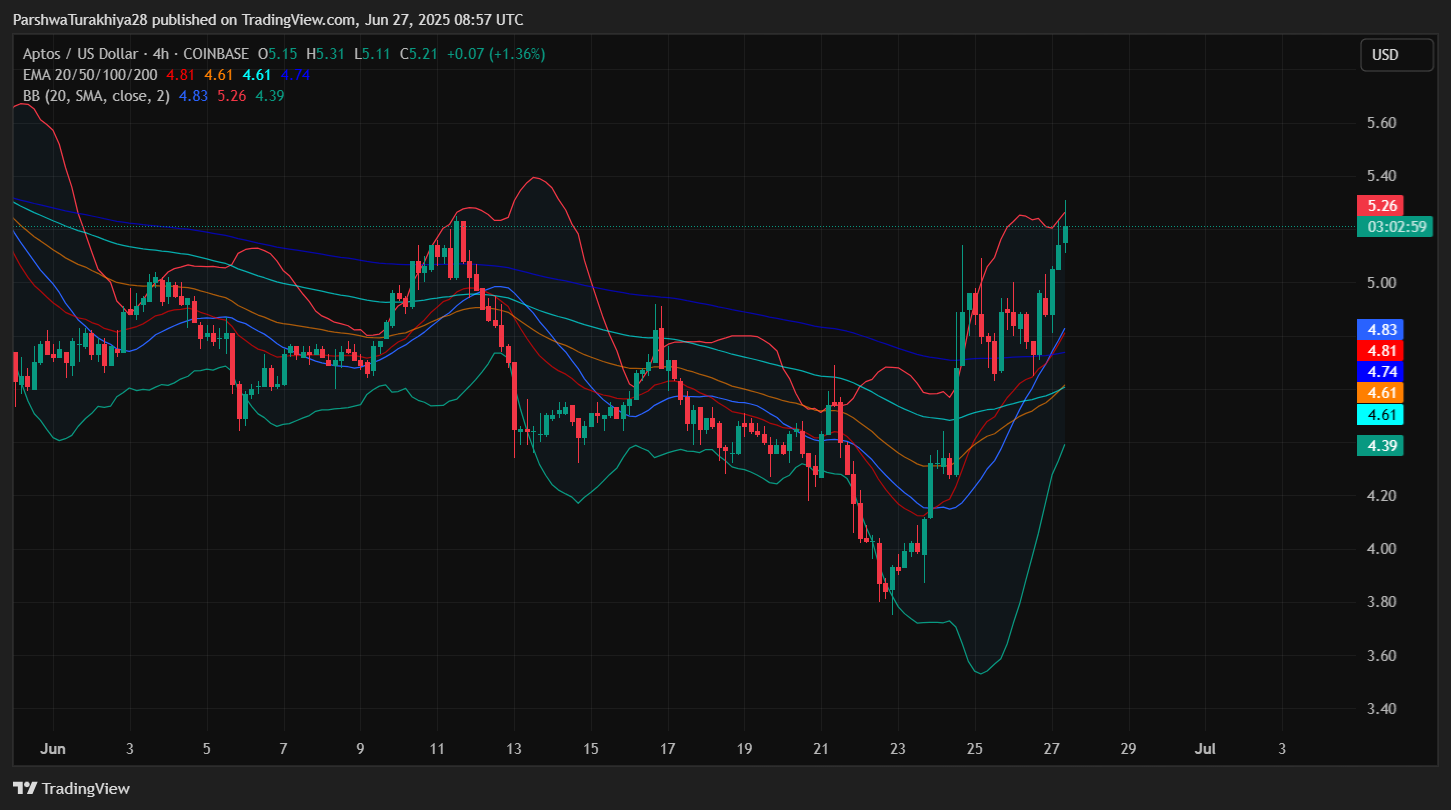
The 4-hour EMA cluster has turned supportive, with price now trading above the 20/50/100/200 EMAs, which converge near the $4.60–$4.80 range. These levels should now act as a key support band. The Bollinger Bands are expanding, and $APT candles are pressing the upper band at $5.26 — a classic breakout behavior.
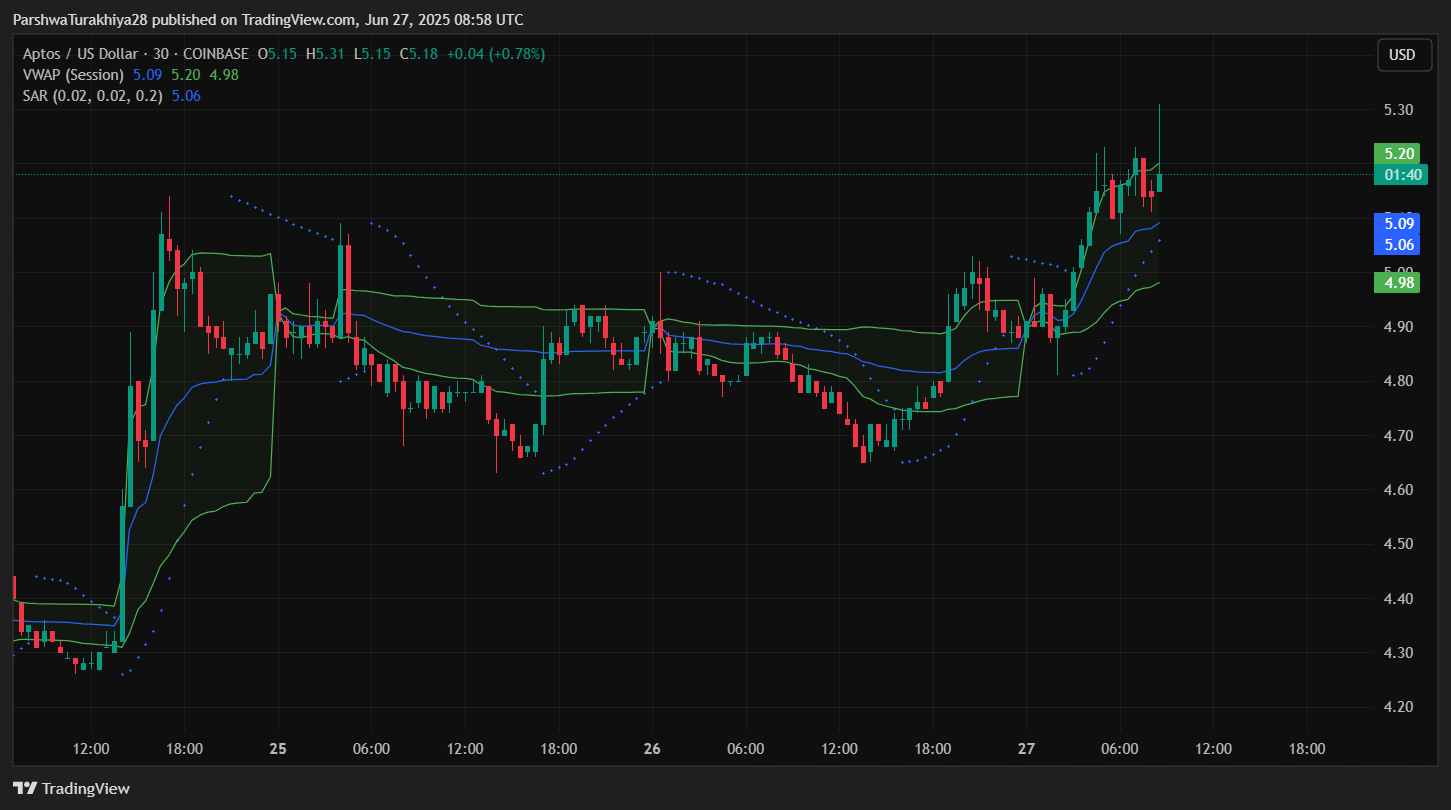
The Parabolic SAR dots have shifted beneath price action, and price is currently consolidating in a narrow band between $5.10–$5.20. If this structure holds, a continuation toward the $5.50–$5.65 zone becomes probable.
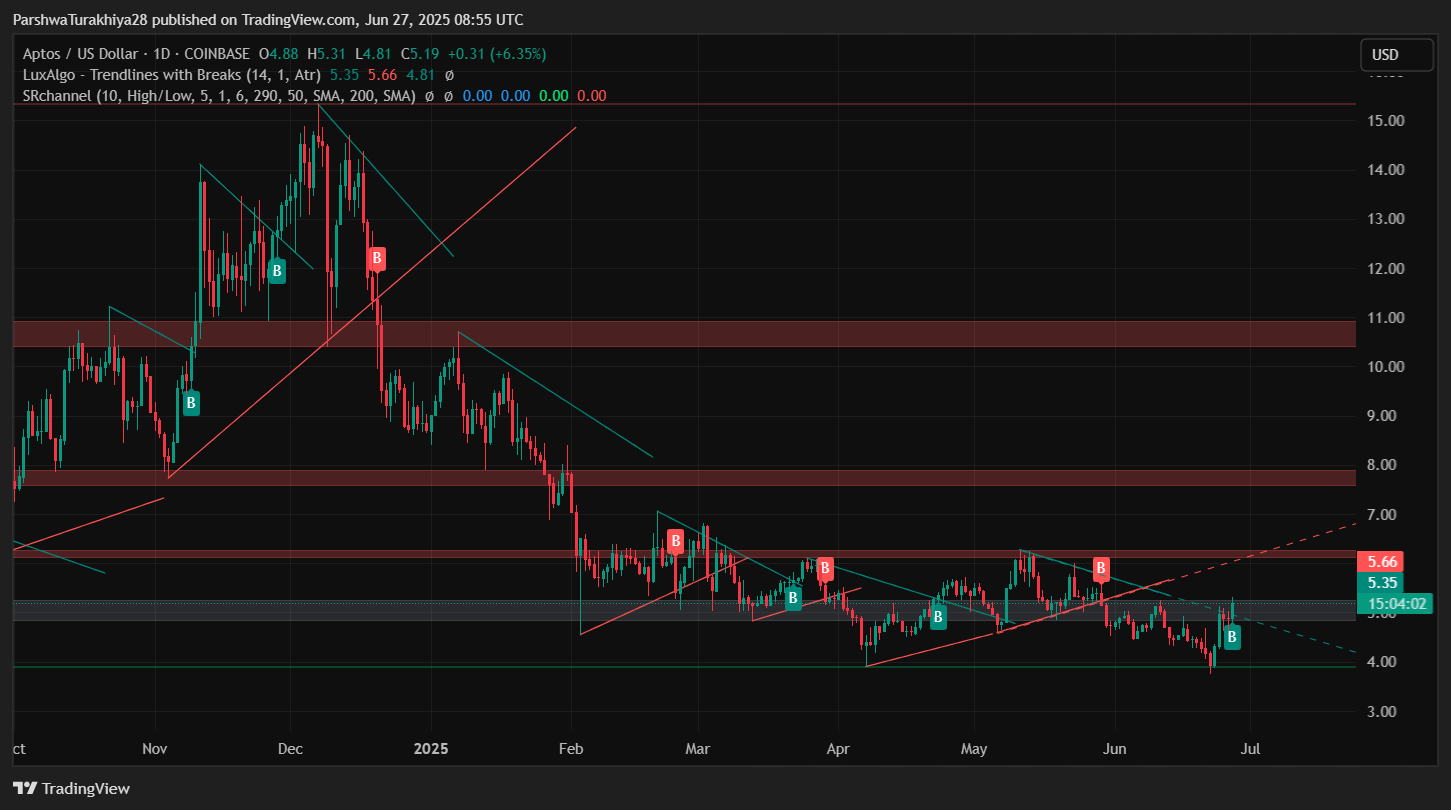
From a daily perspective, $APT is attempting to escape a prolonged downtrend. The breakout from the lower high sequence and daily bullish engulfing candles reflect a possible macro reversal in play. The next major resistance zone lies near $5.66, while weekly resistance is parked higher at $6.50.
$APT Price Prediction: Short-Term Outlook (24h)
Short term, Aptos may face resistance at $5.35–$5.55, which aligns with a historical rejection block. A clean breakout above $5.55 with volume could open the door toward $6.00, while failure to hold above $5.00 might result in a dip back to $4.83 and potentially $4.61 — key EMA support levels on the 4H chart.
If momentum sustains and indicators like MACD and RSI remain bullish, price could grind toward $5.66. However, traders should monitor for potential RSI divergence or rejection wicks near key resistance.
Aptos Price Forecast Table: June 28, 2025
| Indicator/Zone | Level (USD) | Signal |
| Resistance 1 | $5.35 | Short-term ceiling |
| Resistance 2 | $5.55 | Next breakout target |
| Support 1 | $5.00 | Key breakout retest zone |
| Support 2 | $4.83 | EMA 20/50 confluence |
| Supertrend (4H) | $4.63 | Bullish confirmation |
| RSI (30-min) | 67.60 | Momentum strong, near overbought |
| MACD Histogram | Positive | Bullish continuation |
| Bollinger Bands Width | Expanding | Breakout phase |
| VWAP (30-min) | $5.09 | Intraday support |
| Smart Money BOS | $5.19 | Structural bullish shift |
Disclaimer: The information presented in this article is for informational and educational purposes only. The article does not constitute financial advice or advice of any kind. Coin Edition is not responsible for any losses incurred as a result of the utilization of content, products, or services mentioned. Readers are advised to exercise caution before taking any action related to the company.
