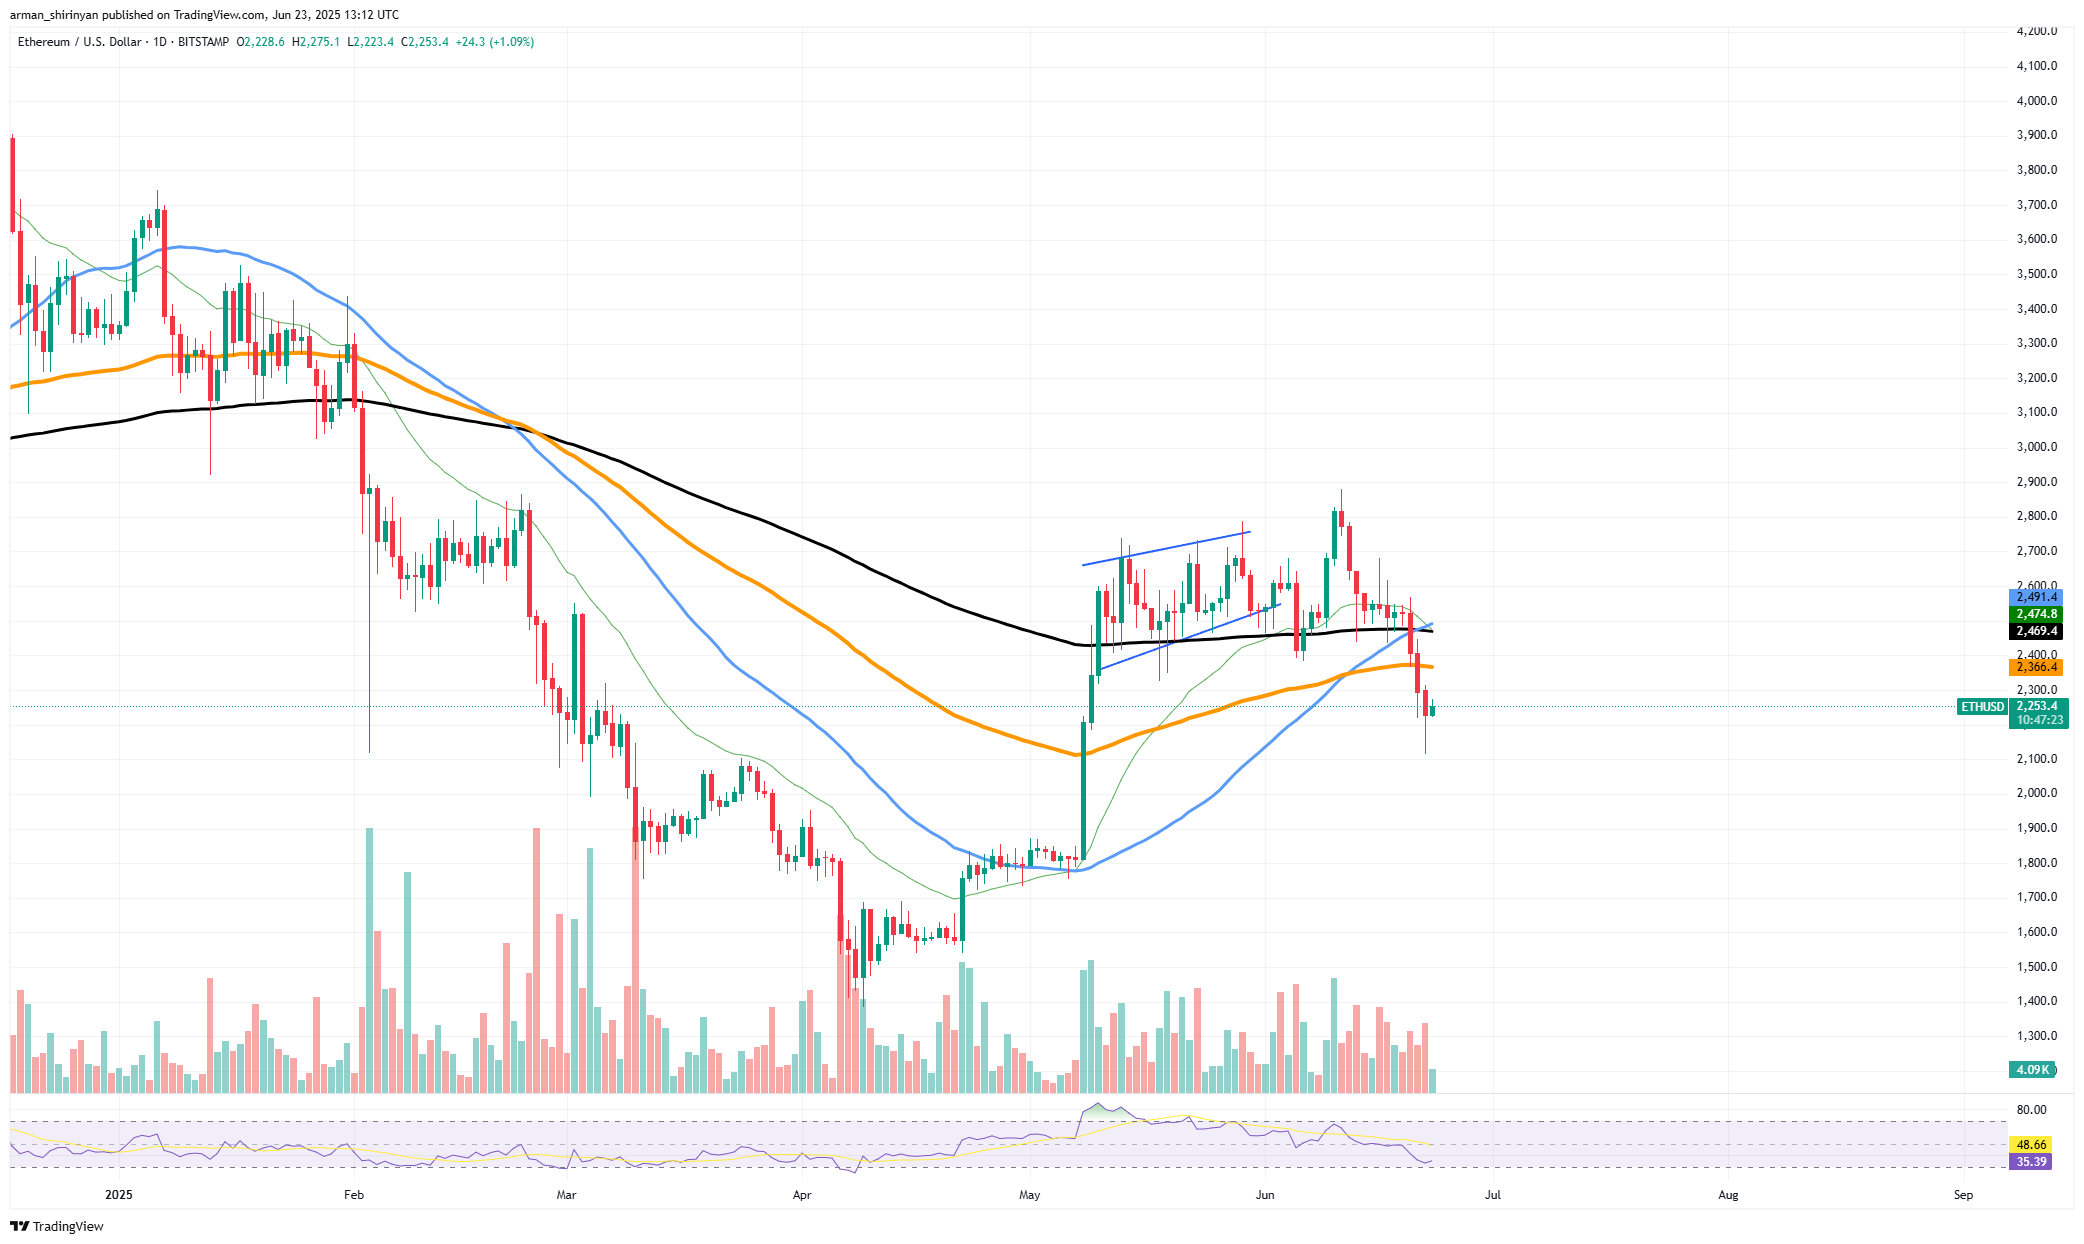
Recently Ethereum displayed the golden cross, which is typically regarded as one of the most bullish technical indicators in trading. A long-term uptrend usually begins when the 50-day moving average crosses above the 200-day moving average. The market, however, was indifferent.
After the golden cross formed, ETH fell sharply instead of rising, losing support levels and plunging below all significant moving averages. With the 200-day EMA providing the only weak support around the $2,200 zone, the asset has fallen below both the 50- and 100-day EMAs and is currently trading at about $2,245.
What a golden cross is intended to mean is completely contradicted by this breakdown. Over the past few years, the golden cross has actually become less and less relevant. Historically these signals have not appeared at the start of a significant bullish trend but rather close to the tail end of a recovery rally or just prior to a reverse.
When it came to Ethereum, the most recent cross was a lagging artifact of the uptrend that started in APril rather than a prediction of future strength. Furthermore, macroeconomic circumstances on the cryptocurrency market do not correspond with the optimism that this signal typically arouses.
The future of ETH is now much more uncertain due to weak volume buyers, lack of follow-through and rejection at $2,600, a previous resistance zone. Today the golden cross is at best less of a call to action and more of a lagging indicator of market structure. It informs traders that while ETH has been rising lately, there is not a new uptrend in sight.
The signal will be dismissed as just another fakeout in a technical environment that is becoming more and more unpredictable unless a strong bounce quickly reclaims important resistance levels.
Bitcoin plunges
Although the market's quick response to Bitcoin's recent decline below the psychological $100,000 mark caused some investors to panic, the market's reaction shows that the bulls are not sleeping. In fact the force and speed of the recovery back above $100,000 indicate that buyers still have a lot of power, which could alter the course of events in the weeks ahead.
Bitcoin hit the 100-day EMA (orange line) on the chart, sliced through it for a short while, then bounced back hard to close above the EMA and the important round-number support level. This kind of V-shaped recovery is frequently observed when large-scale buyers swiftly absorb short-term panic selling, suggesting that accumulation is occurring beneath the surface.
Bitcoin has been forming a descending triangle pattern, which is frequently interpreted as a bearish formation and adds even more significance to this bounce. That outlook is called into question, though, by the failure to break down decisively and the quick rebound. Actually, fakeouts, when bearish expectations are turned into breakout rallies, often precede such price action.
To support the bullish argument, momentum indicators such as the RSI are also displaying signs of recovery after approaching oversold territory. It appears that this was not merely a dead cat reaction but rather a defended level as volume data supports the strong buyer presence during the bounce.
The recovery from below-$100,000 levels is a bullish signal that should not be disregarded even though BTC still faces resistance at the descending trendline (~$106,000). It indicates that bulls are ready to intervene forcefully at psychological support and if the trend holds, a push back toward $105,000-$110,000 may be possible sooner than most people think. The next step could be swift, so pay attention to the follow-through.
XRP holds it
When XRP's price nearly dropped below the technically and psychologically important $2.00 support, it was on the brink of a critical breakdown. Just days ago, the token broke below all of the major moving averages and breached the symmetrical triangle pattern to the downside, which is a classic indication of bearish momentum; particularly since the 200-day EMA at $2.17 no longer served as a backstop, sentiment swiftly soured.
Still, the panic did not come to pass. With a last-minute bounce, XRP managed to regain its position above the $2 mark, closing at $1.90 and briefly falling. This level of resilience indicates that buyers who believe that XRP is undervalued at less than $2 have a clear demand for it. The slight increase in volume suggests that this was not merely a dead-cat bounce but rather the beginning of a stabilization phase.
Given that XRP was significantly oversold prior to the bounce the current RSI reading of 34 lends some support to the notion of a technical rebound. Holding the $2.00 threshold, which has served as a battleground and a magnet, may allow for a brief recovery toward the $2.17-$2. 23 range, which is where the 50-day and 100-day EMAs are located.
However, there is still hope for XRP. It has not yet invalidated the bearish breakdown from the triangle pattern and is still well below its 200-day EMA. For the asset to even start shifting the market structure back to neutral or even bullish, it must close several sessions above $2.20.