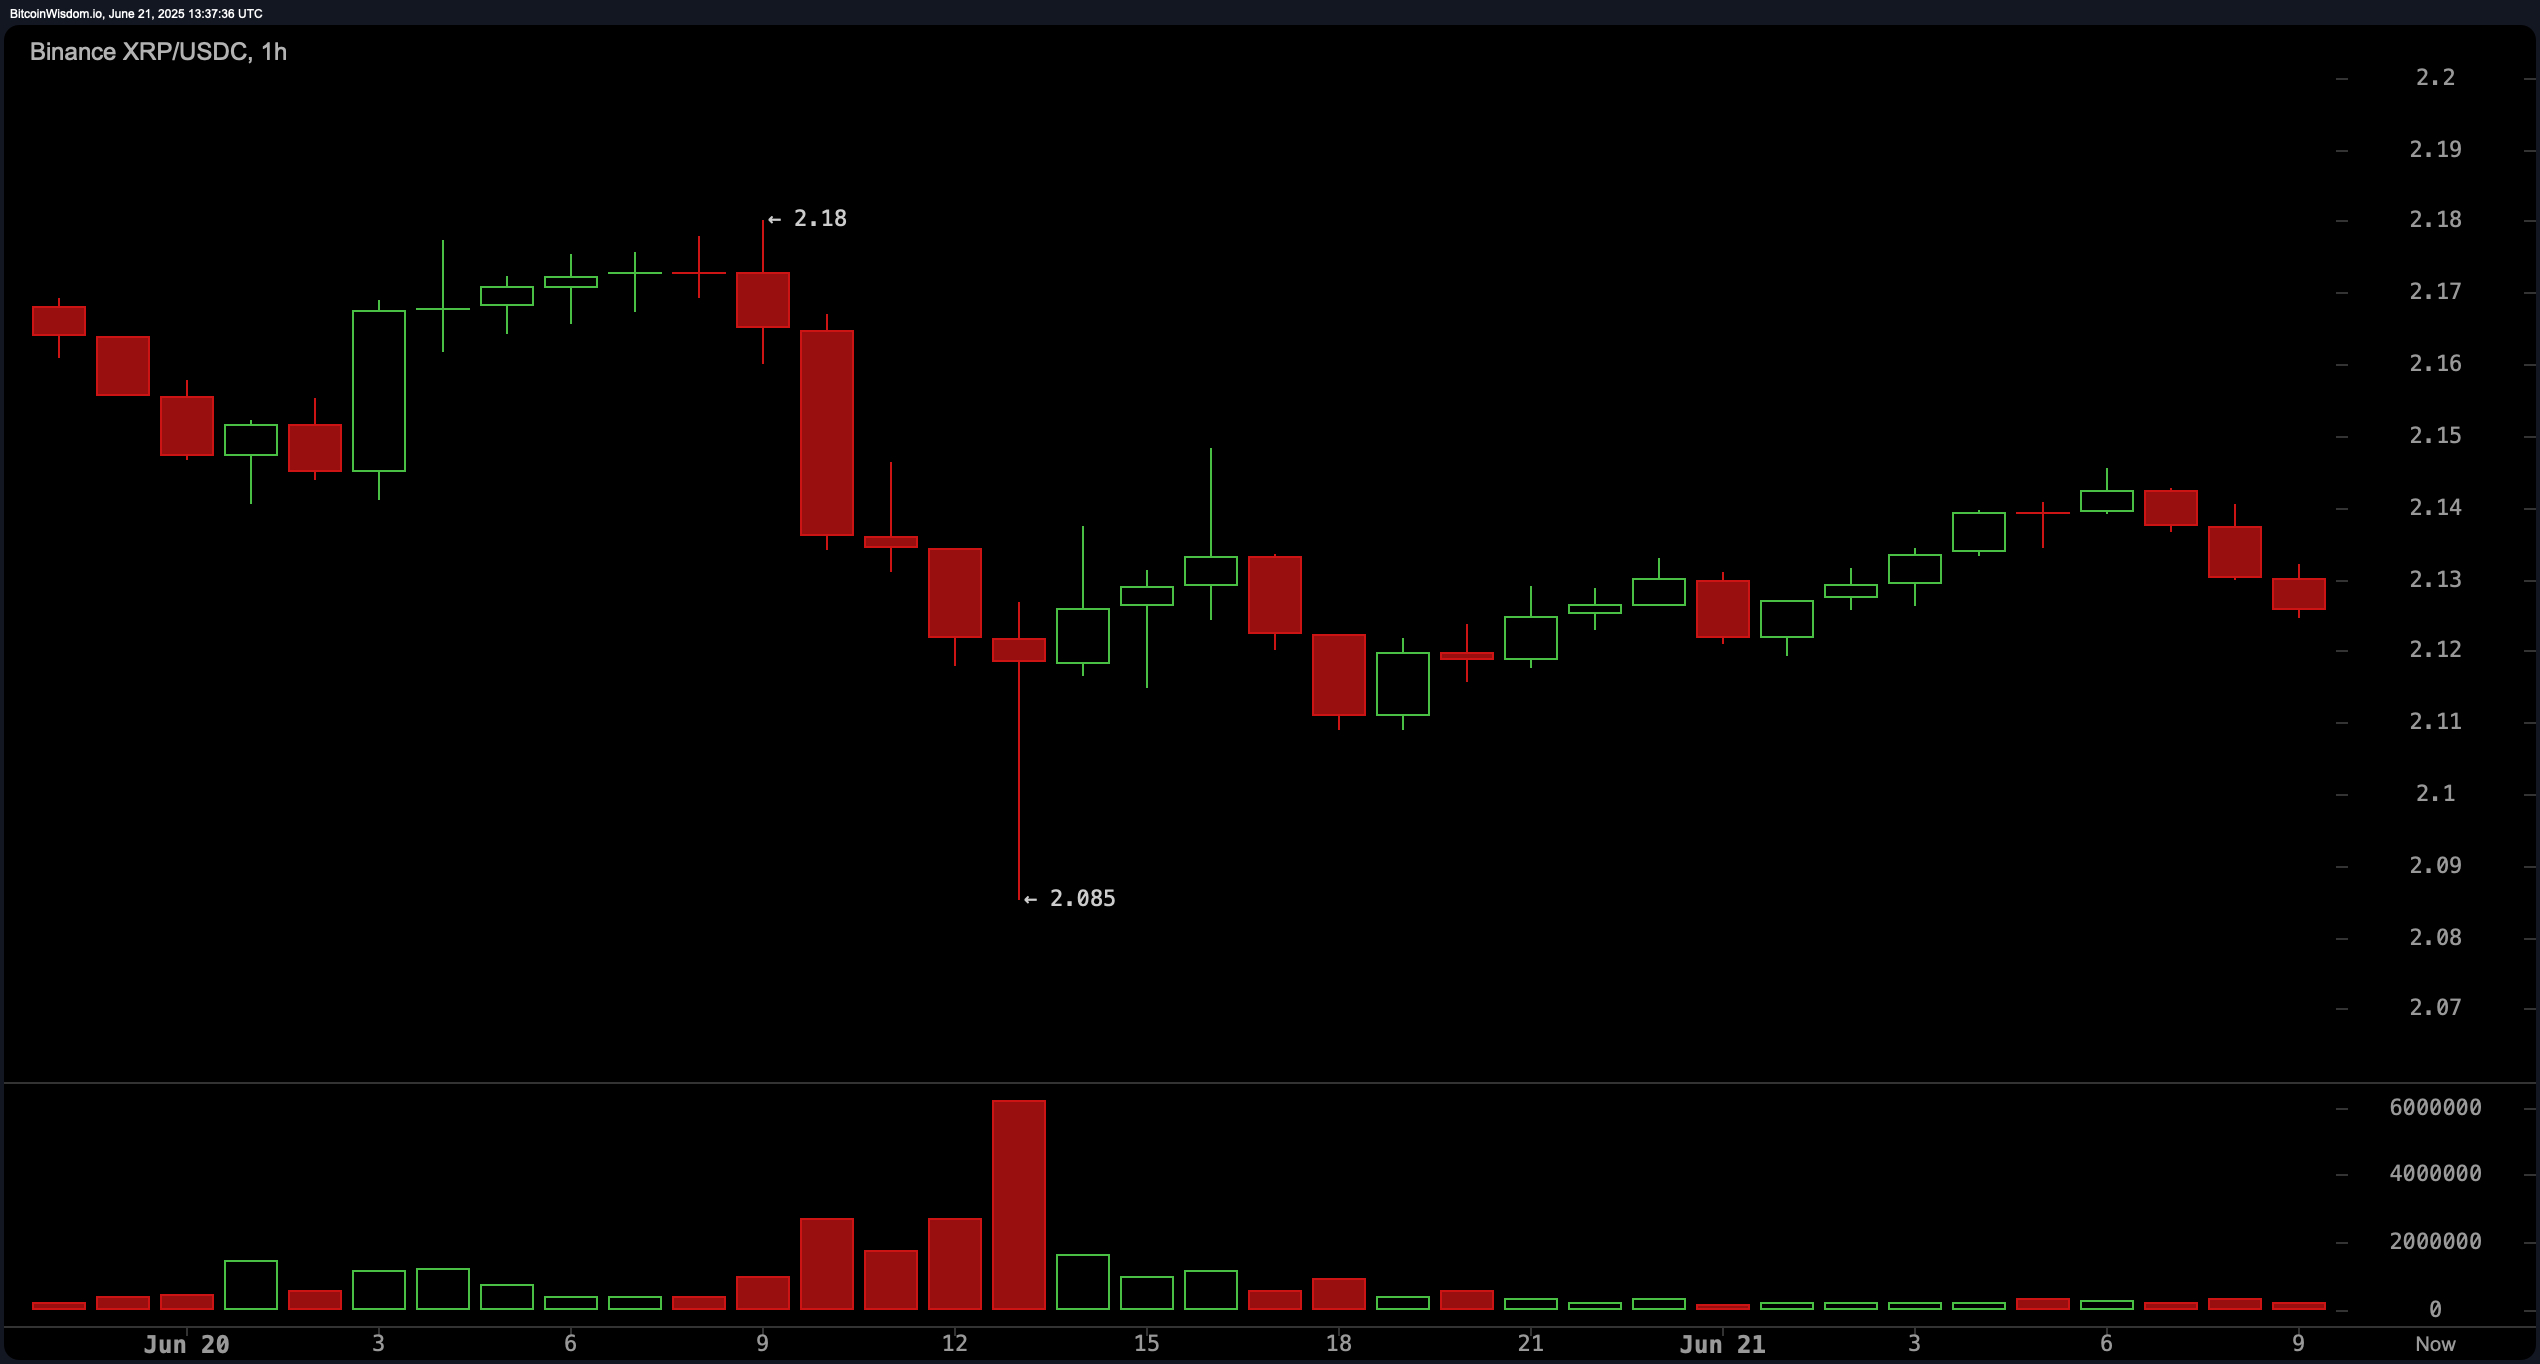
XRP traded at $2.13 on June 21, 2025, supported by a market capitalization of $125.52 billion and a 24-hour trading volume of $1.83 billion. Price action ranged intraday between $2.09 and $2.17, reflecting tight consolidation amid broader market uncertainty.
XRP
XRP’s 1-hour chart indicates a muted recovery attempt following a sharp intraday drop to $2.085, a level that established temporary support. Despite the minor bounce, the price failed to break decisively above the $2.14–$2.15 resistance zone, suggesting hesitant buying interest. Momentum remains fragile, with no strong continuation patterns forming, and the low-volume rally implies a lack of conviction from bullish participants.

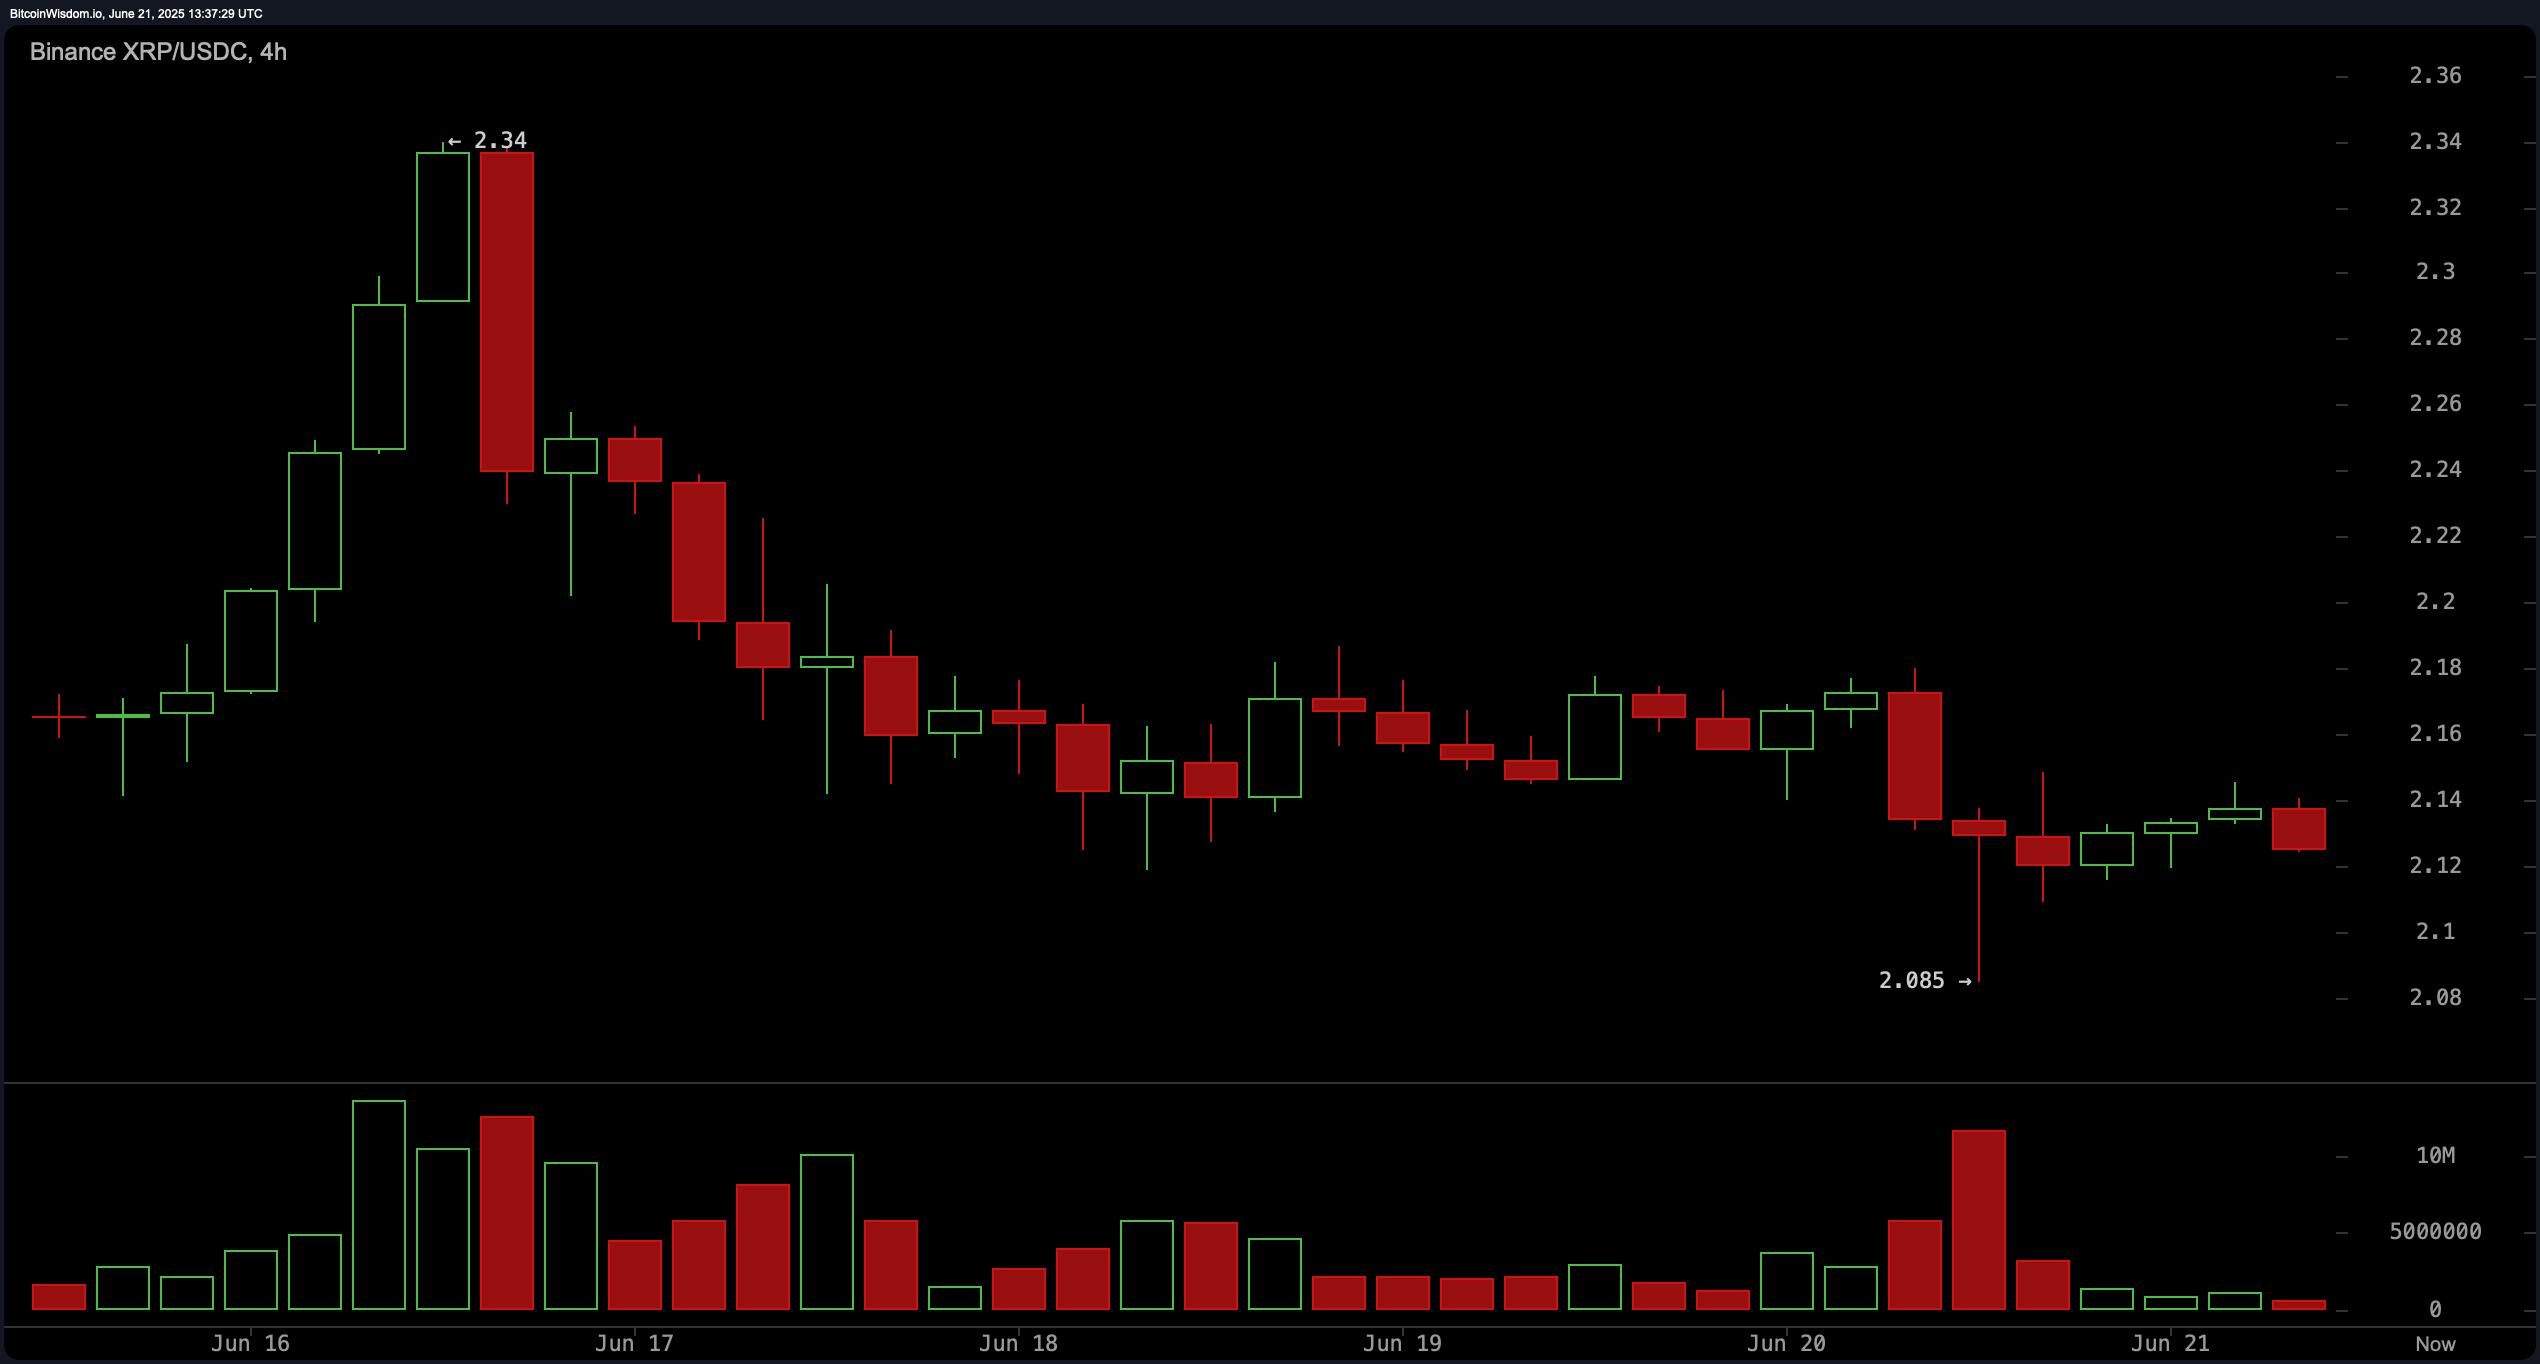
The 4-hour chart reinforces the short-term downtrend, which began at $2.34 and has since resulted in a sequence of lower highs. Over the past three days, XRP has been trapped in a sideways structure, with notable indecision between bulls and bears. A volume spike during the June 19 dip to $2.085 suggests panic selling, yet no definitive reversal structure has emerged, keeping the short-term outlook neutral to bearish.

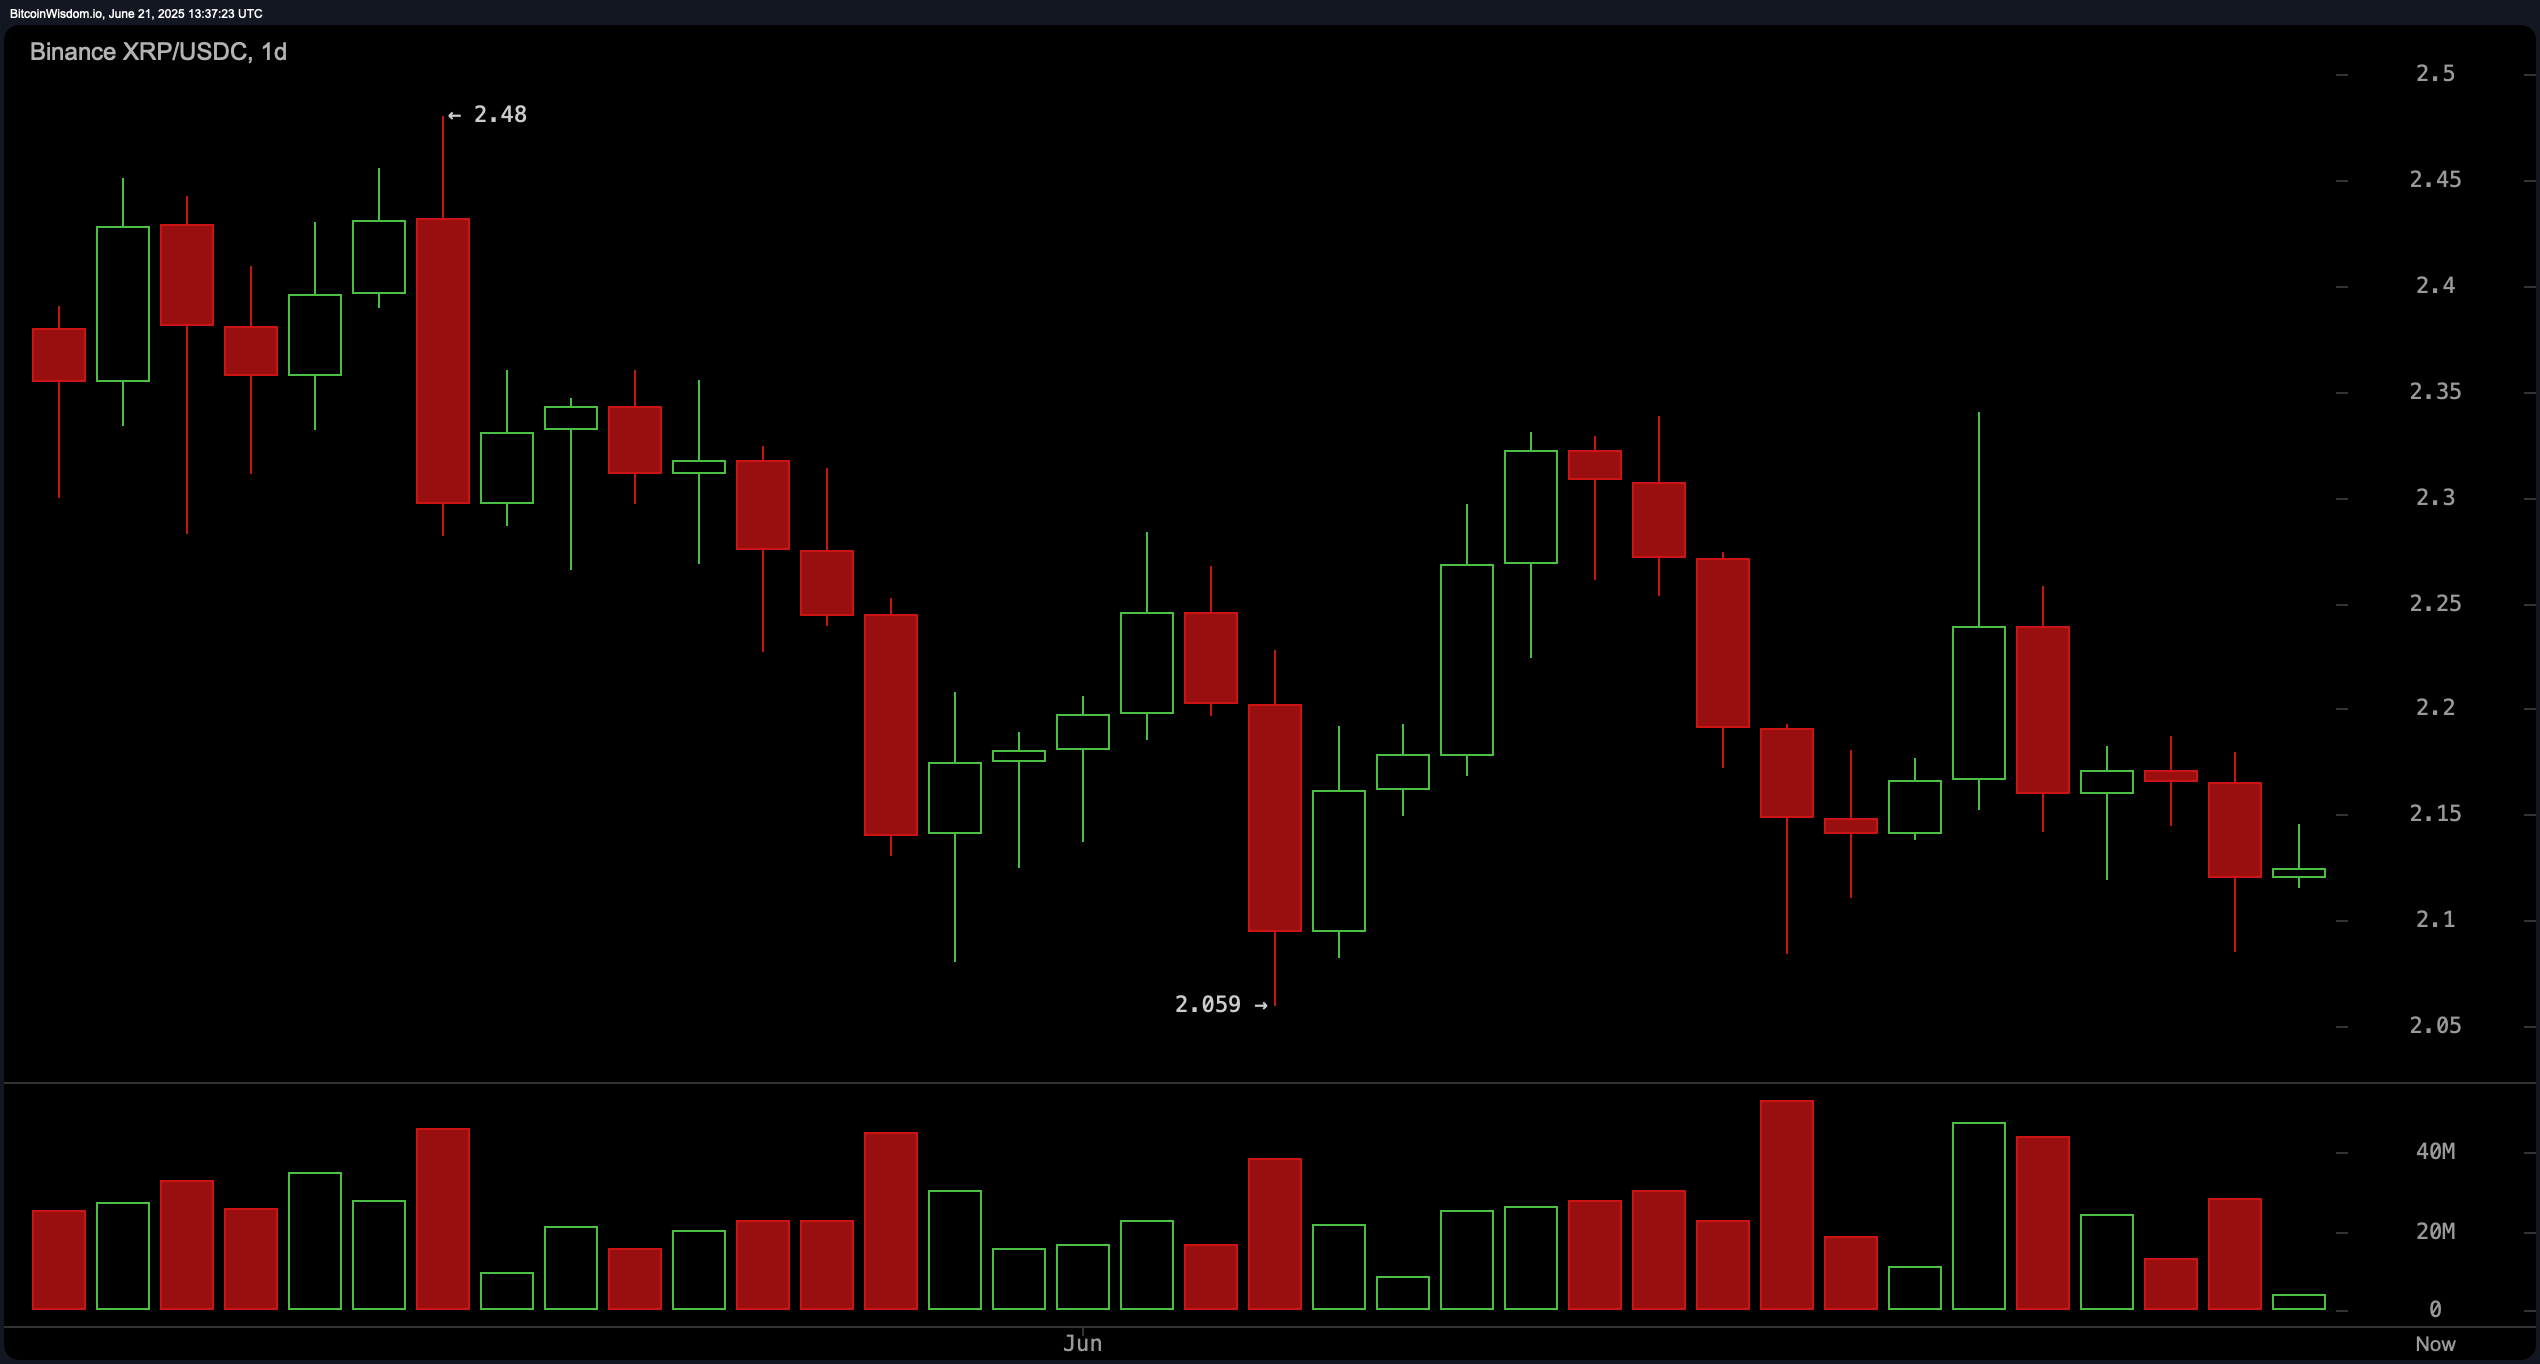
On the daily chart, XRP remains in a medium-term downtrend that started after the price peaked at $2.48. The token is currently hovering near $2.13, trading above key support at $2.06 but unable to establish a clear bullish stance. The formation of weak bullish candles and diminishing volume reflect a market that is either consolidating or losing steam. Until XRP breaks through $2.18 with strong follow-through, the daily trend remains skewed toward the downside.

Oscillator readings present a mixed but predominantly neutral sentiment. The relative strength index (RSI) stands at 42.52, indicating neither overbought nor oversold conditions. The Stochastic oscillator at 20.66 and the commodity channel index (CCI) at −87.91 both align with a neutral posture. Similarly, the average directional index (ADX) at 13.27 confirms a weak trend environment. Diverging from the neutral tone, the Awesome oscillator posts a bearish signal at −0.08247, while momentum is slightly bullish at −0.14401. The moving average convergence divergence (MACD) level is at −0.03300, registering a bearish signal.
Moving averages (MAs) uniformly tilt bearish across short- to medium-term timeframes. The 10-period exponential moving average (EMA) and simple moving average (SMA) register at $2.16671 and $2.16252, respectively—both giving sell signals. This bearish alignment persists through the 20-, 30-, 50-, and 100-period EMAs and SMAs. Notably, only the 200-period EMA at $2.09689 issues a bullish signal, while its simple counterpart at $2.37786 remains in negative territory. This extensive bearish consensus in moving averages points out the continued downside pressure and cautions traders against premature bullish entries.
Bull Verdict:
A bullish scenario is plausible if XRP successfully defends the $2.06–$2.085 support zone and reclaims the $2.15 resistance with rising volume. Onchain metrics lend some optimism; notably, a significant drop in XRP reserves on Binance as of June 19 signals large-scale withdrawals, typically associated with accumulation and reduced short-term sell pressure. However, any bullish case demands confirmation through increased buyer activity and a break above key resistance zones.
Bear Verdict:
The prevailing technical structure leans bearish. XRP remains in a broader downtrend across all major timeframes, with uniformly negative signals from the majority of moving averages and oscillators. Onchain data reveals a spike in exchange inflows from large wallets between June 11–13, suggesting potential whale-driven sell pressure. Unless XRP can sustain a breakout above $2.15 with strong volume, further downside toward $2.06 or even $2.00 remains a high-probability scenario.
 news.bitcoin.com