One of the worst technical periods in Shiba Inu's recent history is currently underway. After declining steadily the asset is currently perilously above a fundamental support level at approximately $0.00001159. SHIB might be forced into territory not seen since early 2023 if there is a breakdown below this zone, which could lead to a steeper correction. Given the accompanying volume profile, the situation is especially dire.
Over the past several weeks, SHIB's trading volume has been steadily declining, indicating a troubling lack of interest from institutional and retail players. A price decline accompanied by a decline in volume is a classic indication of bearish exhaustion or abandonment rather than a healthy correction or reaccumulation.
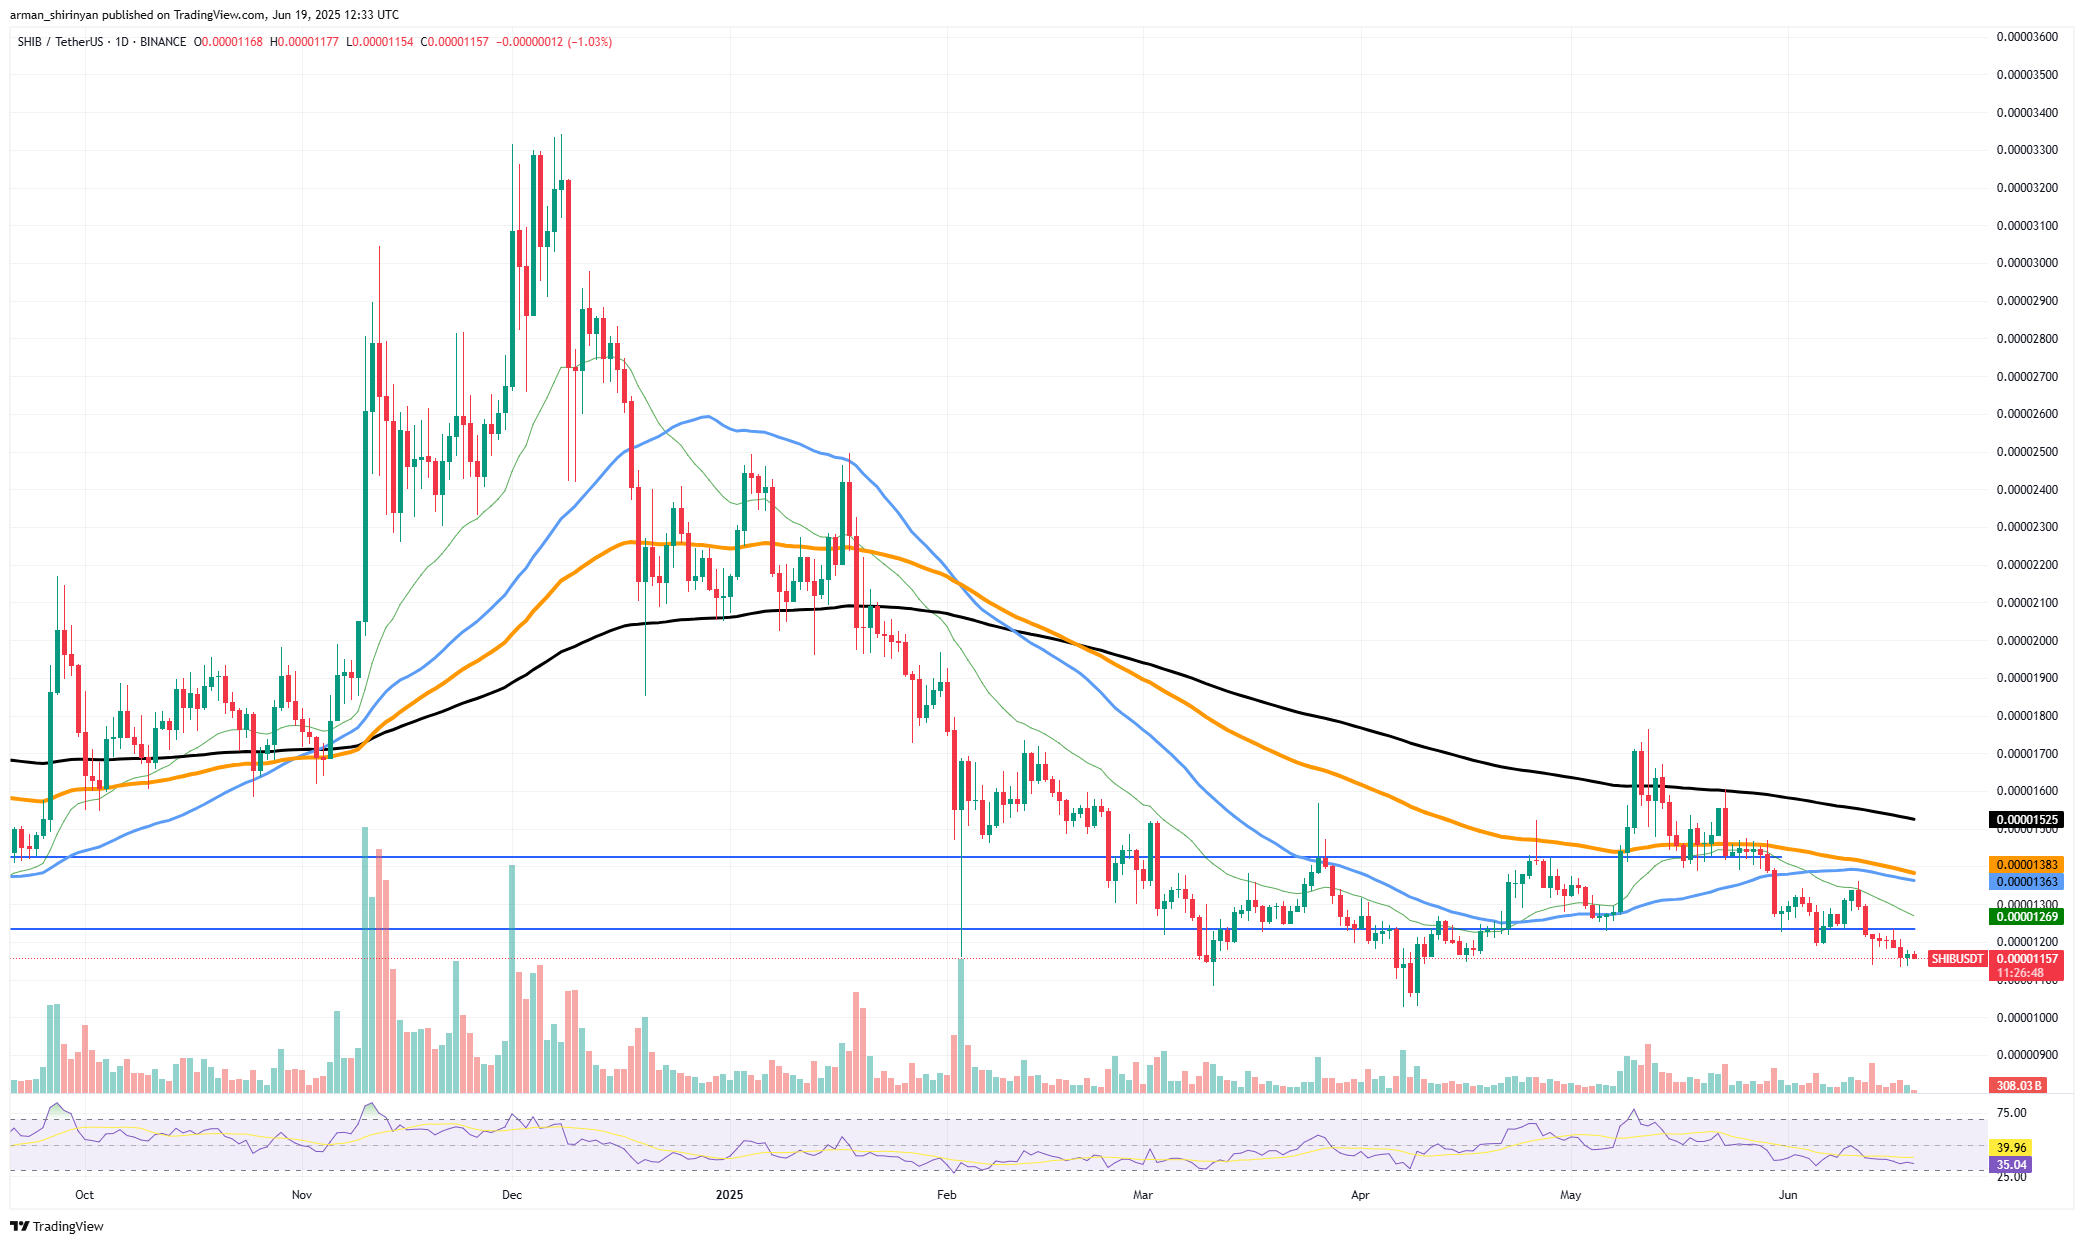
The 50, 100 and 200-day EMAs are all significant moving averages that have become solid resistance zones, and SHIB is currently trading well below them. There is no obvious indication of a reversal in sight, and the declining slope of each of these averages only serves to confirm the current bearish trend.
This dire situation is also supported by the RSI, which shows that the asset is having difficulty attracting even short-term speculative interest as it hovers in oversold territory without showing any discernible bounce. More losses appear likely unless SHIB can quickly recover above the $0.00001200 barrier and regain its 50-day EMA. It is bleak because there is not any catalyst. The technical picture is getting worse, and the community seems to be getting less involved.
Ethereum's potential catalyst
As it lingers around important moving averages, Ethereum is once again at a technical turning point. This is in preparation for a possible golden cross, a bullish signal that could spark a significant price increase. When a shorter moving average like the 50-day EMA crosses above a longer one like the 200-day EMA, it is known as a golden cross.
Ethereum had a strong rally in May, rising from below $2,400 to almost $2,900 in a few sessions. Based on price action, it appears to be in a phase of healthy consolidation. As ETH has moved sideways since then, it has formed a flag-like structure that frequently signals the start of another upward leg, especially when supported by a technical trigger like a golden cross.
The recent cooling of the BTC to ETH rotation is significant because it suggests that Ethereum may be about to enter a phase of independent momentum. Since Bitcoin's dominance has leveled off, ETH and other significant altcoins are now able to breathe easier. Now that the rotation story is less important, Ethereum can determine its course using its own technical positioning and fundamentals.
The amounts of $2,460 and $2,375 are support levels to keep an eye on; these are areas that closely match short- to mid-term EMAs and may serve as launching pads if selling pressure increases. On the plus side, a clear break above $2,800 would highlight the psychological level of $3,000 and probably lead to new technical trader inflows.
Bitcoin in danger
With traders watching for a possible decline below $100,000, the price of Bitcoin is perilously near a critical psychological and technical level. At $104,900, Bitcoin is currently trapped between thin bid support at $103,000 and liquidity at $105,000. Global macroeconomic tensions exacerbate the market's hesitancy, which keeps volatility low and traders wary. The $105,000 mark is turning out to be a crucial turning point.
BTC has had difficulty breaking through this ceiling because it is not only psychological resistance but also the location of significant sell-side liquidity clusters. Any persistent rejection from this sector might trigger a wave of bids that could eventually reach $103,000. This narrative is further supported by local volume metrics.
The Point of Control (PoC), as indicated by the Fixed Range Volume Profile (FRVP), is at $103,000. Throughout June, this level has served as both support and resistance. Its relevance is further highlighted by the fact that this level overlaps with the weekly composite volume profile. Bitcoin faces a significant increase in downside risk if it is unable to maintain above this zone.
Because the RSI is neutral, neither bulls nor bears have a significant advantage. The likelihood that Bitcoin will chop or bleed lower into support appears to be growing unless a clear catalyst surfaces. Furthermore, $100,000 becomes a brittle floor, if not a trapdoor, if $104,000 breaks convincingly.