XRP price is currently showing signs of consolidation after a volatile mid-June run. Based on both the daily and hourly charts, the asset is hovering near a critical support-resistance zone, and traders should pay close attention to upcoming price behavior. Let’s break down what the XRP price charts reveal and what to expect next.
XRP Price Prediction: What Does the Daily Chart Say?
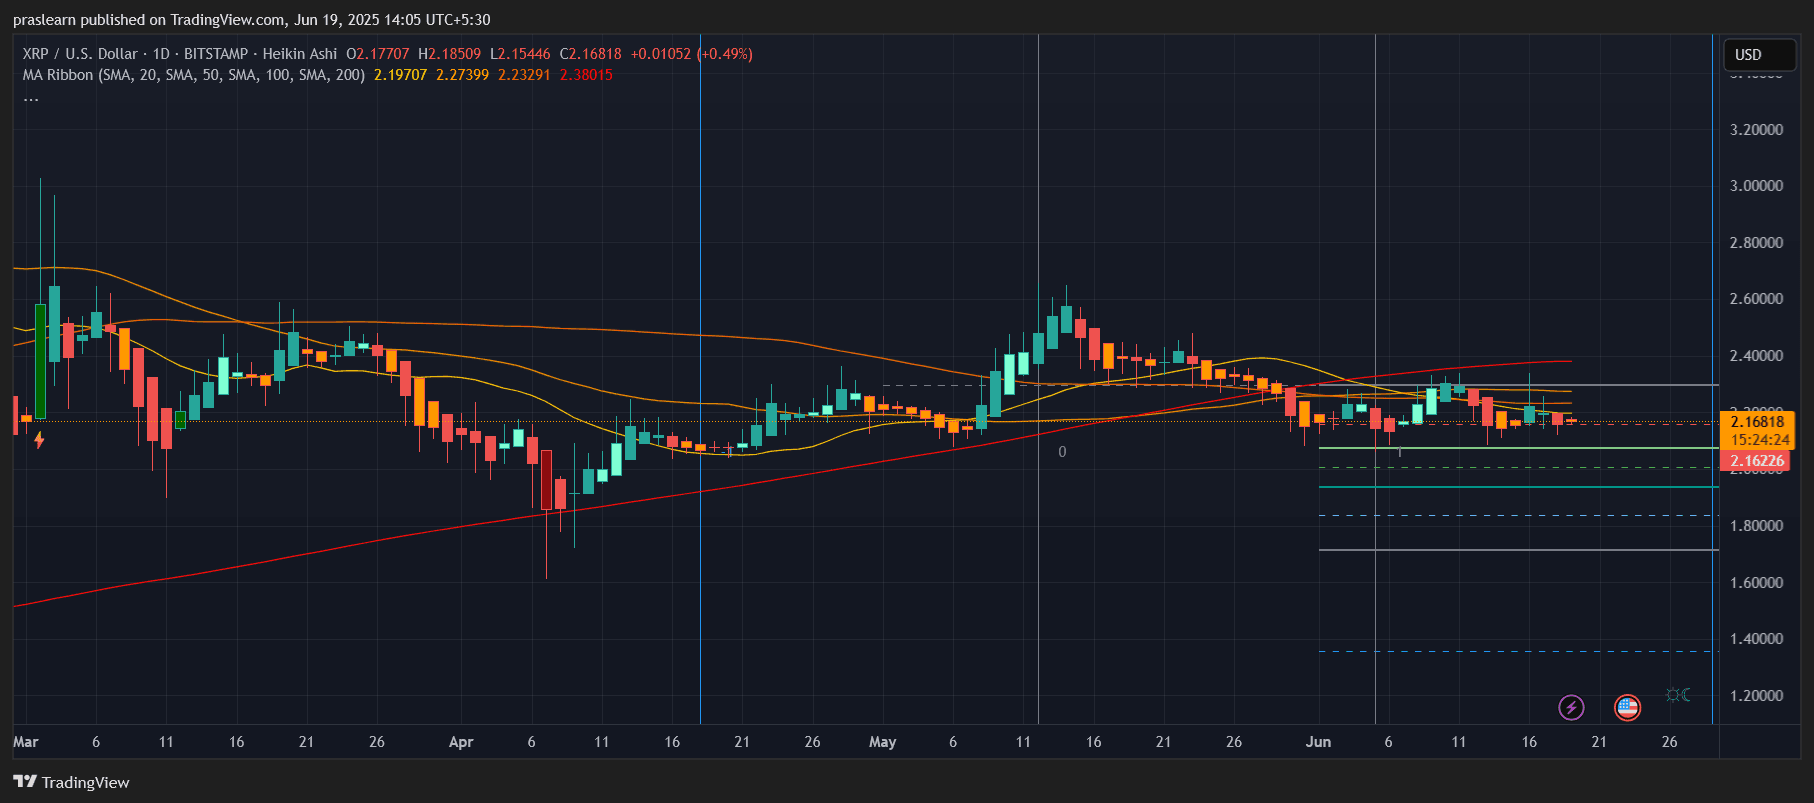
The daily chart paints a picture of indecision. After failing to hold above $2.40 in late May, XRP price has retreated to a tight range near $2.15–$2.17. The price is currently testing its 20-day and 50-day simple moving averages, both of which have flattened out — a clear indication of consolidation.
Key observations:
- Resistance levels: $2.23, $2.27, and $2.38 (SMA 100 and 200).
- Support levels: $2.10 and $1.90. Below $1.90, we could revisit $1.70 and $1.50 zones.
- The SMA 200 at ~$2.38 is acting as a longer-term ceiling. Until that’s breached, XRP price will remain in a sideways-to-bearish structure.
A quick Fibonacci retracement from the May swing high ($3.20) to the June low ($2.00) puts the golden 0.618 retracement level around $2.70, which remains untouched — a sign that bulls are still lacking full control.
Hourly Chart Insights: A Temporary Cool-Off?
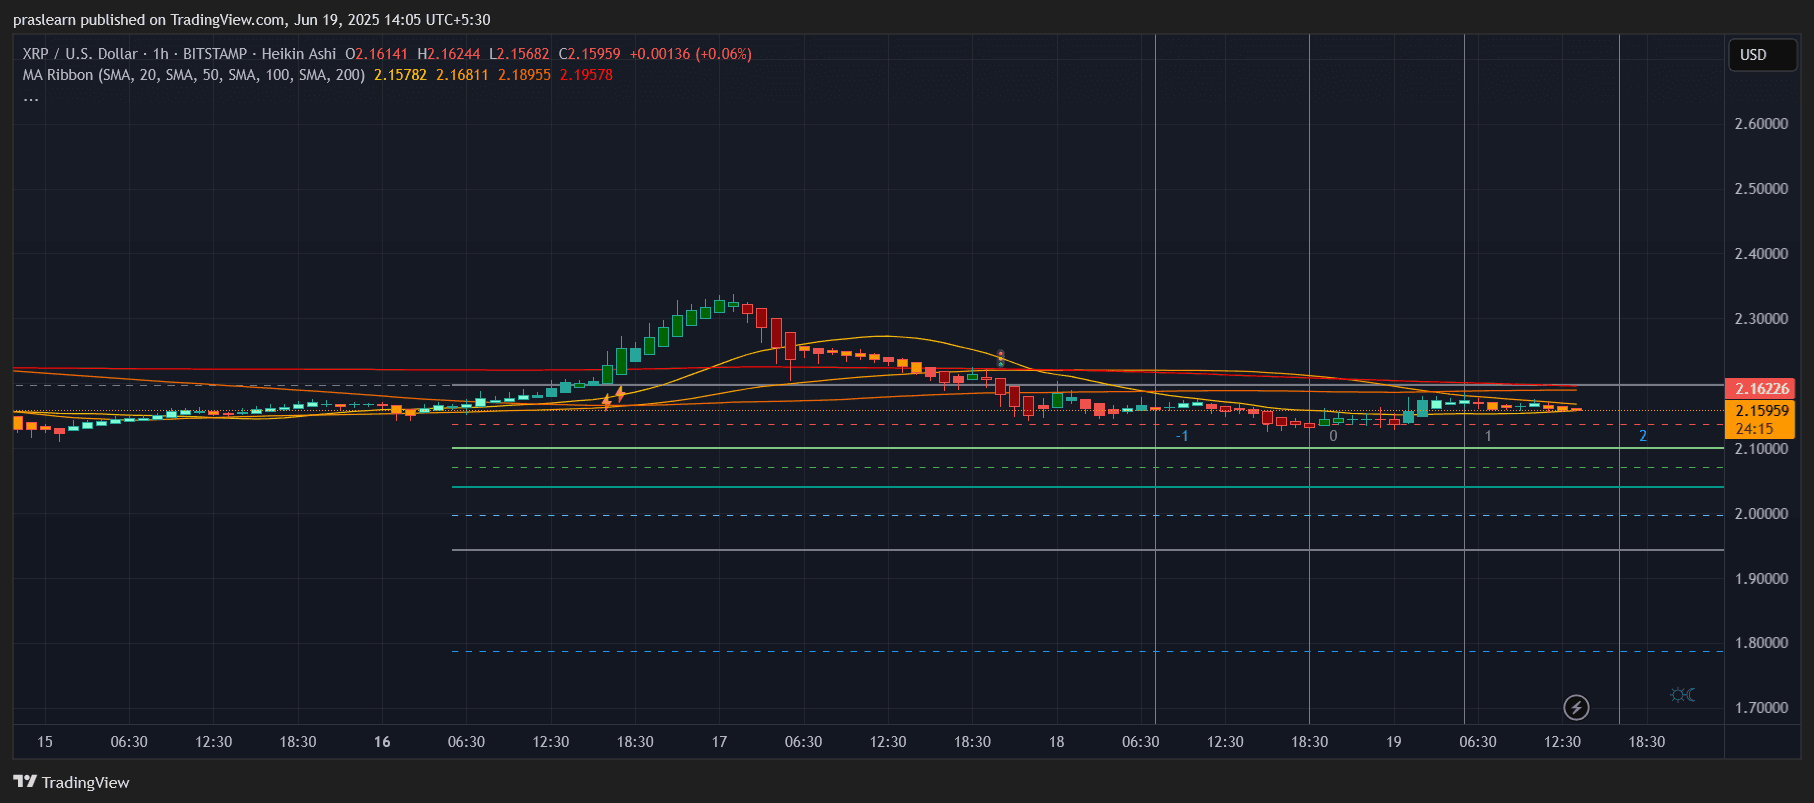
The hourly Heikin Ashi chart shows a sharp rise followed by a consistent drop, forming a classic pump-and-dump pattern.
Key points:
- The rally peaked near $2.40, but heavy selling pressure pushed XRP price down to $2.15.
- XRP is now hovering around all four key moving averages (20, 50, 100, 200), which are converging around $2.16–$2.19 — forming a moving average ribbon compression, a common precursor to a breakout or breakdown.
- Low volatility candles on the hourly chart suggest a buildup in pressure.
This "squeeze" often leads to a decisive move. But which direction?
XRP Price Prediction: Is XRP Preparing for a Move?
Let’s consider a few calculations:
1. Potential Upside Target
- If XRP breaks above $2.23 and clears the 100-day SMA:
- Target 1 = $2.38 (SMA 200)
- Target 2 = $2.70 (0.618 Fib retracement level)
% Gain from current price ($2.16 to $2.70)
→ ((2.70 - 2.16) / 2.16) × 100 ≈ 25% upside
2. Downside Risk
- If XRP drops below $2.10:
- Target 1 = $1.90 (previous swing low)
- Target 2 = $1.70 (support from early April)
% Loss from current price ($2.16 to $1.70)
→ ((2.16 - 1.70) / 2.16) × 100 ≈ 21% downside
Risk-Reward Ratio = 25/21 = 1.19
This isn’t bad, but traders should wait for breakout confirmation. XRP Price compression near key MAs hints at volatility ahead — expect a breakout soon. Bullish breakout needs a clean move above $2.23 with volume; otherwise, it’s a fakeout. Support at $2.10 is critical — breakdown here could accelerate selling. Short-term traders can scalp between $2.10–$2.23 range; longer-term investors should wait for breakout past $2.38.
Final Thoughts: What Should Traders Do?
XRP price is at a make-or-break level. The price action suggests a breakout is near, but direction isn’t yet clear. Risk-conscious traders may wait for confirmation past $2.23 or below $2.10 before making strong entries. With volatility squeezing and moving averages converging, XRP is setting up for its next decisive leg — up or down.
$XRP, $XRPPrice