After days of bearish grind, Dogecoin price is attempting to reclaim higher ground near the $0.1720 mark. However, sellers remain active on the upside, capping DOGE’s recovery within a well-defined downtrend channel. The broader market shows mixed sentiment, and Dogecoin’s technical setup reflects a battle between key support defense and rising pressure from lower highs.
What’s Happening With Dogecoin’s Price?
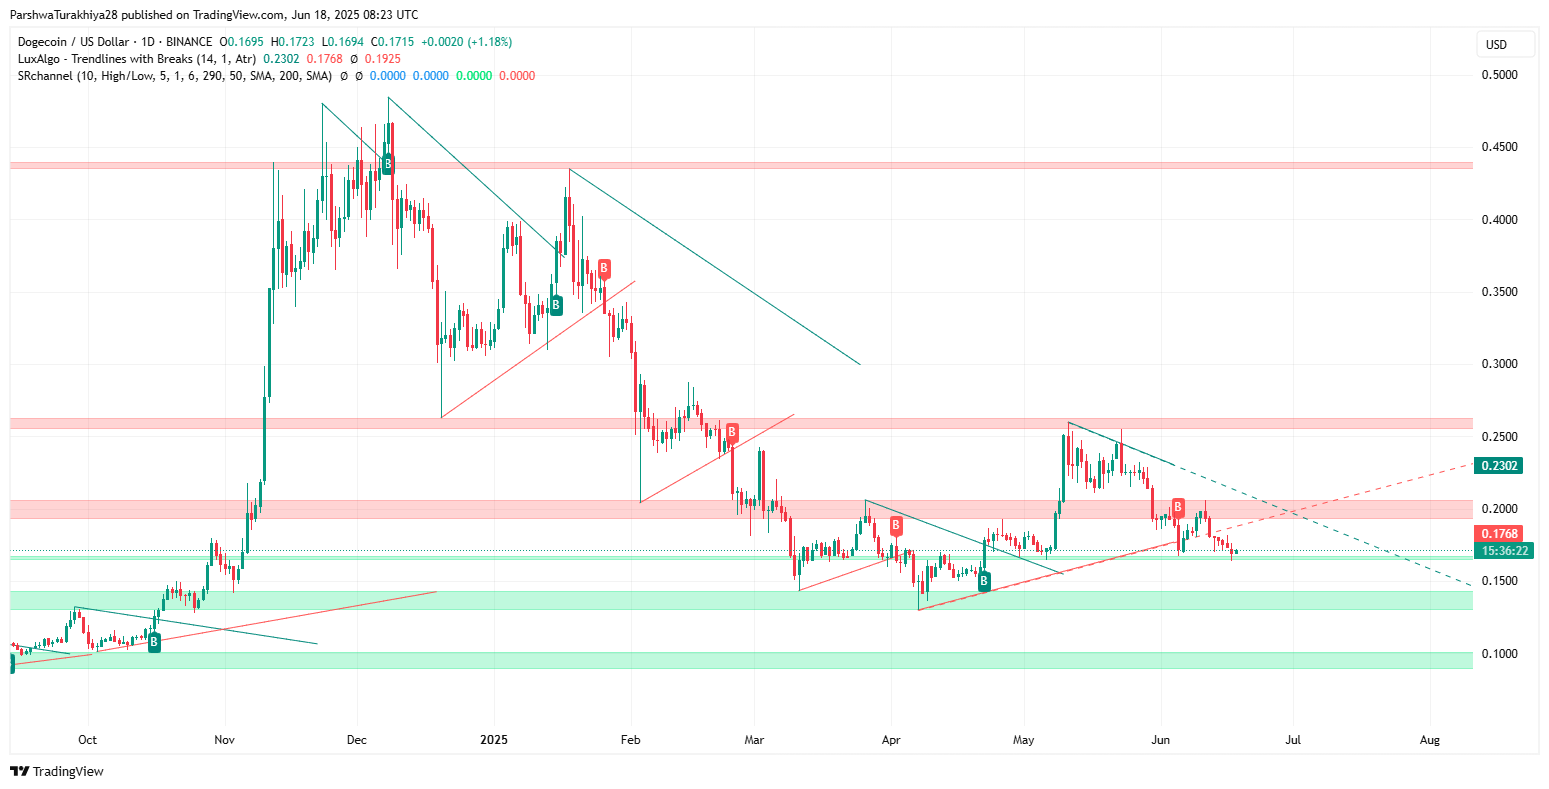
As of June 18, Dogecoin price today is hovering around $0.1715, up 0.35% intraday, but still locked below short-term resistance near $0.1760. The recent bounce off the $0.1650 support zone has helped DOGE avoid deeper losses for now. However, the downtrend structure remains intact, as marked by repeated trendline rejections across the 4-hour and daily charts.
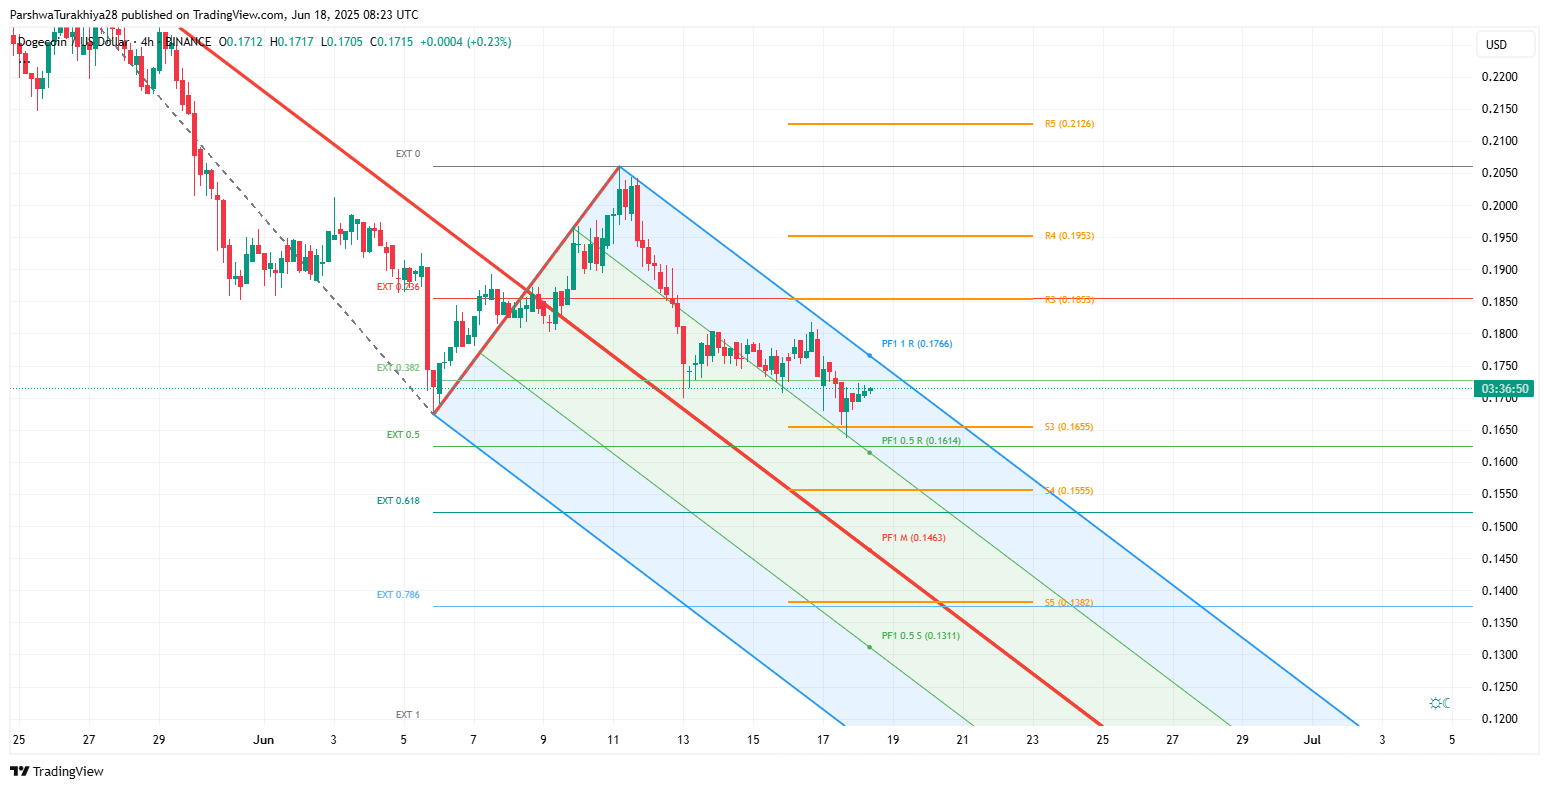
The Dogecoin price action continues to follow a descending channel, with the current pivot playing out between the 0.382 and 0.5 Fib extensions from the June swing high to low. Price is consolidating inside a narrow band just above the PF1 0.5R line at $0.1614, while $0.1766 and $0.1855 remain the next upside hurdles from a pivot standpoint.
Dogecoin Price Prediction: EMA, Bollinger And Supertrend Confirm Bearish Structure
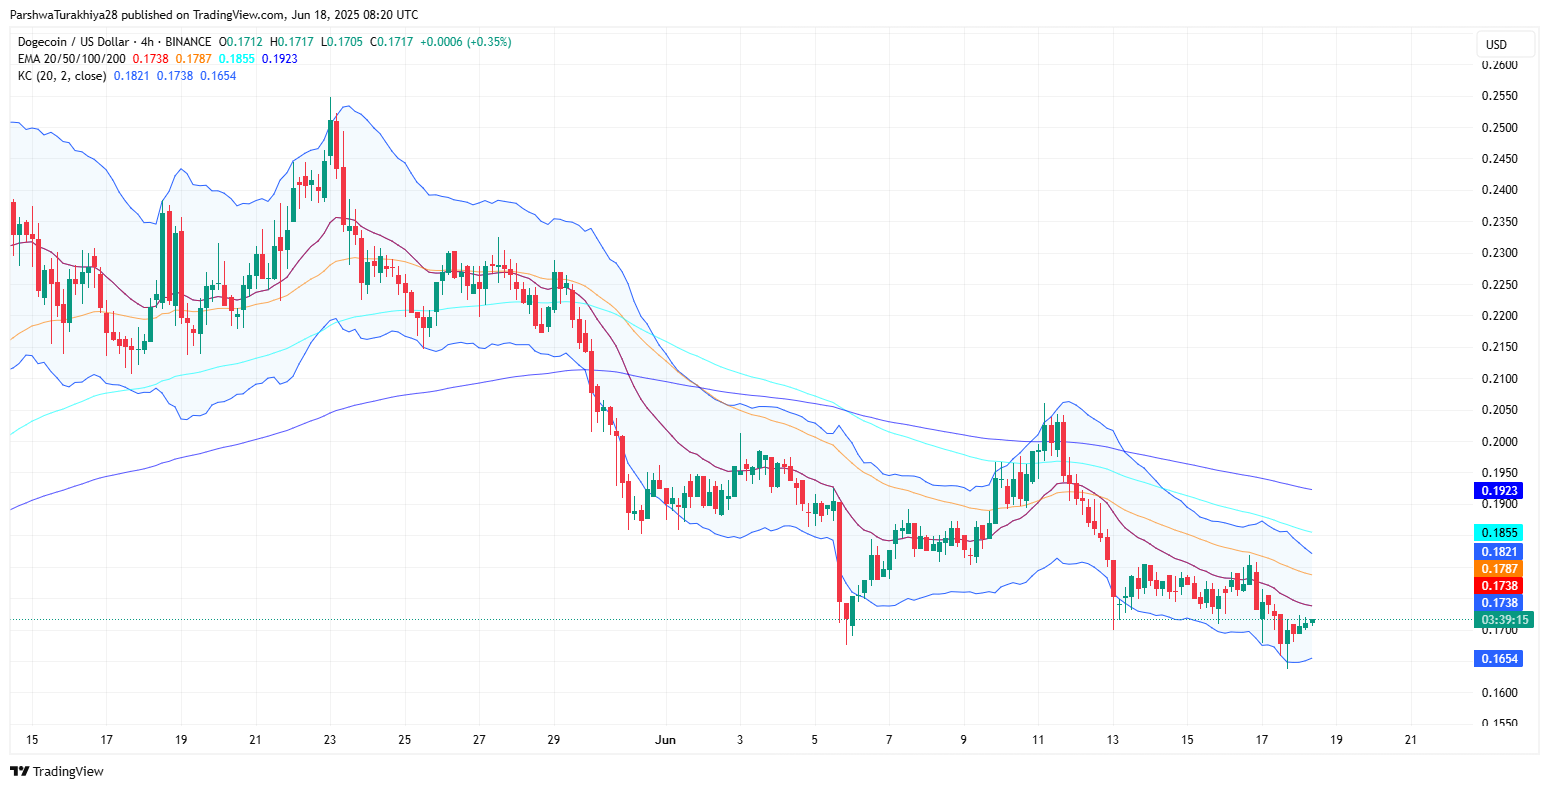
The 20/50/100/200 EMA cluster on the 4-hour chart shows bearish alignment, with Dogecoin price trading below all moving averages. The 20 EMA near $0.1738 and 50 EMA around $0.1787 are acting as dynamic resistances, reinforcing the rejection zone beneath $0.1760.
Keltner and Bollinger Channels are both narrowing, reflecting Dogecoin price volatility compression. The upper Bollinger band sits near $0.1923 while the lower band is pushing up from $0.1654. This tightening structure often precedes a breakout move, with current bias favoring downside unless bulls flip the EMA cluster.
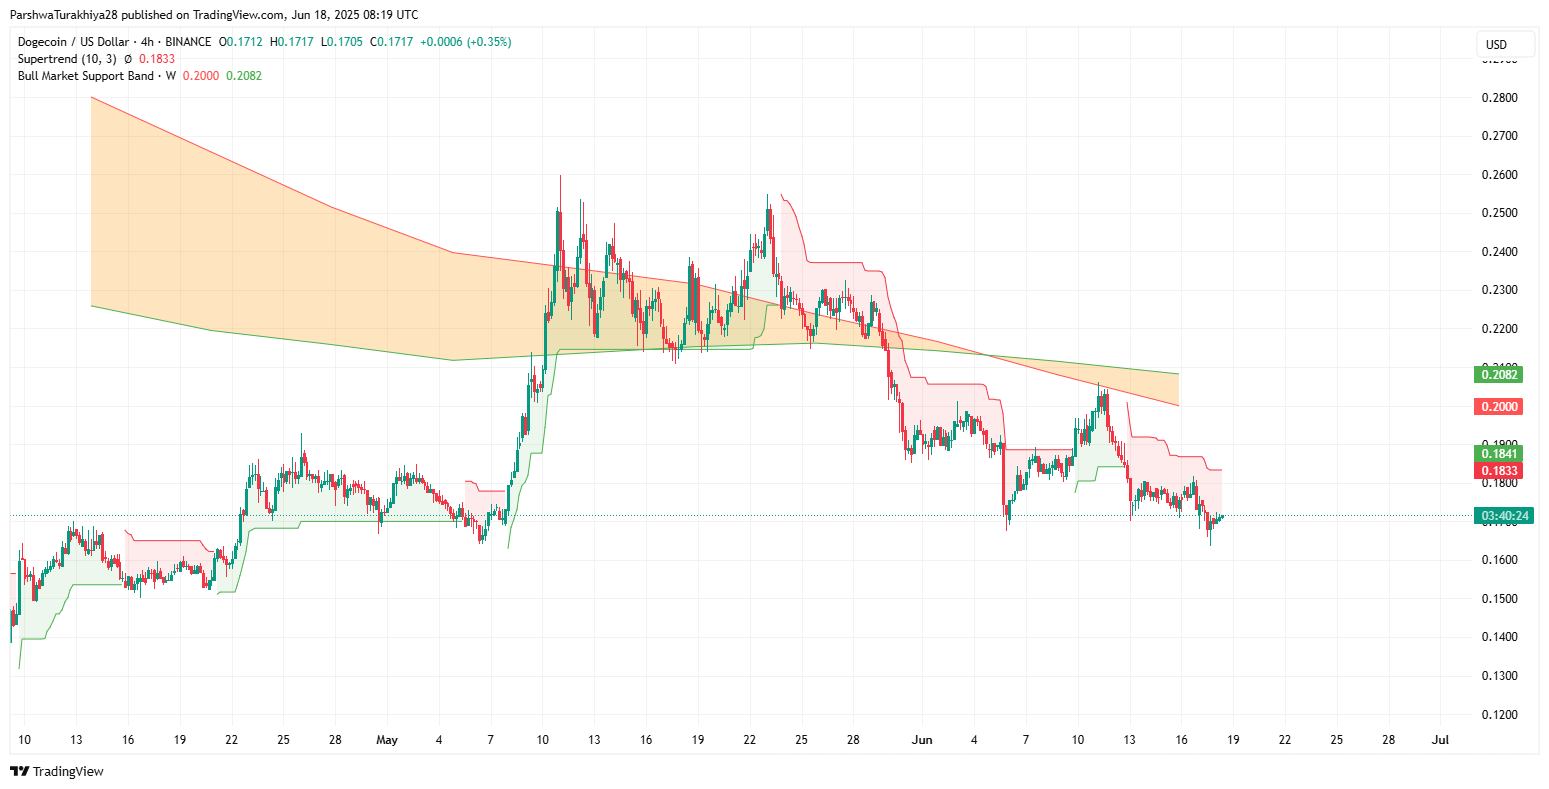
The Supertrend indicator has remained in a sell signal since early June and has not flipped bullish, with resistance marked at $0.1833. Additionally, the Bull Market Support Band sits much higher between $0.2000 and $0.2082, confirming that DOGE remains in a mid-term bearish phase.
Dogecoin Price: Momentum And Volume Tools Point To Weak Buyer Commitment
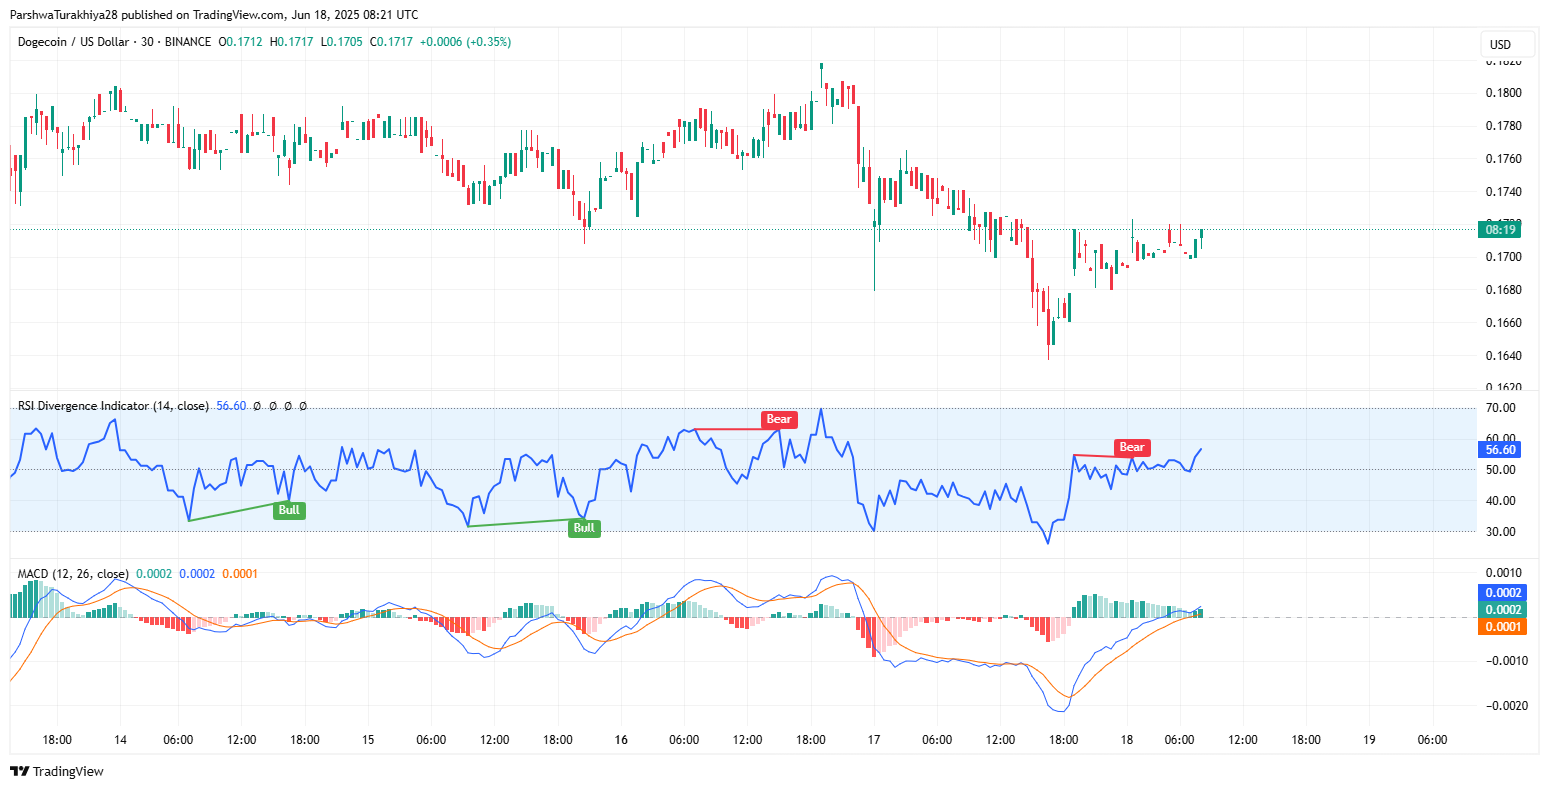
The RSI on the 30-minute timeframe shows weak bullish divergence, hovering near 56.6 after bouncing from the 30 zone. While this hints at a short-term recovery attempt, it lacks strong volume confirmation.
The MACD on the same timeframe is slightly positive but flat, showing weak bullish crossover with almost zero histogram slope. This suggests low momentum and indecision.
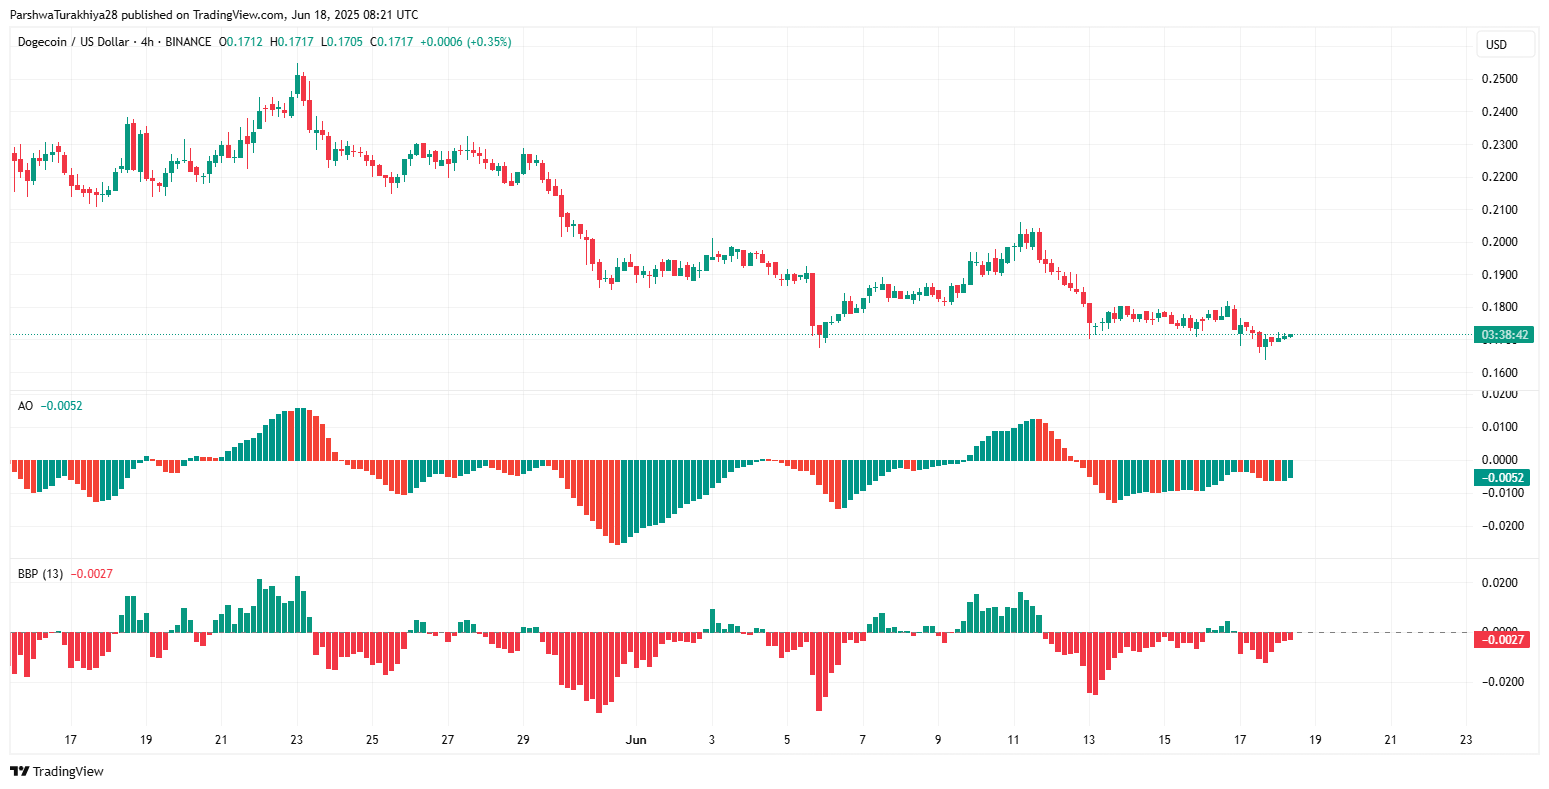
The Awesome Oscillator (AO) has turned green but remains just above the zero line, showing no strong directional push. Similarly, the BBP (13) indicator remains in negative territory, indicating suppressed bullish pressure.
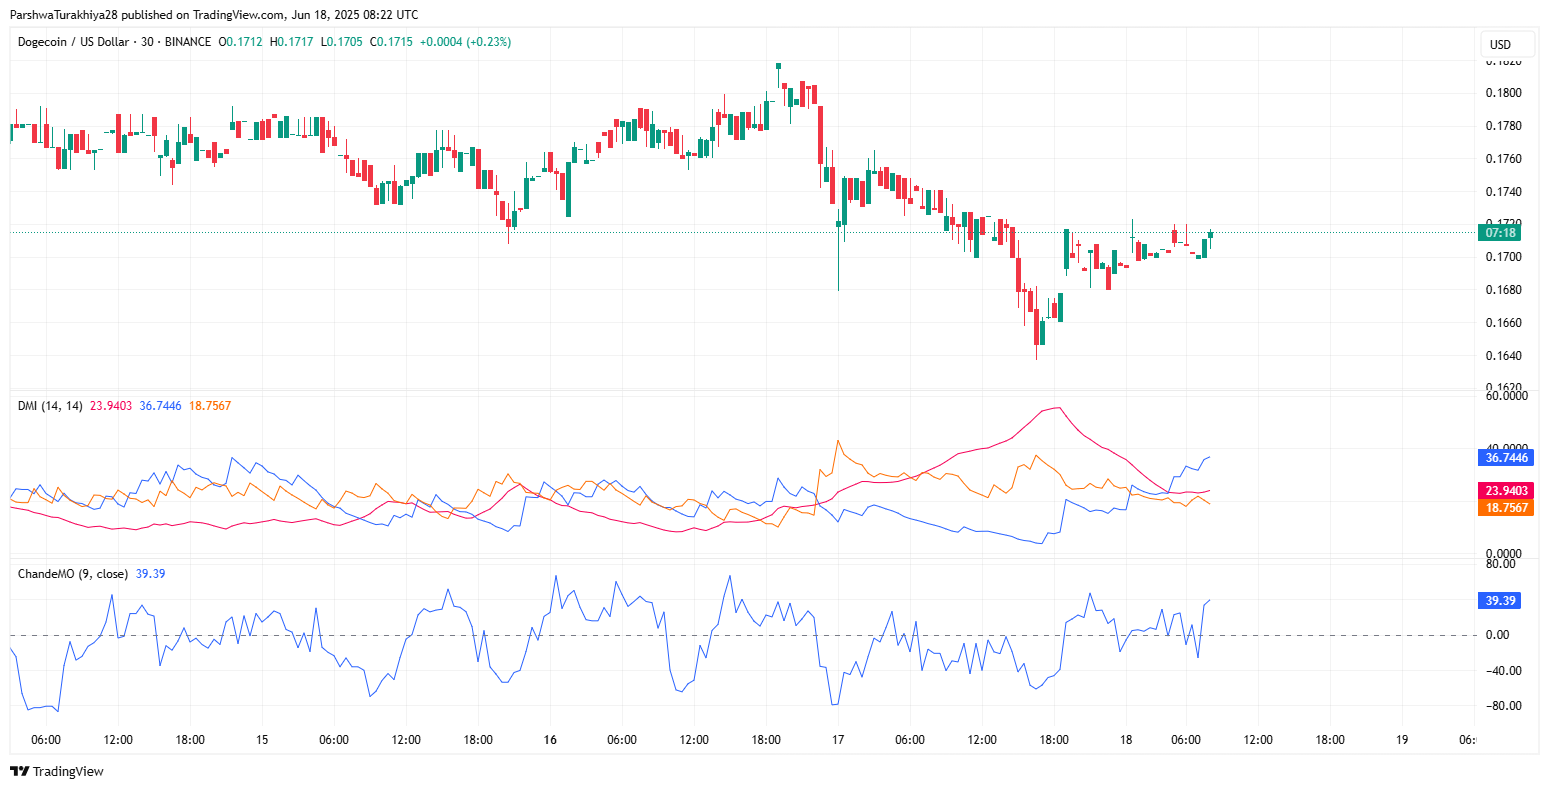
On the DMI front, the -DI (23.94) and +DI (18.75) are still favoring bears, and the ADX is rising past 30.67, showing a strengthening bearish trend. The Chande Momentum Oscillator has ticked up to 39.39, but this recovery remains tentative.
Dogecoin Price: Volume Profile And Fibonacci Confirm Key Zones
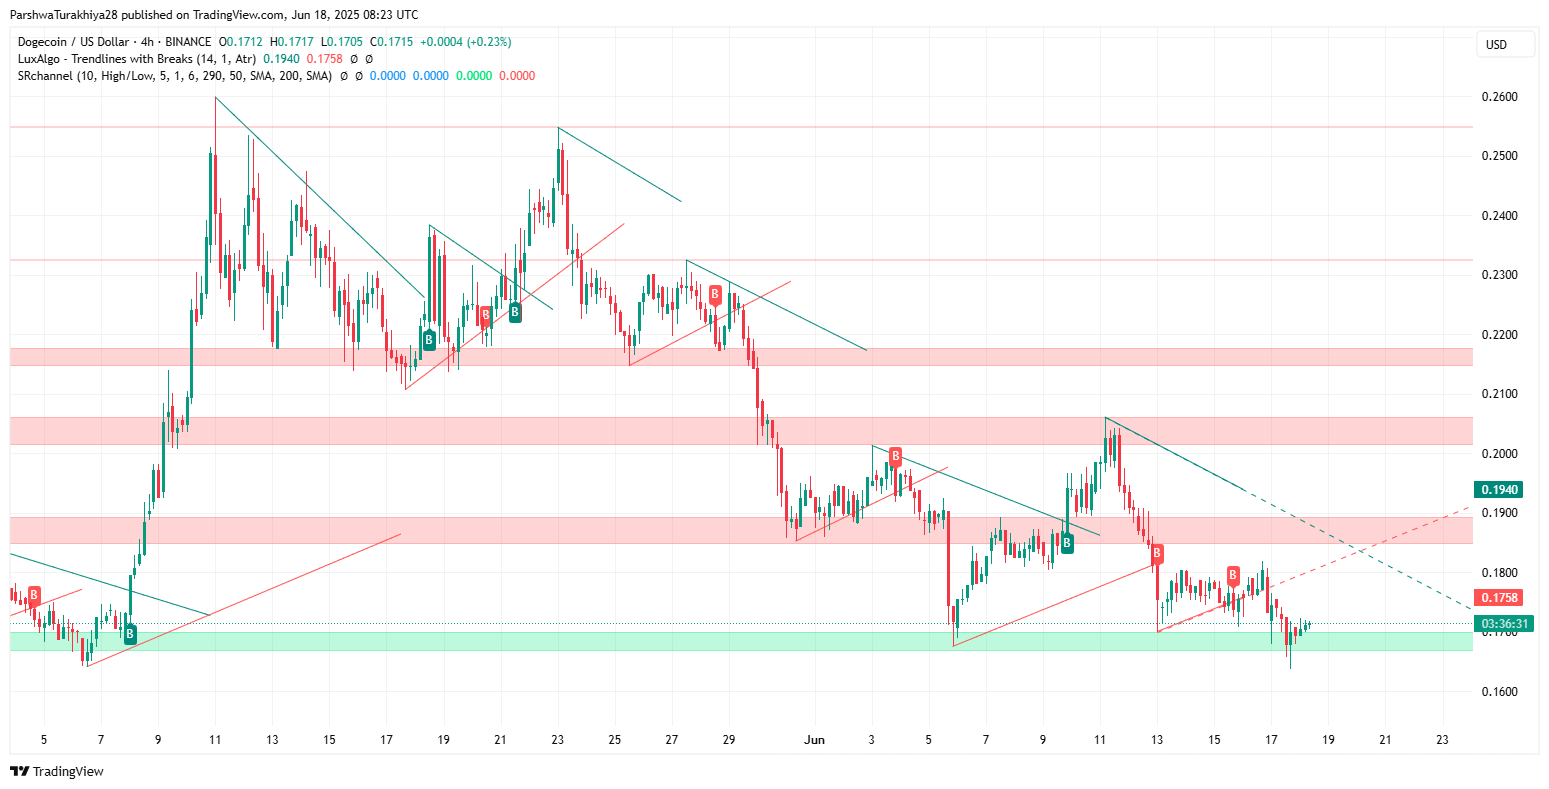
Looking at the Volume Profile and structure levels, the key demand zone sits between $0.1600 and $0.1650, where DOGE previously bounced twice. A breakdown below $0.1610 would put $0.1555 and $0.1463 in focus as next bearish targets, as identified by the lower bounds of the Fib-based pitchfork.
On the higher side, DOGE faces stiff resistance near $0.1766 (Fib R1), then $0.1855 and $0.1953. Only a break and daily close above the mid-channel and the $0.1940 breakout level would hint at a structural shift.
Why Dogecoin Price Going Down Today
The Dogecoin price going down today is largely a result of trendline resistance, failure to reclaim key EMAs, and the broader market’s hesitation around speculative assets. The lack of strong buyer volume, coupled with a bearish Supertrend and rejection from the upper boundary of the falling wedge, keeps the token under pressure.
Unless DOGE can recover above $0.1760 with volume and flip the EMA cluster, Dogecoin price may retest the $0.1610–$0.1650 demand zone in the coming sessions.
Dogecoin Price: Short-Term Forecast And Outlook
| Technical Indicator | Signal | Level/Zone |
| Current Dogecoin Price | – | $0.1715 |
| 4H Trend Structure | Bearish | Lower highs |
| EMA Cluster (20–200) | Bearish alignment | $0.1738–$0.1923 |
| Supertrend | Sell signal | Resistance @ $0.1833 |
| Bull Market Support Band | Resistance zone | $0.2000–$0.2082 |
| RSI (30-min) | Recovering from oversold | 56.6 |
| MACD | Weak bullish crossover | Flat histogram |
| AO & BBP | Low bullish momentum | Slightly negative |
| Key Support | Fib 0.5R @ $0.1614 | Then $0.1555 |
| Key Resistance | $0.1766, $0.1855, $0.1940 | Fib and trendlines |
Dogecoin price today reflects a fragile recovery amid a broader bearish structure. Despite some short-term momentum on lower timeframes, higher timeframe charts and indicators such as the Supertrend and EMAs still suggest caution. For bulls to regain control, DOGE must break $0.1760 with conviction and hold above $0.1855. Until then, price risks remain skewed to the downside.
Disclaimer: The information presented in this article is for informational and educational purposes only. The article does not constitute financial advice or advice of any kind. Coin Edition is not responsible for any losses incurred as a result of the utilization of content, products, or services mentioned. Readers are advised to exercise caution before taking any action related to the company.