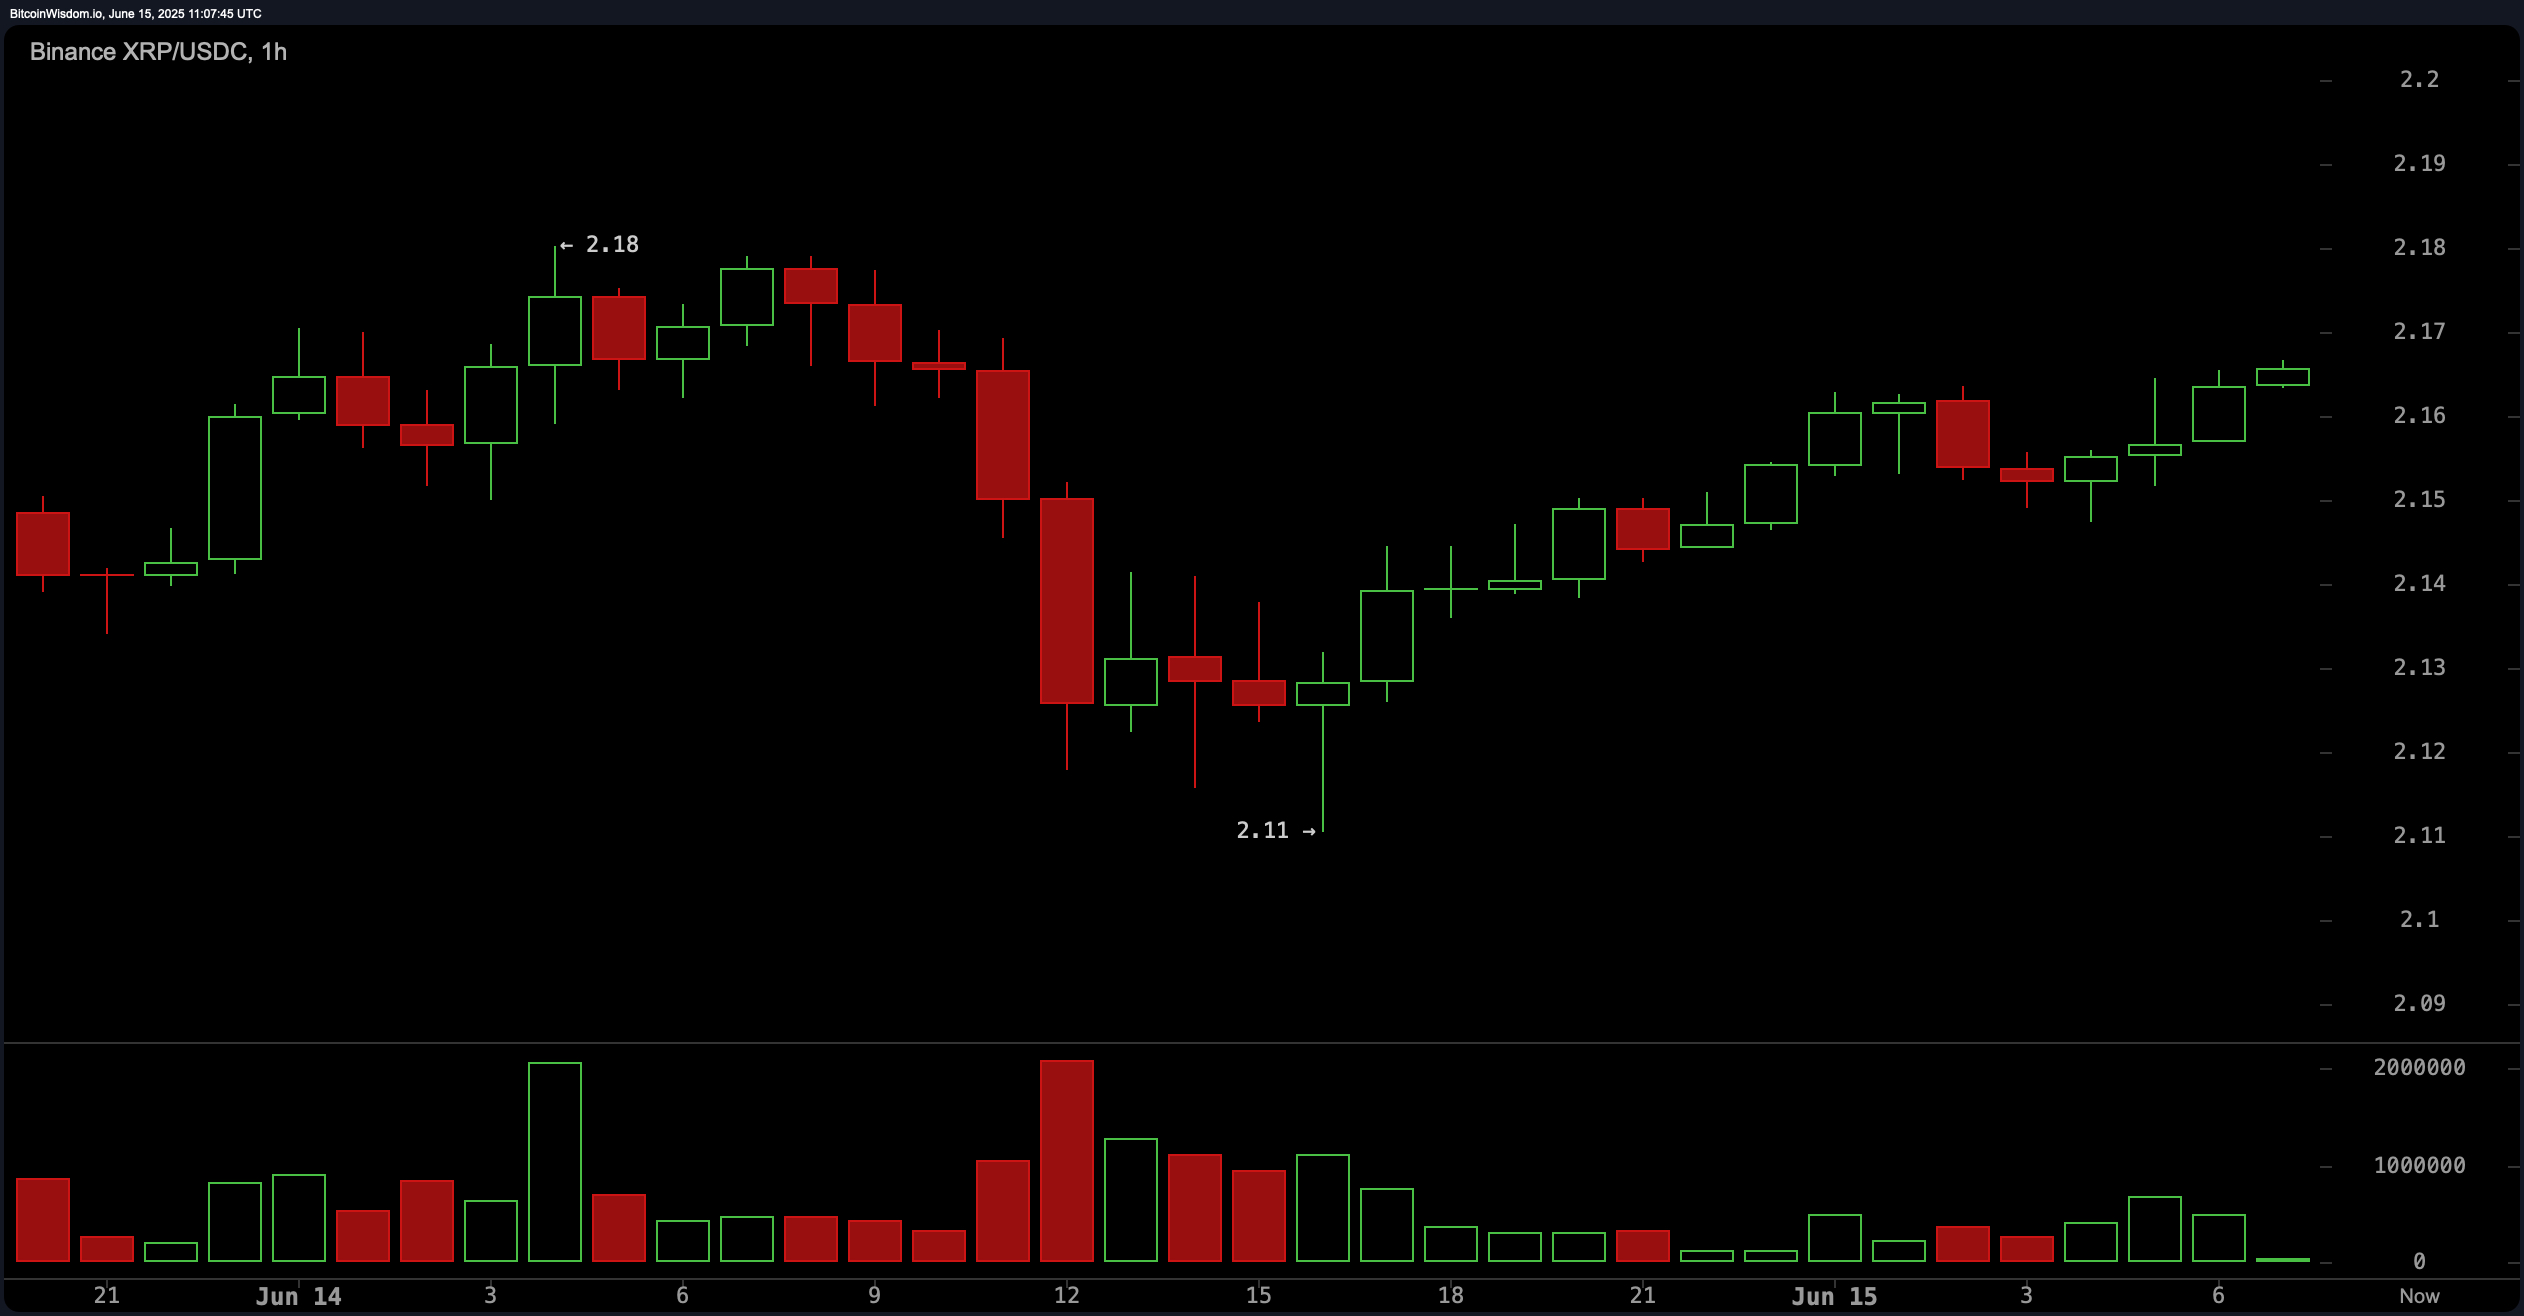
XRP is currently trading at $2.16, with a market capitalization of $127 billion and a 24-hour trading volume of $1.438 billion. The price has fluctuated between $2.11 and $2.18 over the past day, signaling a tightly constrained range as momentum builds.
XRP
The one-hour chart indicates a short-term recovery trend for XRP, with prices rebounding from $2.11 to $2.17. This upward trajectory is marked by a pattern of higher lows and steady accumulation, suggesting a bullish undertone for intraday movements. Trading volume remains moderate, reinforcing the cautious optimism observed in the price action. Active traders might consider entering long positions on pullbacks to the $2.13–$2.14 range with a stop-loss just below $2.11. Profit-taking could be considered near the $2.18–$2.20 resistance zone unless a breakout materializes.
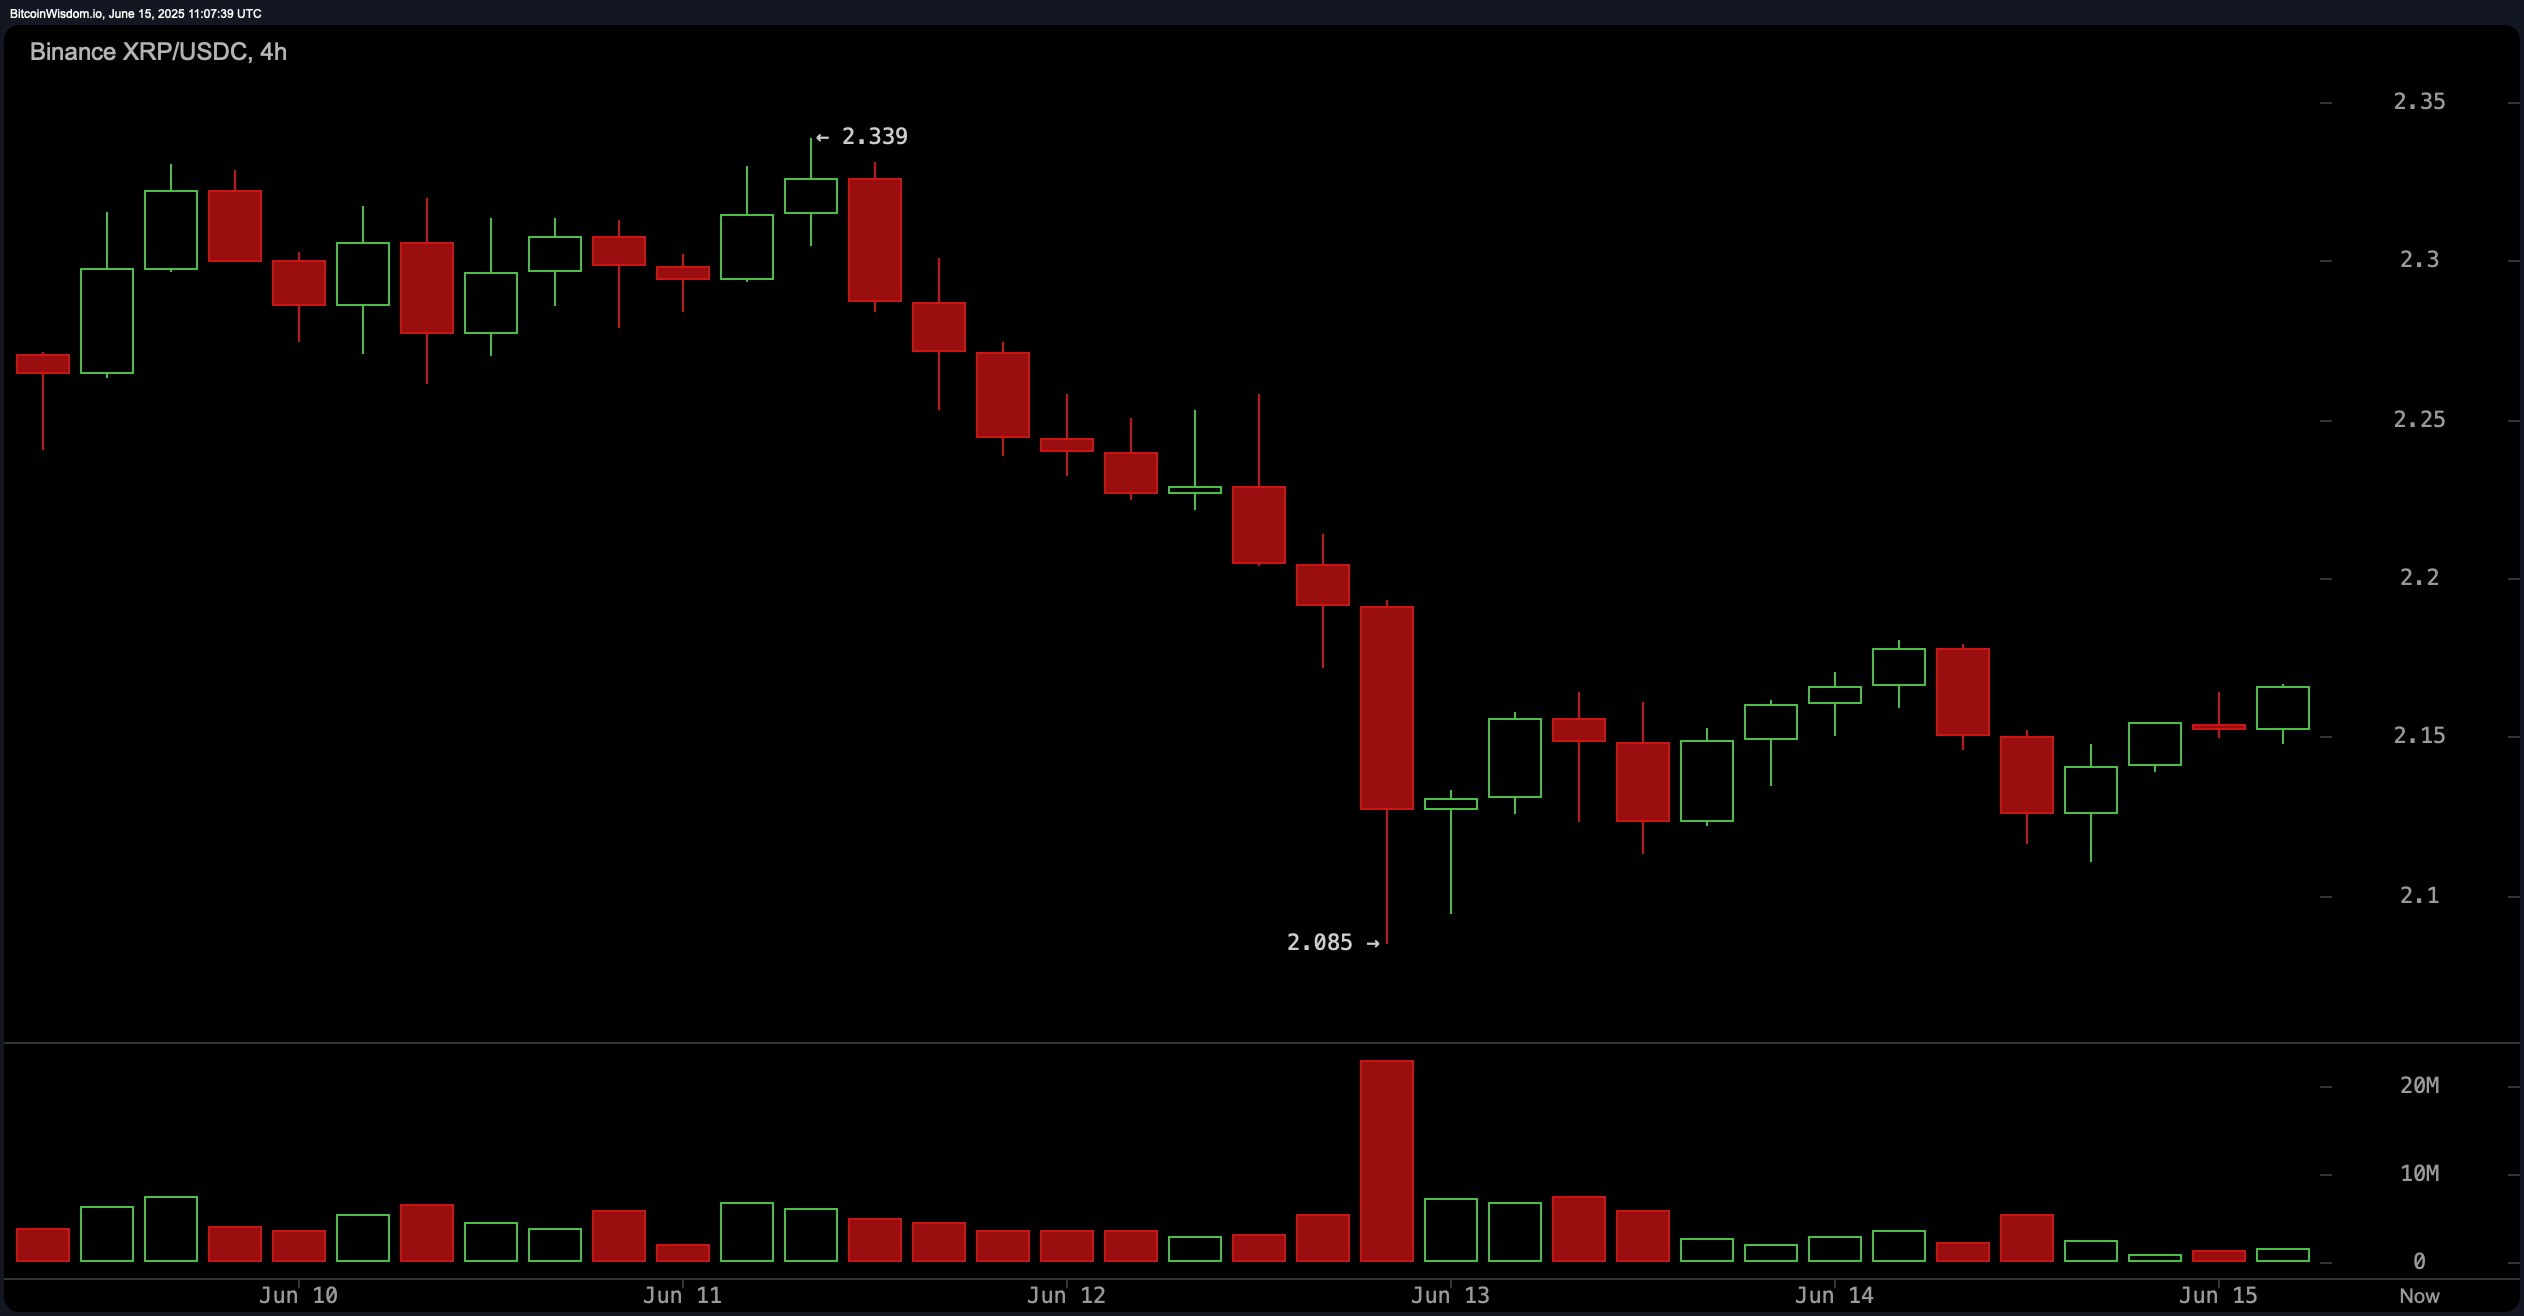
The four-hour chart presents a more nuanced picture, having undergone a sharp decline from $2.33 to $2.08 earlier in the week. This drop was accompanied by a significant spike in trading volume, implying strong bearish pressure. Since then, XRP has been consolidating within the $2.10–$2.17 range, potentially forming a bear flag or a narrow consolidation band. A decisive move below $2.10 could renew the downtrend, but a breakout above $2.18 with robust volume could signal a bullish reversal. Scalpers might find opportunities on breakouts above key resistance levels, with $2.25 as a potential target.
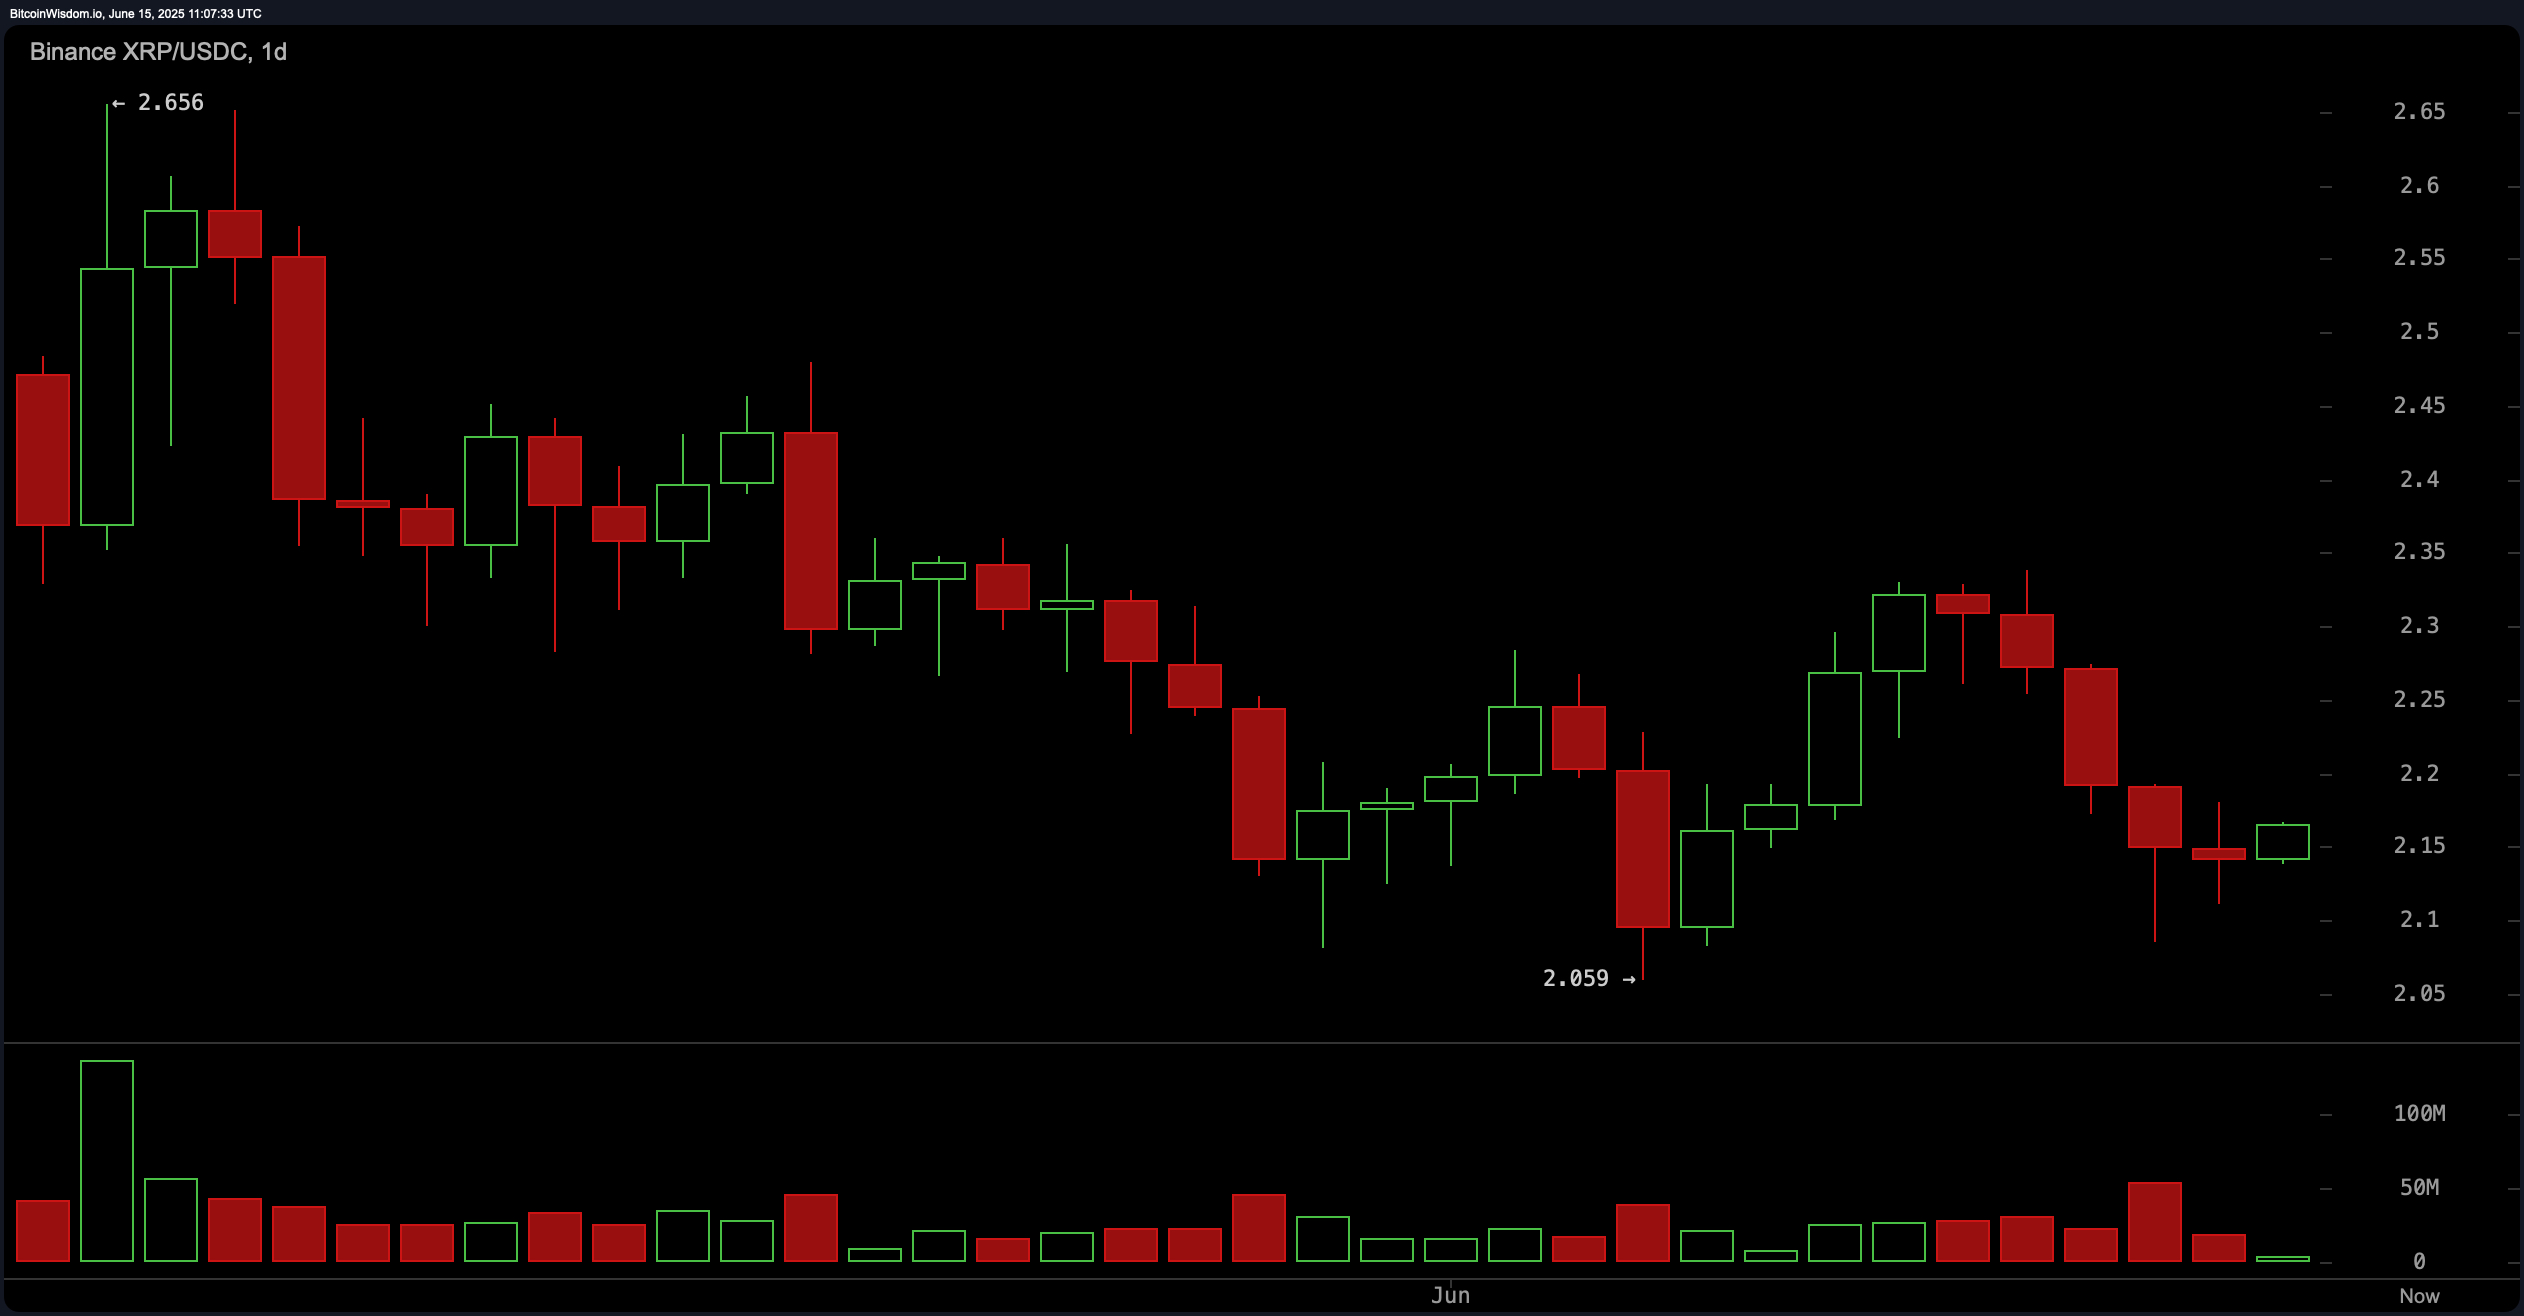
On the daily chart, XRP shows a broader downtrend from its recent high of $2.656, with a local bottom appearing near $2.05–$2.10. A weak bounce has since emerged, but there is no confirmed bullish reversal yet. The increasing volume accompanying red candles suggests lingering distribution and selling pressure. The critical resistance to watch lies between $2.30 and $2.35, while strong support remains around $2.05. A confirmed higher low followed by a close above $2.20–$2.22 could validate a shift in trend, providing a cautious long entry for swing traders.
The oscillator data offers a mixed outlook. The relative strength index (RSI, 14) stands at 44.17, signaling a neutral momentum. The Stochastic oscillator at 33.03 and the commodity channel index (CCI, 20) at −65.81 both support a neutral stance. The average directional index (ADX) at 17.73 reflects a weak trend. The Awesome oscillator at −0.09626 is also neutral, while the momentum at 0.07083 is the lone indicator flashing a bullish signal. The moving average convergence divergence (MACD, 12, 26) at −0.02835 confirms a bearish bias, currently suggesting negative sentiment.
Moving averages are predominantly bearish across the board. Both the 10-period exponential moving average (EMA, 10) at $2.19963 and the simple moving average (SMA, 10) at $2.21529 indicate a bearish signal. This trend continues across the 20-, 30-, 50-, and 100-period EMAs and SMAs, all of which remain above the current price, reinforcing downward momentum. Interestingly, the 200-period EMA at $2.09282 offers the only bullish signal, implying a long-term floor, while the 200-period SMA at $2.37713 still reflects bearish positioning. This extensive alignment of moving averages with selling pressure confirms the overarching downward trend in XRP’s price trajectory.
Bull Verdict:
XRP is exhibiting signs of short-term accumulation, particularly on the one-hour chart, with higher lows and a steady climb toward resistance. A breakout above $2.18, confirmed with strong volume, could pave the way for a move toward $2.25 and potentially test the $2.30–$2.35 resistance zone. Momentum indicators such as the 10-period Momentum oscillator suggest a possible bullish shift. However, bulls must remain cautious and await confirmation above the $2.20 level to validate a sustainable upward trend.
Bear Verdict:
Despite minor intraday rebounds, XRP’s broader price structure remains under pressure, with all key moving averages except the 200-period EMA pointing to continued bearish momentum. The daily chart reflects a pronounced downtrend from recent highs, and oscillators such as the Moving Average Convergence Divergence (MACD) and Commodity Channel Index (CCI) lean toward a bearish sentiment. If support at $2.10 fails, XRP could retest the $2.05 level or lower, exposing it to further downside risk in the absence of a confirmed bullish reversal.