
After enduring a prolonged decline throughout May and early June, the MANTRA (OM) price today is attempting a short-term rebound, trading near $0.276 as of June 14, 2025. The asset has bounced from the $0.243 low, with renewed buying interest reflected in rising volume and structural reclaim on intraday charts. While broader downside pressure remains visible, technical indicators now point to a potential base-building process underway.
What’s Happening With MANTRA (OM)’s Price?
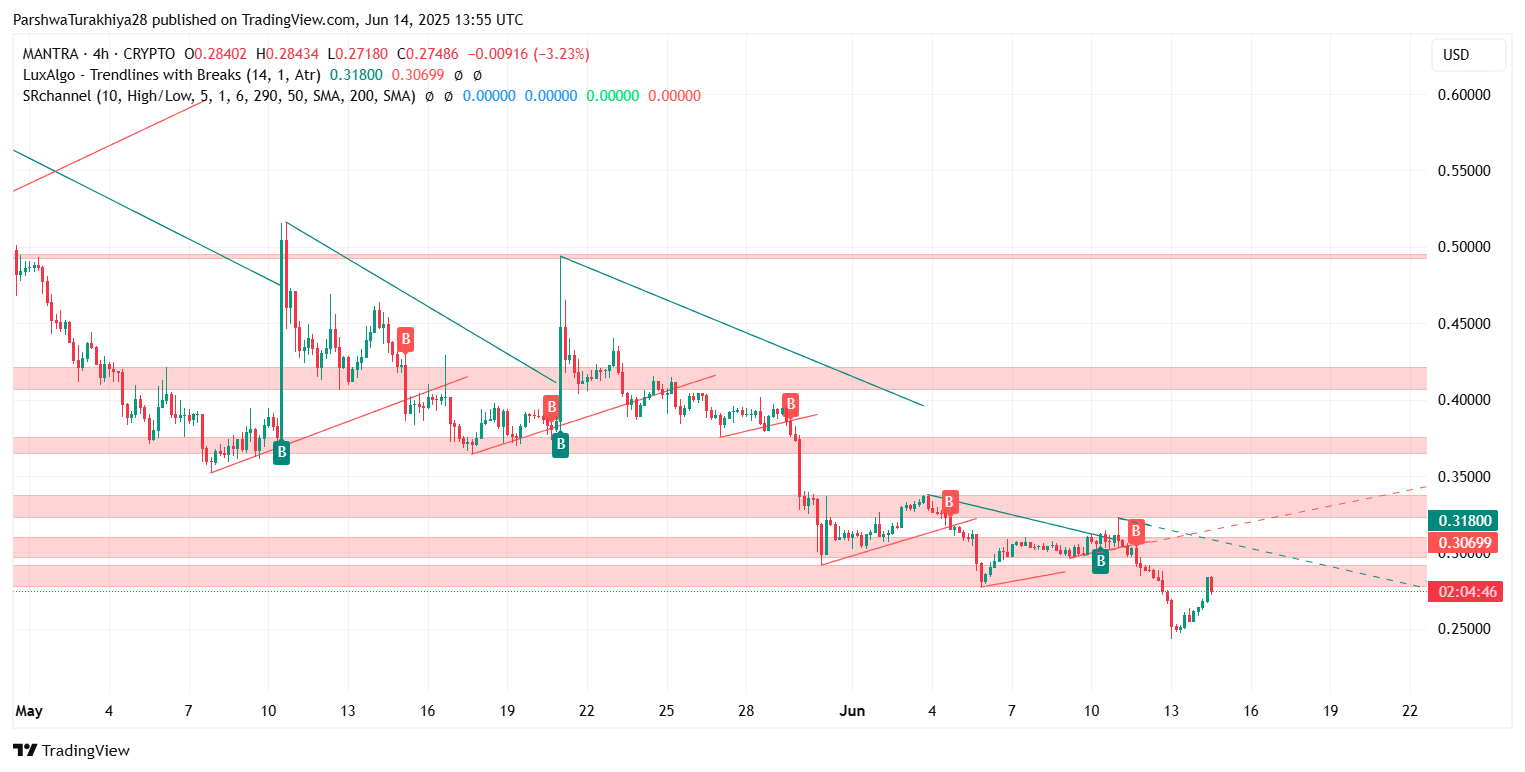
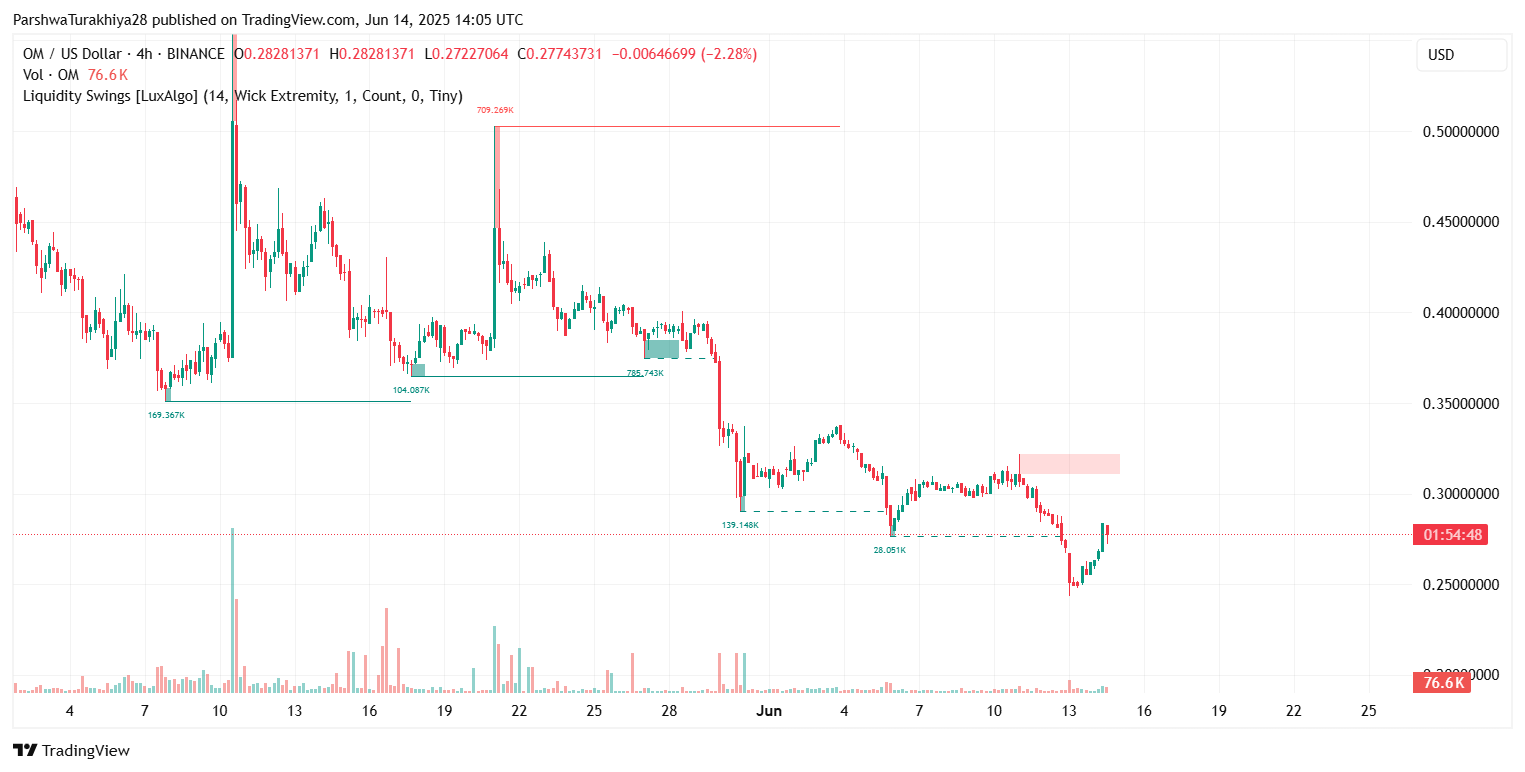
The MANTRA (OM) price action witnessed a steep drawdown in late May and early June, driven by a confluence of breakdowns below key trendline support and intensified profit-taking. A strong bearish impulse on June 11 dragged the token to $0.243, marking a 2-month low. However, the recent bounce has brought OM back into the $0.275–$0.280 supply zone, suggesting early signs of strength.
The 4-hour chart shows price breaking above a descending wedge pattern, with the most recent candle pushing toward the $0.282–$0.285 resistance shelf. This area overlaps with previous order blocks and value area highs from early June, making it a decisive zone for bulls to conquer in the short term.
Key Indicators Reflect Short-Term Recovery Potential
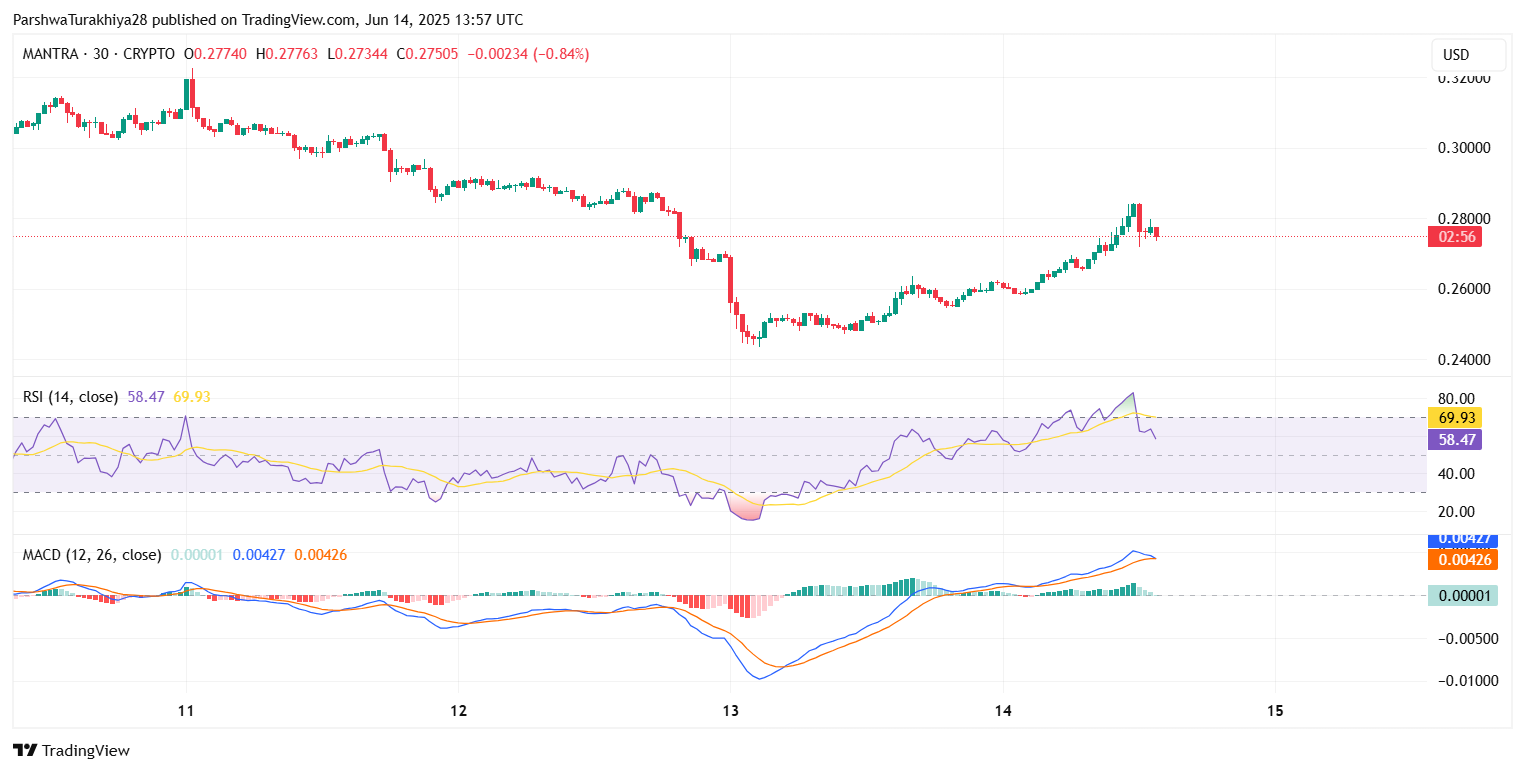
On the momentum front, the RSI on the 30-minute timeframe sits at 58.47, retreating slightly from the overbought 69.93 level earlier in the day. This signals a healthy cooldown after an impulsive rise. Meanwhile, the MACD shows a bullish crossover with both signal and MACD lines holding above zero, supporting the view of upward momentum.
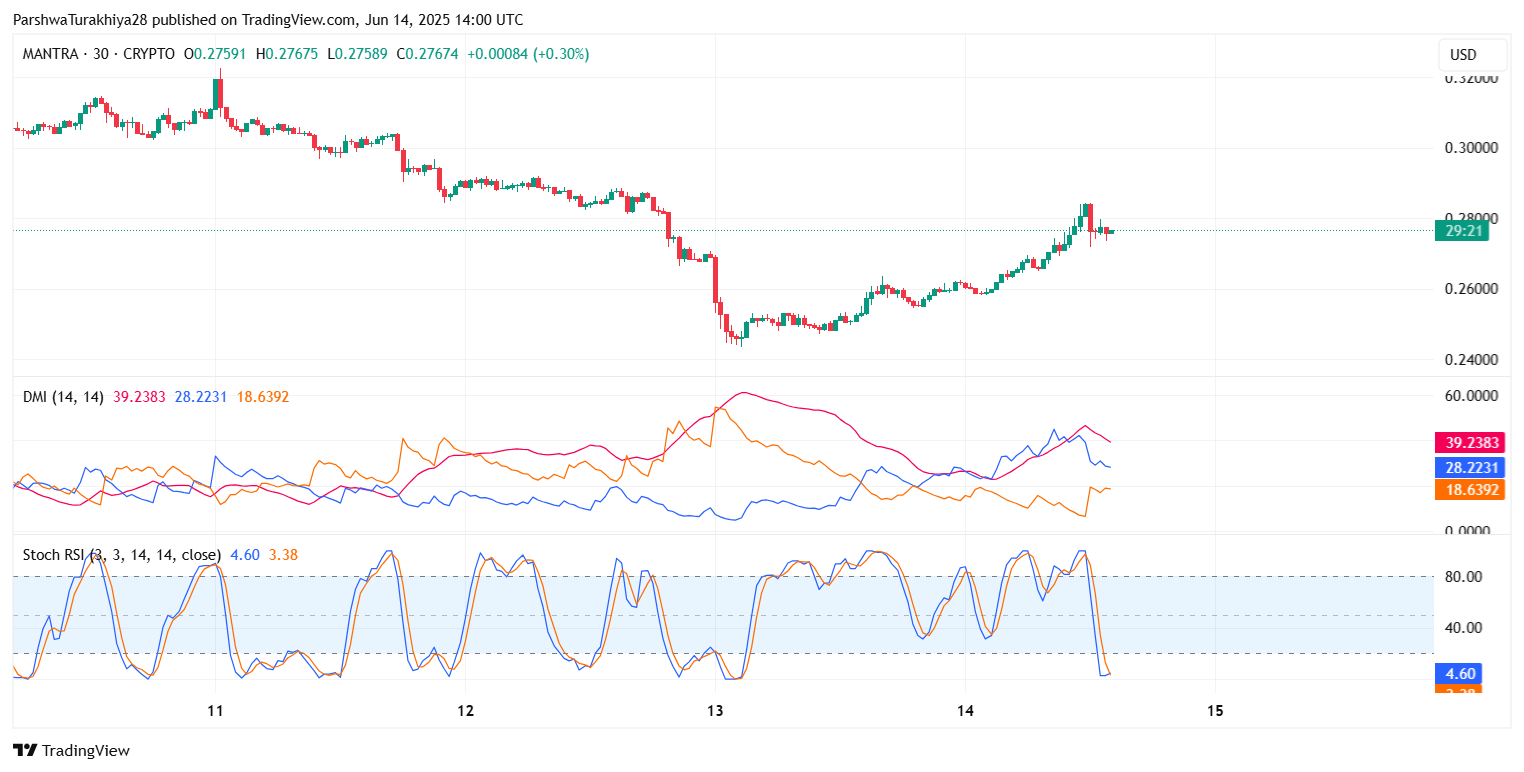
The Directional Movement Index (DMI) adds weight to this thesis, with the +DI line (39.2) maintaining an edge over the -DI (28.2), although ADX at 18.6 indicates moderate trend strength. The Stochastic RSI, however, has curled back to 4.6, signaling potential short-term exhaustion.
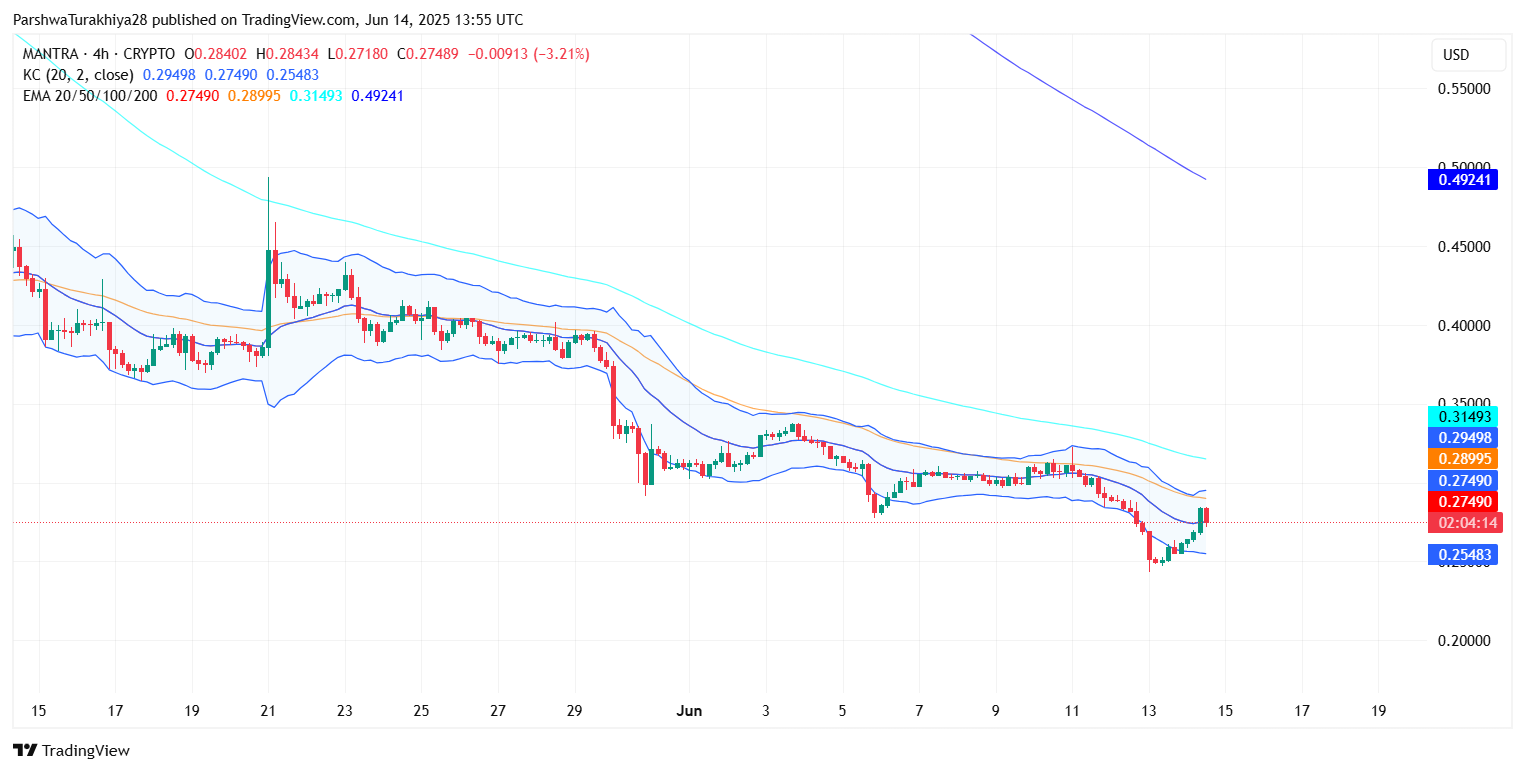
From a volatility standpoint, the Bollinger Bands and Keltner Channels on the 4-hour chart are beginning to expand after a tight consolidation, and the price is trading at the upper band, a typical condition during MANTRA (OM) price spikes.
Smart Money Concepts and Volume Insights

Looking at the Smart Money Concepts overlay, OM has reclaimed structure following a short-term BOS (Break of Structure) above $0.27, after printing multiple CHoCH (Change of Character) zones earlier this week. Volume indicators like the Volume Profile and Liquidity Swings reveal that the most recent bounce attracted meaningful buy-side pressure around the $0.250–$0.260 range.
The Chaikin Money Flow (CMF) currently reads -0.09, slightly bearish, though an upward reversal would align with bullish continuation. Moreover, the 4-hour liquidity map shows uncollected sell-side liquidity pockets near $0.295 and $0.303 that could act as near-term magnets if upward momentum builds.
Why is the MANTRA (OM) Price Going Up Today?
The bounce in MANTRA (OM) price today appears to be fueled by technical oversold conditions aligning with value area support. The reclaim of the lower liquidity band at $0.243, coupled with the re-entry into a prior high-volume node near $0.275, triggered algorithmic accumulation.
Additionally, broader altcoin recovery across mid-cap DeFi tokens may be contributing to sector-specific inflows, amplifying MANTRA (OM) price volatility.
Short-Term Outlook and Key Levels to Watch
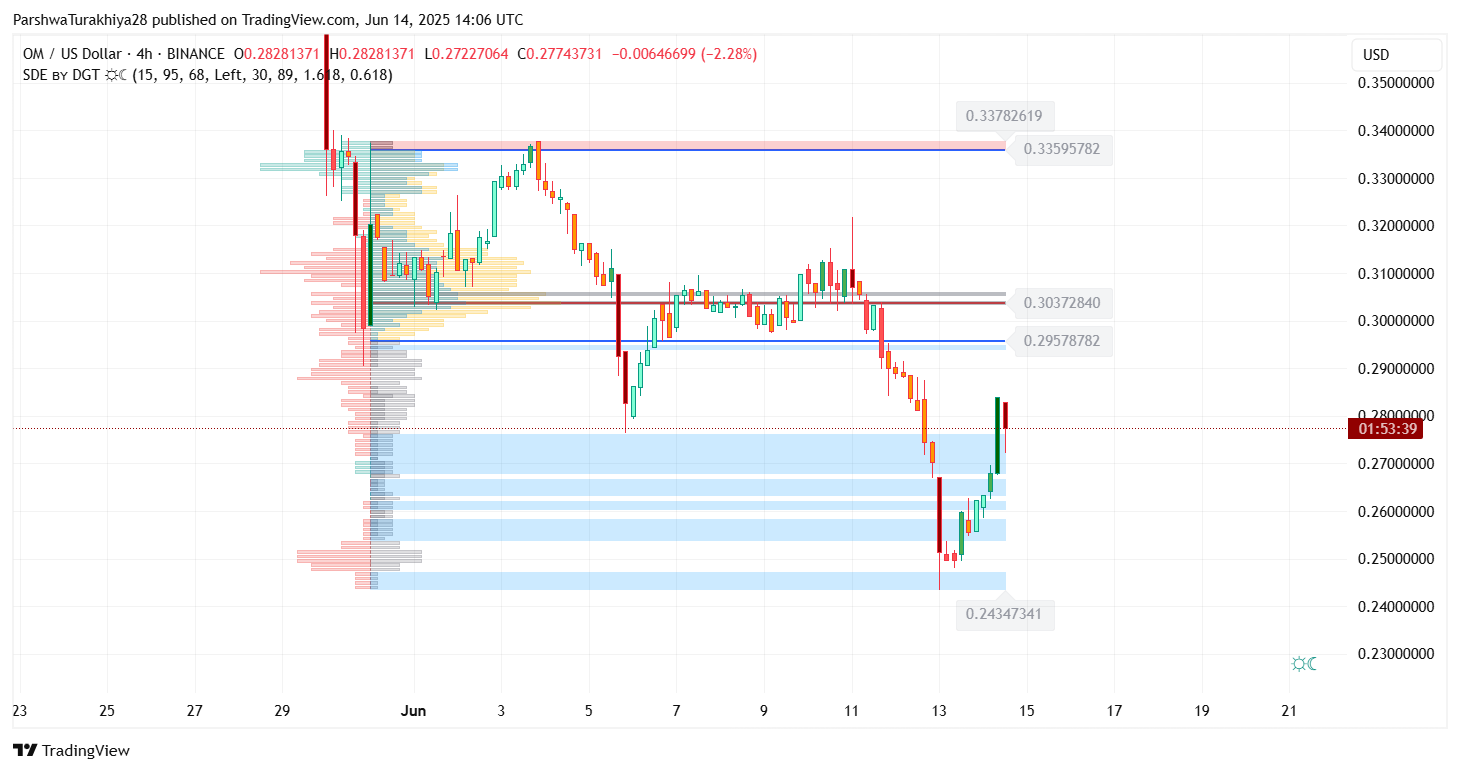
While short-term signals are constructive, bulls still face stiff resistance at $0.285 and $0.295. A daily close above $0.303 would shift structure to the upside and open up the path toward the $0.335–$0.337 cluster, where prior breakdowns originated.
Support now lies at $0.265, followed by $0.243. If this zone breaks again, a revisit of the high-volume node near $0.225 is possible.
Technical Forecast Table
| Level | Description |
| $0.243 | Key support and recent low |
| $0.265 | Intraday support floor |
| $0.285 | Short-term resistance ceiling |
| $0.303 | Structural breakout threshold |
| $0.337 | Liquidity + volume confluence |
| RSI | 58.47 (neutral-bullish) |
| MACD | Bullish crossover above zero |
| DMI | +DI > -DI, ADX at 18.6 |
| CMF | -0.09, showing modest outflow |
While the MANTRA (OM) price remains under macro pressure, recent price behavior suggests a tactical rebound is in motion. Sustained bids above $0.275–$0.285 could validate a trend reversal heading into the second half of June.
Disclaimer: The information presented in this article is for informational and educational purposes only. The article does not constitute financial advice or advice of any kind. Coin Edition is not responsible for any losses incurred as a result of the utilization of content, products, or services mentioned. Readers are advised to exercise caution before taking any action related to the company.