Two key market signals – a price reversal in gold and a recurring historical pattern in Bitcoin’s chart, are leading analysts to forecast that the crypto market could be preparing for its next major upward movement. The analyses suggest that despite the latest consolidation, underlying technical structures are pointing to a bullish future for both Bitcoin and the broader altcoin sector.
I've mentioned this before.
— Michaël van de Poppe (@CryptoMichNL) June 13, 2025
Gold breaking upwards = #Altcoins breaking downwards, independent of news.
Gold broke a crucial level upwards and is currently consolidating.
If it breaks south of $3,400, that would be the signal for altcoins to start moving heavily again. pic.twitter.com/2mDAdkeUME
Related: Is This the Perfect Time for Altcoins? Expert Predictions on the Next Crypto Move
Reversal in Gold Price Could Be a Bullish Trigger for Altcoins
Gold recently broke through a key resistance level but is now consolidating just below $2,400. The asset cleared liquidity above two prior highs, often a precursor to trend reversals. Chart annotations highlight that gold must stay above the $2,330 to $2,335 zone to maintain its bullish structure.
The chart also shows a bearish divergence between the Relative Strength Index (RSI) and price action. Despite higher highs in price, momentum appears to be weakening, raising caution over sustained upside. However, volume has not confirmed the recent rally, and a break below the pink-shaded consolidation area could solidify a bearish trend.
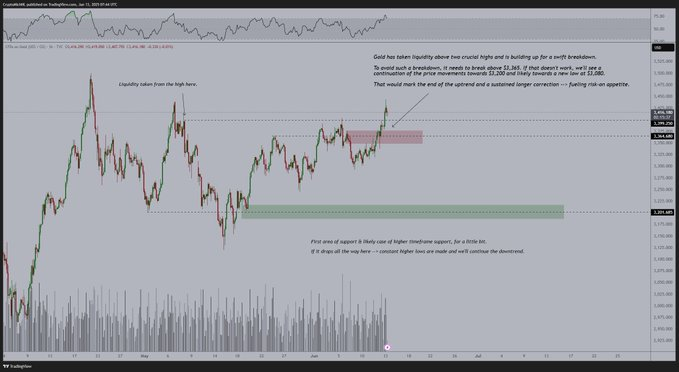
Van de Poppe stated that if gold crosses the $3,400 threshold on the downside, it would likely mark the end of its uptrend and potentially revive interest in riskier assets like altcoins.
Bitcoin’s Chart Is Repeating a Historically Bullish “Wedge” Pattern
In a separate analysis, another trader known as 𝕄𝕠𝕦𝕤𝕥𝕒𝕔ⓗ𝕖 shared long-term Bitcoin data illustrating a recurring bullish pattern. His chart shows multiple instances of descending broadening wedges forming between 2019 and 2025. These structures, defined by two downward-sloping trendlines that gradually widen, have historically preceded major price rallies.
#Altcoins
— 𝕄𝕠𝕦𝕤𝕥𝕒𝕔ⓗ𝕖 🧲 (@el_crypto_prof) June 13, 2025
So far it's just a retest.
As I have said many times before, such dips are for buying.
Whenever the Totalmarket ap has formed such patterns in recent years, the market has risen sharply afterwards.
Is it different this time? I don't think so. pic.twitter.com/LsnD4MR33z
The 2019 and 2023 breakouts from similar wedges led to rapid market gains. A nearly identical formation emerged in 2024 and now appears to be developing again in 2025. Each breakout was marked by yellow circles indicating reversal points. An inset diagram on the chart provides a schematic view of the wedge’s typical breakout behavior.
Related: Gold Eyes All-Time High While Altcoins Correct: Is the Crypto Rally on Hold?
This sequence of patterns suggests Bitcoin is in the later stages of another broadening wedge formation. If the structure resolves in line with previous cycles, it could mark a key turning point for crypto markets heading into 2025.
Disclaimer: The information presented in this article is for informational and educational purposes only. The article does not constitute financial advice or advice of any kind. Coin Edition is not responsible for any losses incurred as a result of the utilization of content, products, or services mentioned. Readers are advised to exercise caution before taking any action related to the company.