- Bitcoin recovers slightly from support tested at $102,513 as global markets react to tensions between Israel and Iran.
- BTC derivatives market liquidations surge, hitting $446 million in the last 24 hours as Open Interest drops below $70 billion.
- Ethereum extends losses but holds above the 200-day EMA as the spot ETF net inflow streak holds steady.
- XRP downside risks escalate, accelerating the decline toward the $2.09 support level.
The cryptocurrency market has been hit by a sudden wave of extreme volatility, triggering widespread declines as global markets react to tensions between Israel and Iran. Bitcoin (BTC) is hovering at around $104,668 at the time of writing on Friday, following a reflex recovery from support tested at $102,513.
Altcoins were not spared, with Ethereum (ETH) amplifying losses and testing a lower range limit support around $2,500. Meanwhile, Ripple (XRP) holds slightly above the critical $2.09 support as bulls navigate the highly volatile market.
Market overview: Israel-Iran tensions create instability
Israel launched a wide-scale strike against Iran on Friday, citing targeted nuclear facilities, ballistic missile factories and military commanders. According to Israeli Prime Minister Benjamin Netanyahu, as reported by Reuters, the attack is to prevent Iran from building an atomic weapon, which puts the lives of his people at risk.
Iran responded to that attack with around 100 retaliatory drones targeting Israeli territory. Israel has been working to intercept Iranian drones, declaring a state of emergency in preparation for further escalation.
The world is on alert with global markets, including crypto, hit by intense volatility. Widespread declines have been witnessed across the board, with the total crypto market share falling by nearly 3% to $3.4 trillion from $3.5 trillion on Thursday, according to CoinGecko.
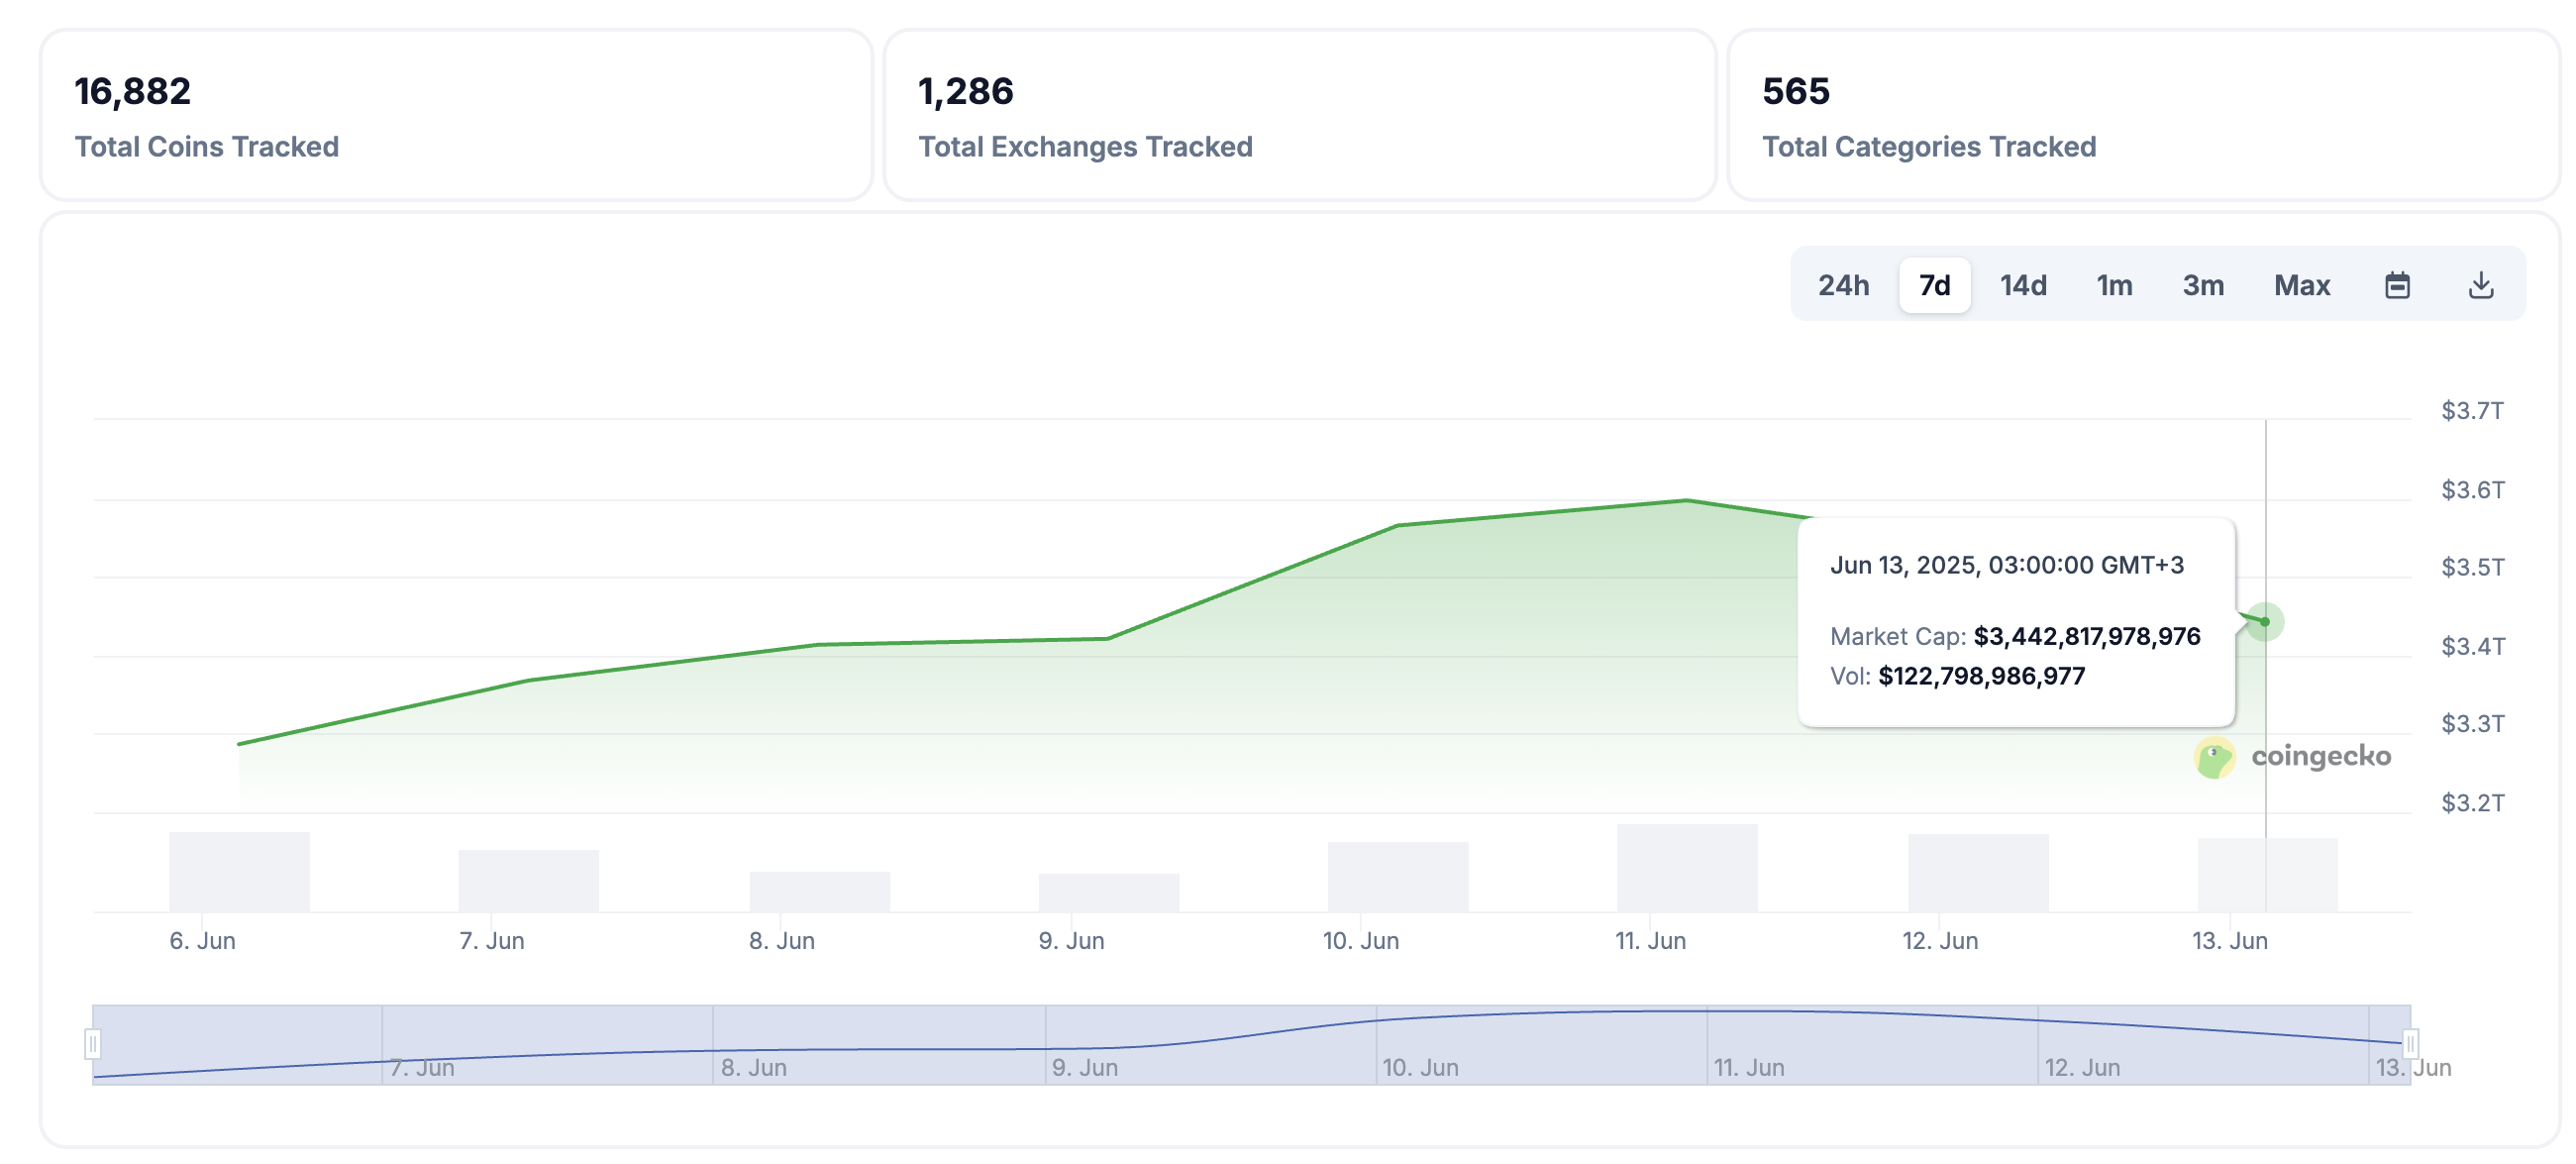
Crypto market capitalization | Source: CoinGecko
Data spotlight: Bitcoin, Ethereum spot ETF inflows shrink
Interest in Bitcoin-related financial products, such as spot Exchange Traded Funds (ETFs), has declined over the last few weeks compared to the days leading up to the all-time high of $111,980, reached on May 22.
SoSoValue data shows that spot BTC ETFs recorded approximately $86 million in daily total net inflows on Thursday, down from $165 million posted on Wednesday and $431 million that streamed in on Tuesday.
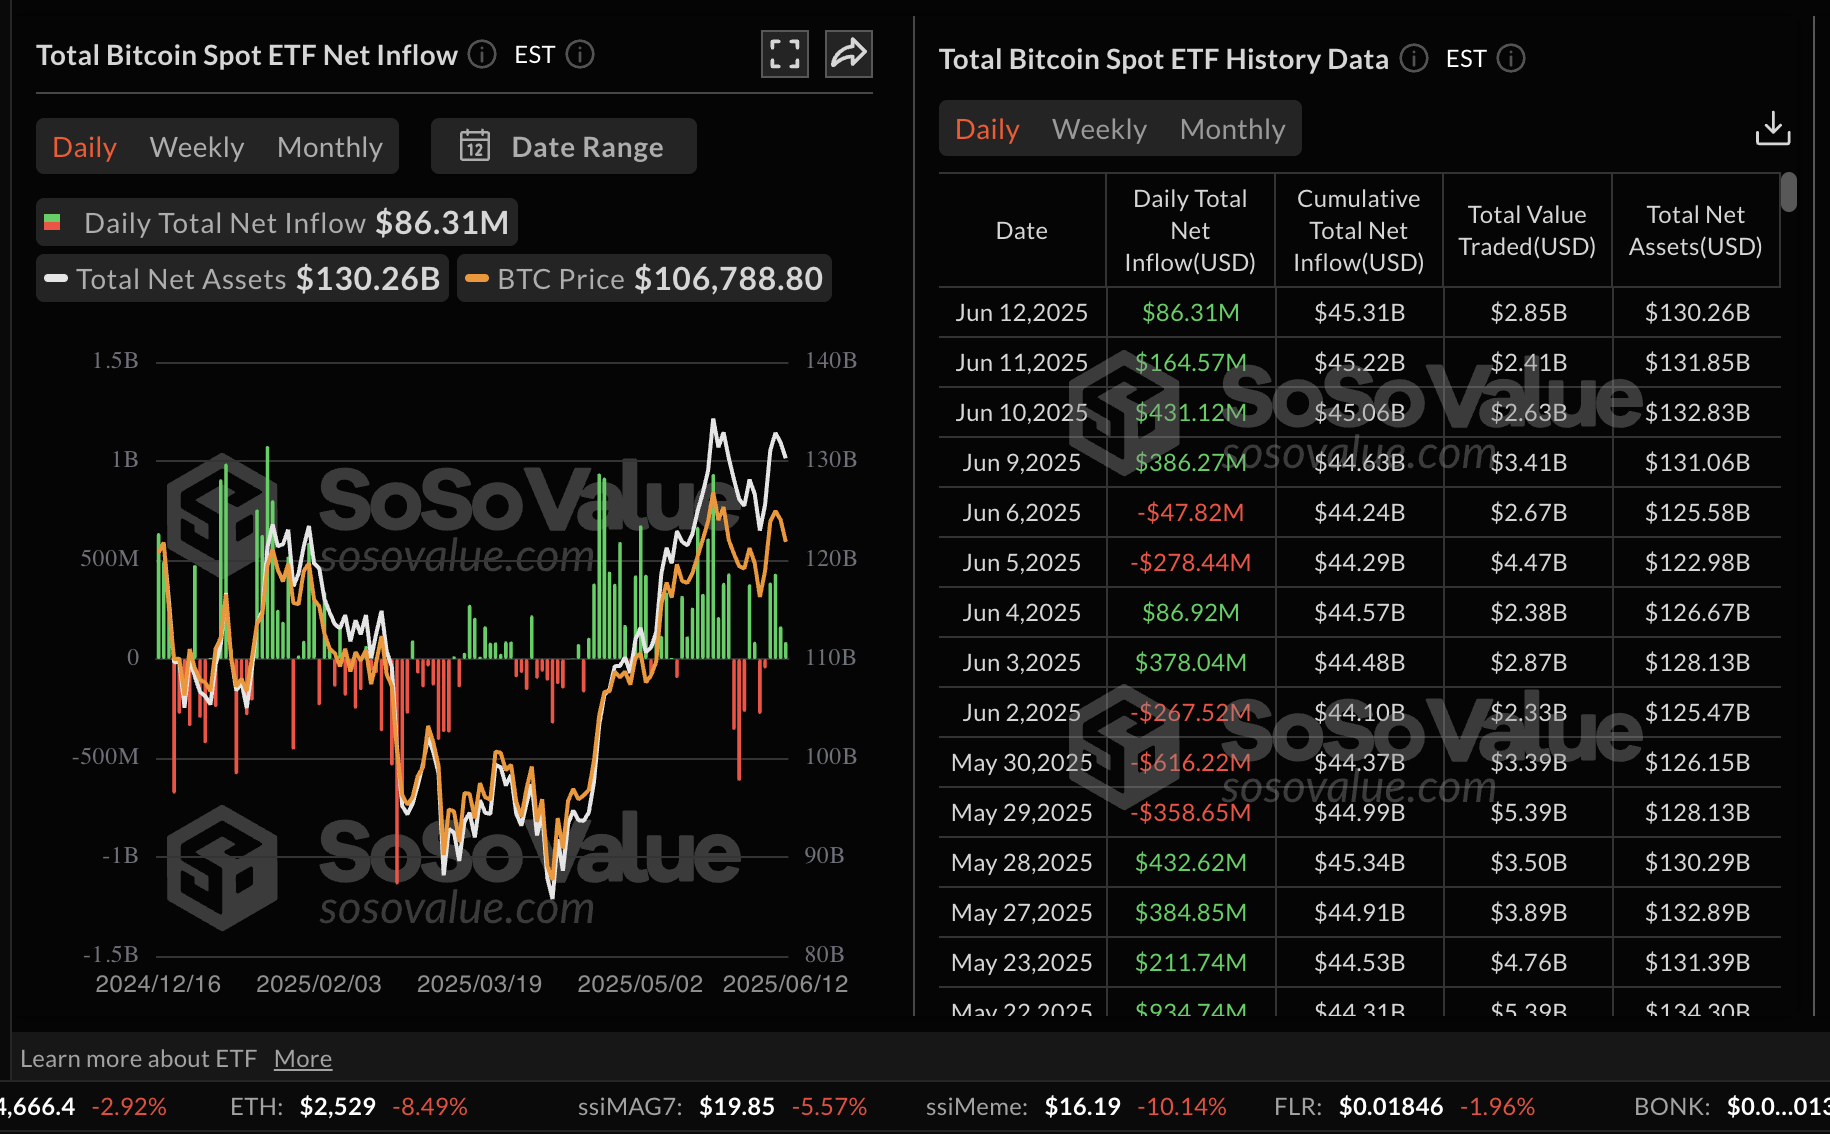
Bitcoin spot ETF stats | Source: SoSoValue
On the other hand, inflows into Ethereum spot ETF products declined by more than half, reaching $112 million on Thursday compared to $240 million in net inflow volume on Wednesday. Unlike Bitcoin, interest in Ethereum spot ETF products remains relatively high, with the net inflow extending for 19 consecutive days.
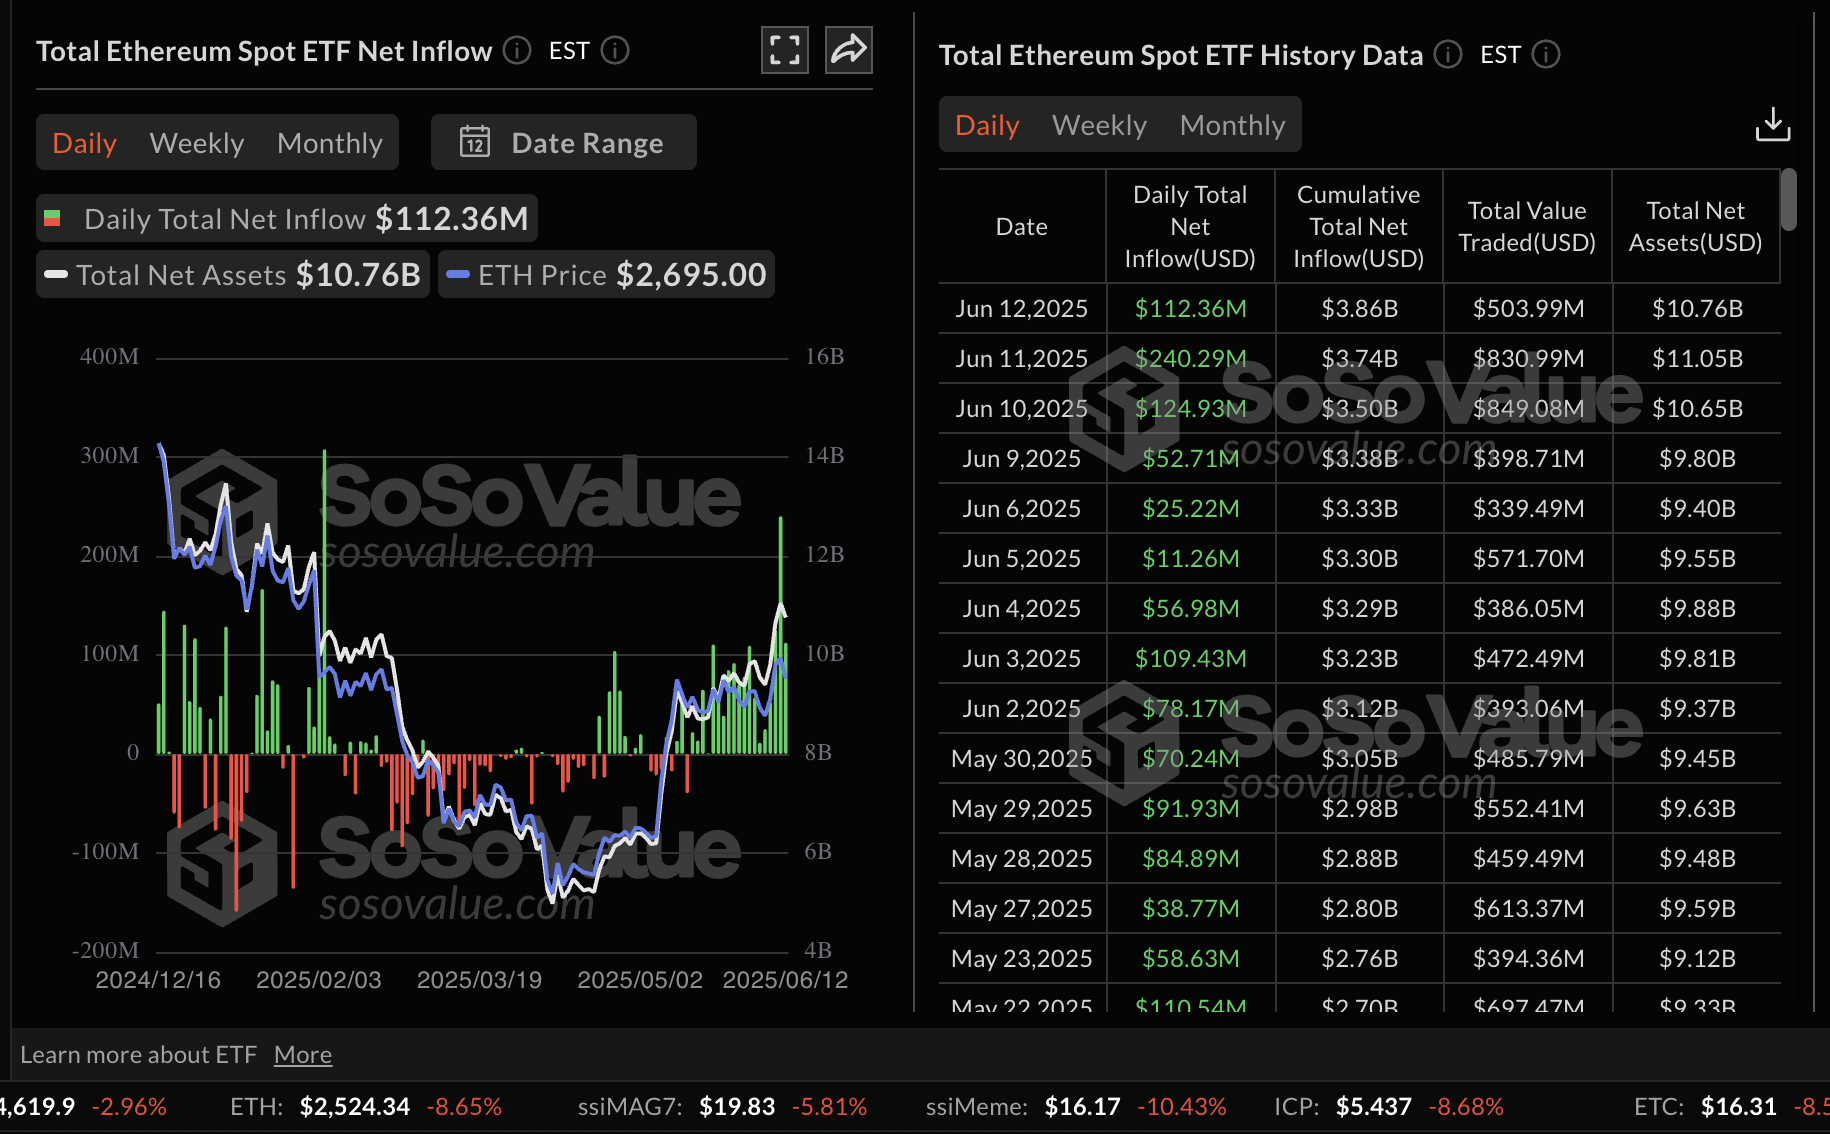
Ethereum spot ETF stats | Source: SoSoValue
The sudden drop in prices has left investors rattled while traders navigate a hostile climate, especially in the derivatives market. Bitcoin experienced a significant spike in liquidations, with long-position traders bearing the brunt of the losses.
The CoinGlass chart below highlights that over $446 million was wiped out in the last 24 hours as volatility intensified. Long position liquidations accounted for the lion’s share at $423 million, with only $23 million in shorts liquidated.
Bitcoin derivatives data analysis indicates a 4.6% decline in Open Interest (OI) to $69.8 million. However, the trading volume surge to $135 million, representing a 54% increase, signals short positions covering and forced liquidations.
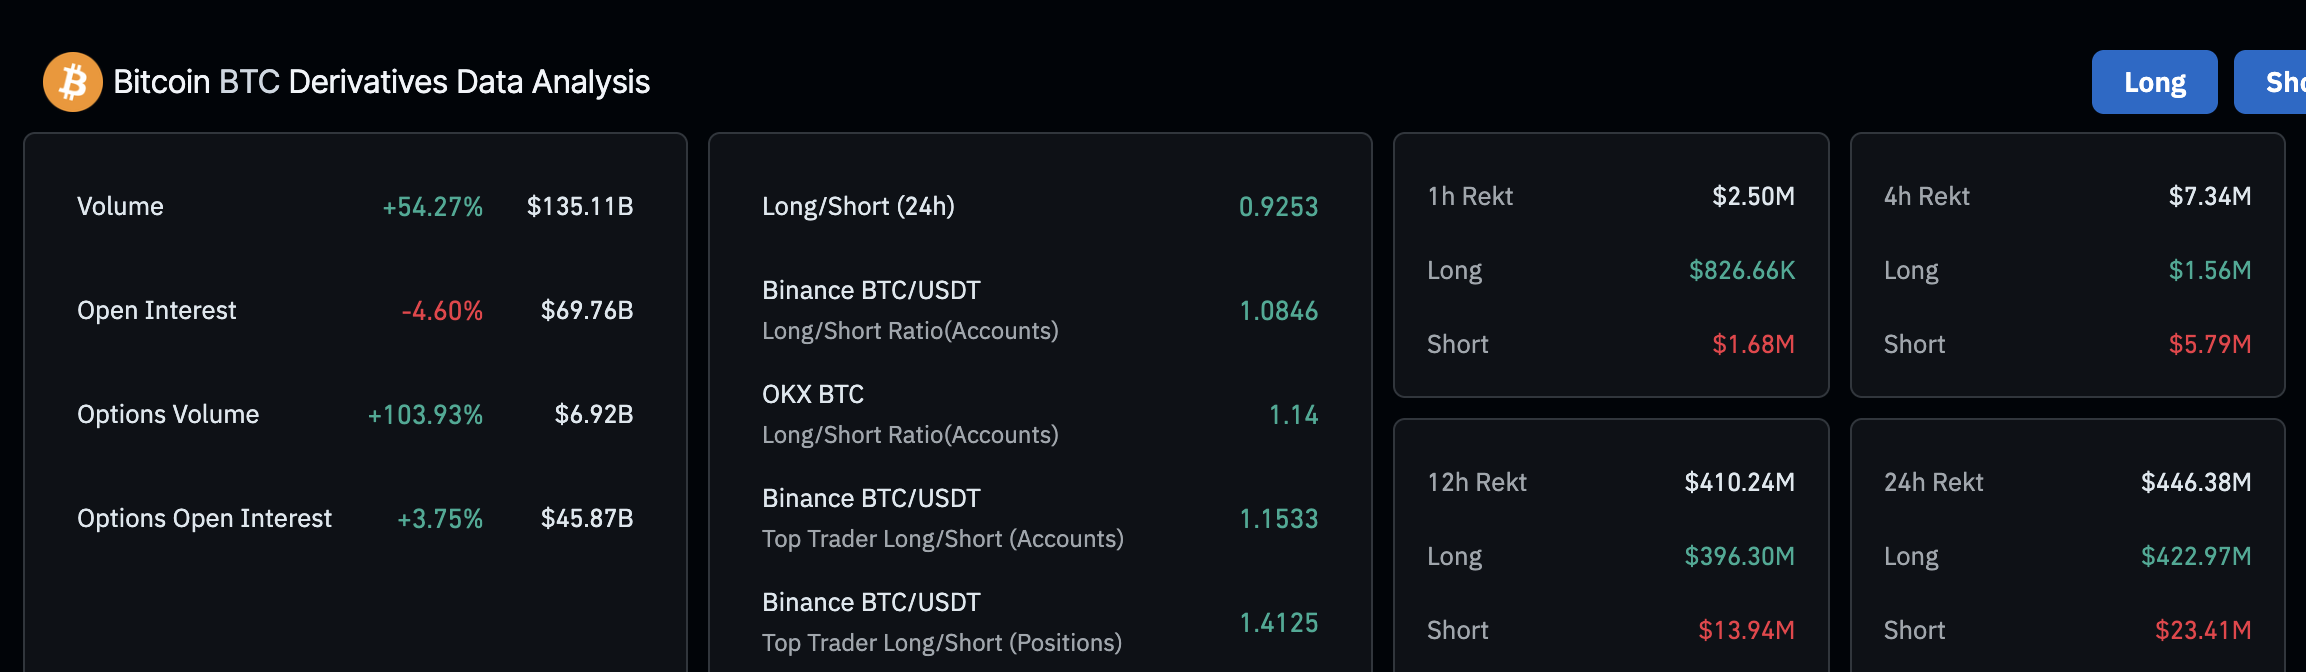
Bitcoin derivatives market stats | Source: CoinGlass
Chart of the day: Bitcoin eyes a short squeeze rebound
Bitcoin’s price hovers slightly above $105,000 at the time of writing, marking a 2.5% recovery from support tested at $102,513, as highlighted by the 50-day Exponential Moving Average (EMA).
The recovery could continue into the weekend as traders buy BTC to cover their positions. Therefore, a daily close above the immediate $105,000 support could reduce potential downside risks, paving the way for gains toward the resistance at $110,000, which is approximately 5% above the current level.
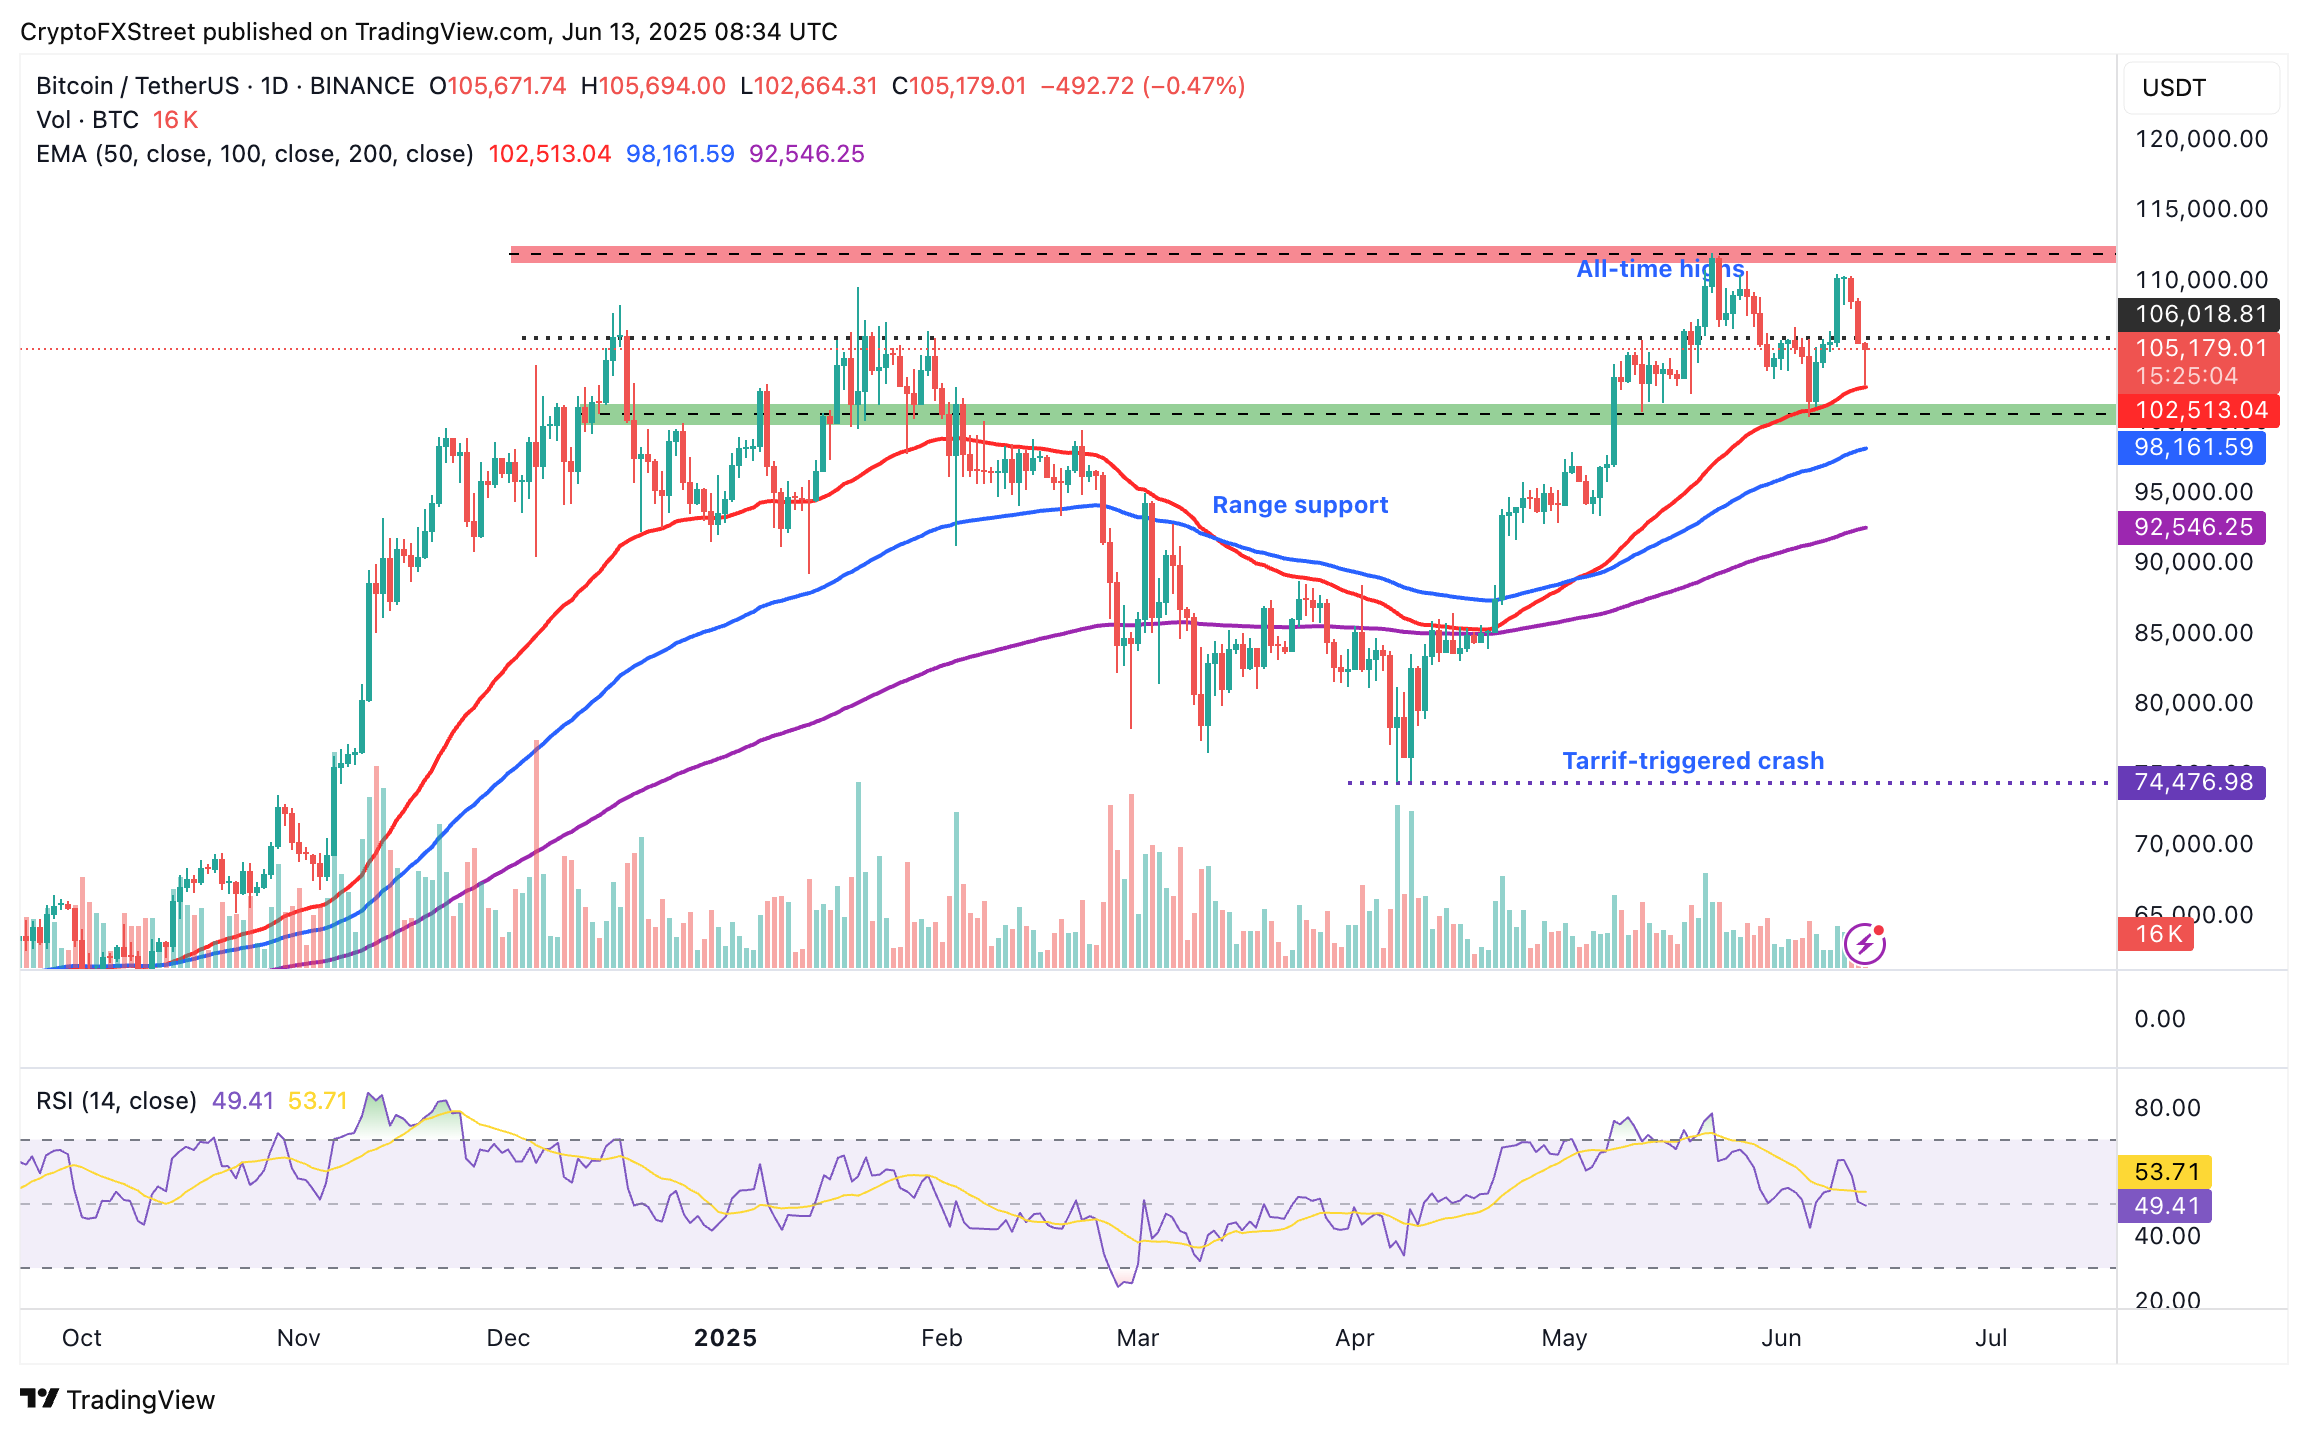
BTC/USDT daily chart
Still, Bitcoin’s vulnerability to geopolitical tensions between Israel and Iran cannot be ignored, especially with the Relative Strength Index (RSI) slipping below the 50 midline, indicating increasing bearish momentum. Key levels of interest on the downside include the 50-day EMA support at $102,513, the 100-day EMA at $98,161 and the 200-day EMA at $92,546.
Altcoins update: Ethereum and XRP show downside vulnerability
Ethereum’s price is testing support at the lower level of the consolidation range, around $2,500. The 200-day EMA reinforces the support holding at $2,473, while the 100-day EMA sits at $2,351.
The RSI downtrend slightly below the midline reinforces the bearish grip on the ETH price. If traders reduce exposure, citing intense volatility, the price could drop further, pulling the RSI toward the oversold region.
However, since the range support at $2,500 is still intact, a recovery could ensue, allowing Ethereum’s price to close the gap to the recent peak of $2,881, reached on Wednesday.
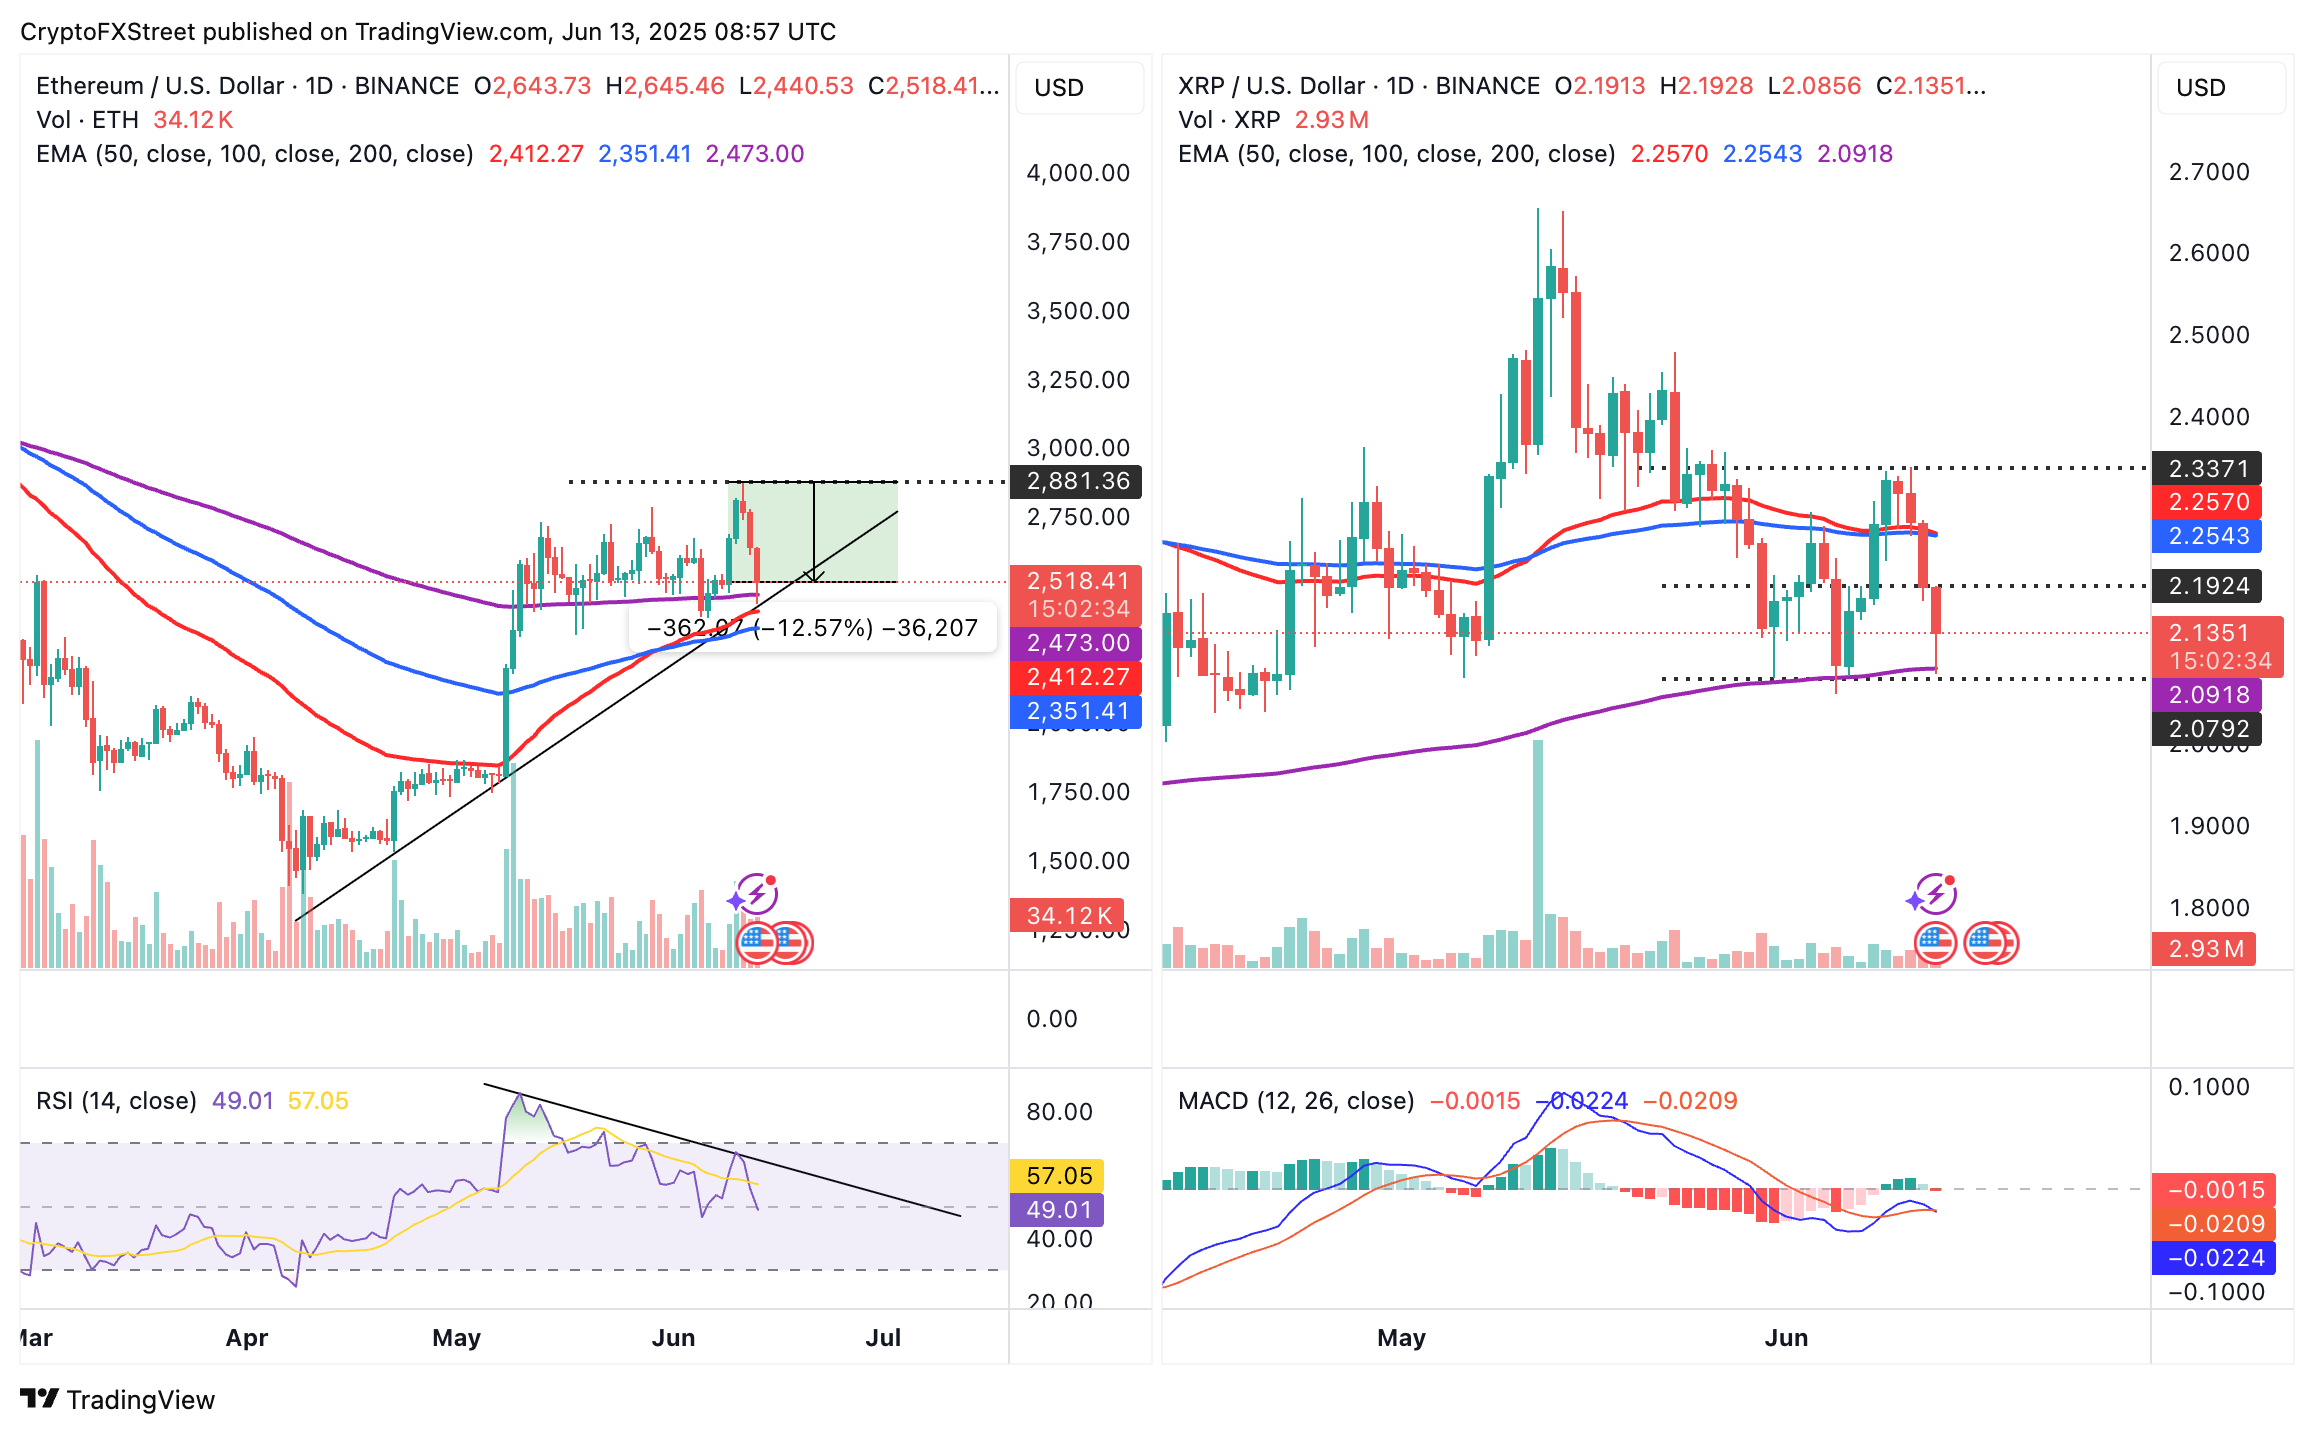
ETH/USDT & XRP/USDT daily charts
On the other hand, XRP hovers at around $2.13 at the time of writing, with losses approaching 5% on the day. The path of least resistance could stay downward, underpinned by a sell signal from the Moving Average Convergence Divergence (MACD) indicator on the daily chart. This signal, confirmed on Friday when the blue MACD line crossed below the red signal line, could make XRP shorts attractive. Thereby accelerating sell-side pressure.
Support at $2.09, highlighted by the 200-day EMA, remains critical to XRP. If broken, the downtrend could extend below $2.00 and potentially bring April lows of $1.61 into sight.