TRON (TRX) price is experiencing a sharp pullback after an impressive rally that recently took it near the $0.30 mark. As of now, TRX price is trading around $0.273 on the hourly chart and $0.271 on the daily chart, reflecting a loss of bullish momentum. This correction comes after price rejection near resistance levels and a breakdown below short-term moving averages. But is this a healthy retracement or the start of a deeper decline?
Tron Price Prediction: Is the Rebound Attempt Strong Enough?
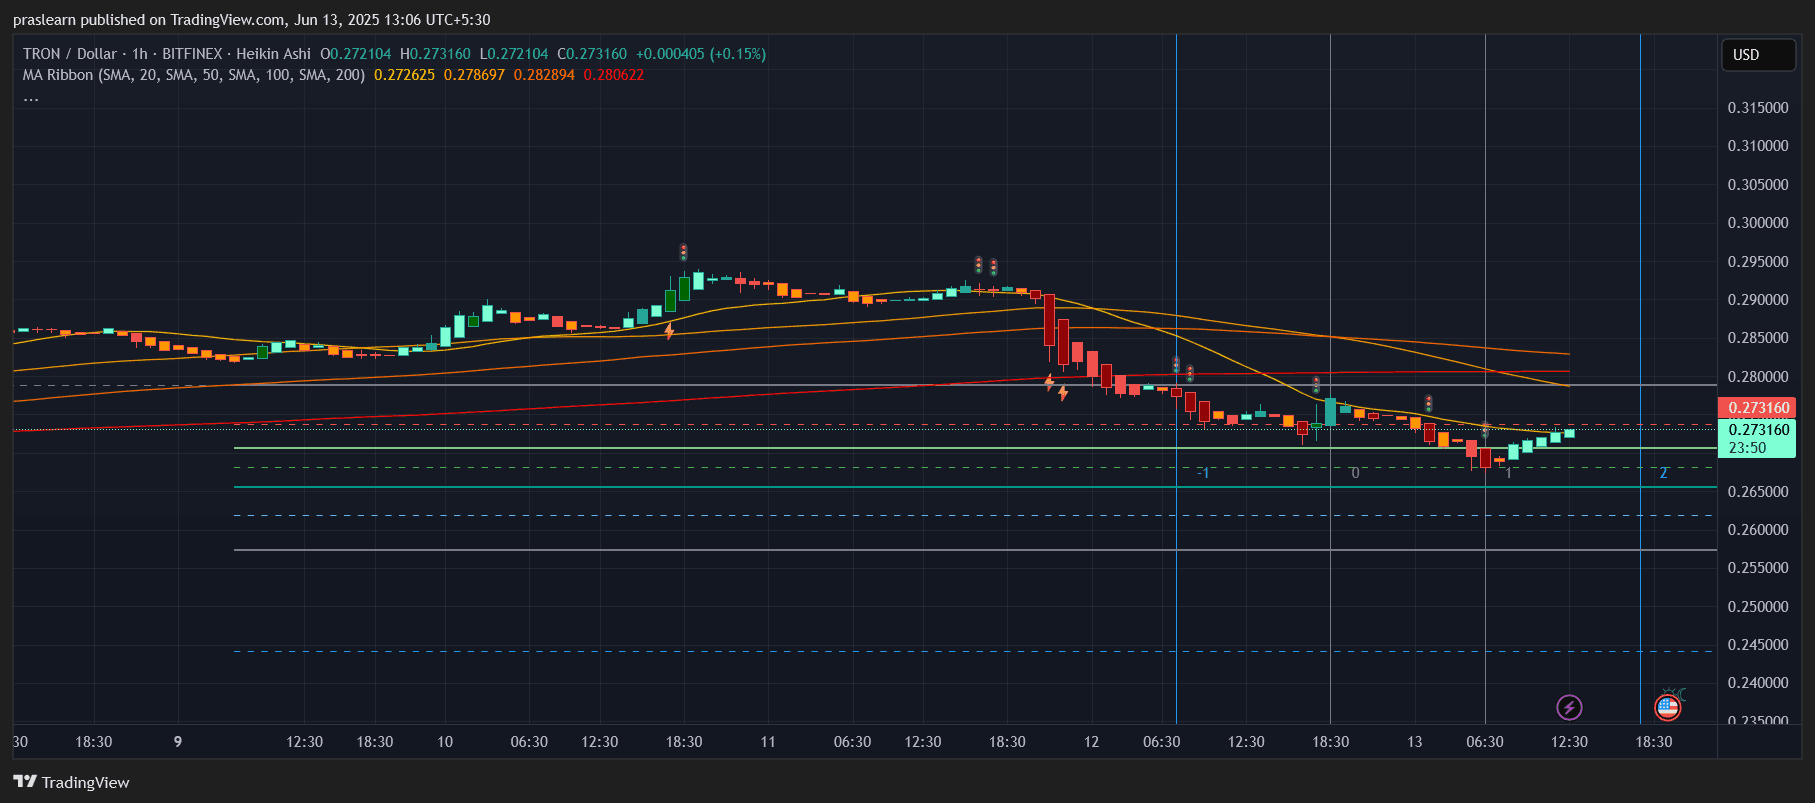
The 1-hour Heikin Ashi chart shows that TRX price dropped significantly from $0.29 to a recent low near $0.265, followed by a weak bounce to $0.273. The price remains below the 20, 50, and 100-period SMAs, which cluster near $0.278–$0.282, creating a heavy resistance zone. This cluster is acting as a “ceiling,” capping any short-term upside attempts.
TRX briefly showed a bullish engulfing pattern near the $0.265 support, which triggered a few green candles, but volume remained subdued. For a real bounce to occur, TRX must reclaim $0.278 quickly. Until then, this recovery looks like a dead cat bounce rather than a bullish reversal.
A Fibonacci retracement from the local high of $0.29 to the low of $0.265 shows the 38.2% level at $0.274 and the 50% level near $0.278—precisely where the SMAs are pressing down. Unless Tron price breaks above these with strong volume, further downside to $0.260 is likely.
Daily Chart: Was the Rally Overextended?
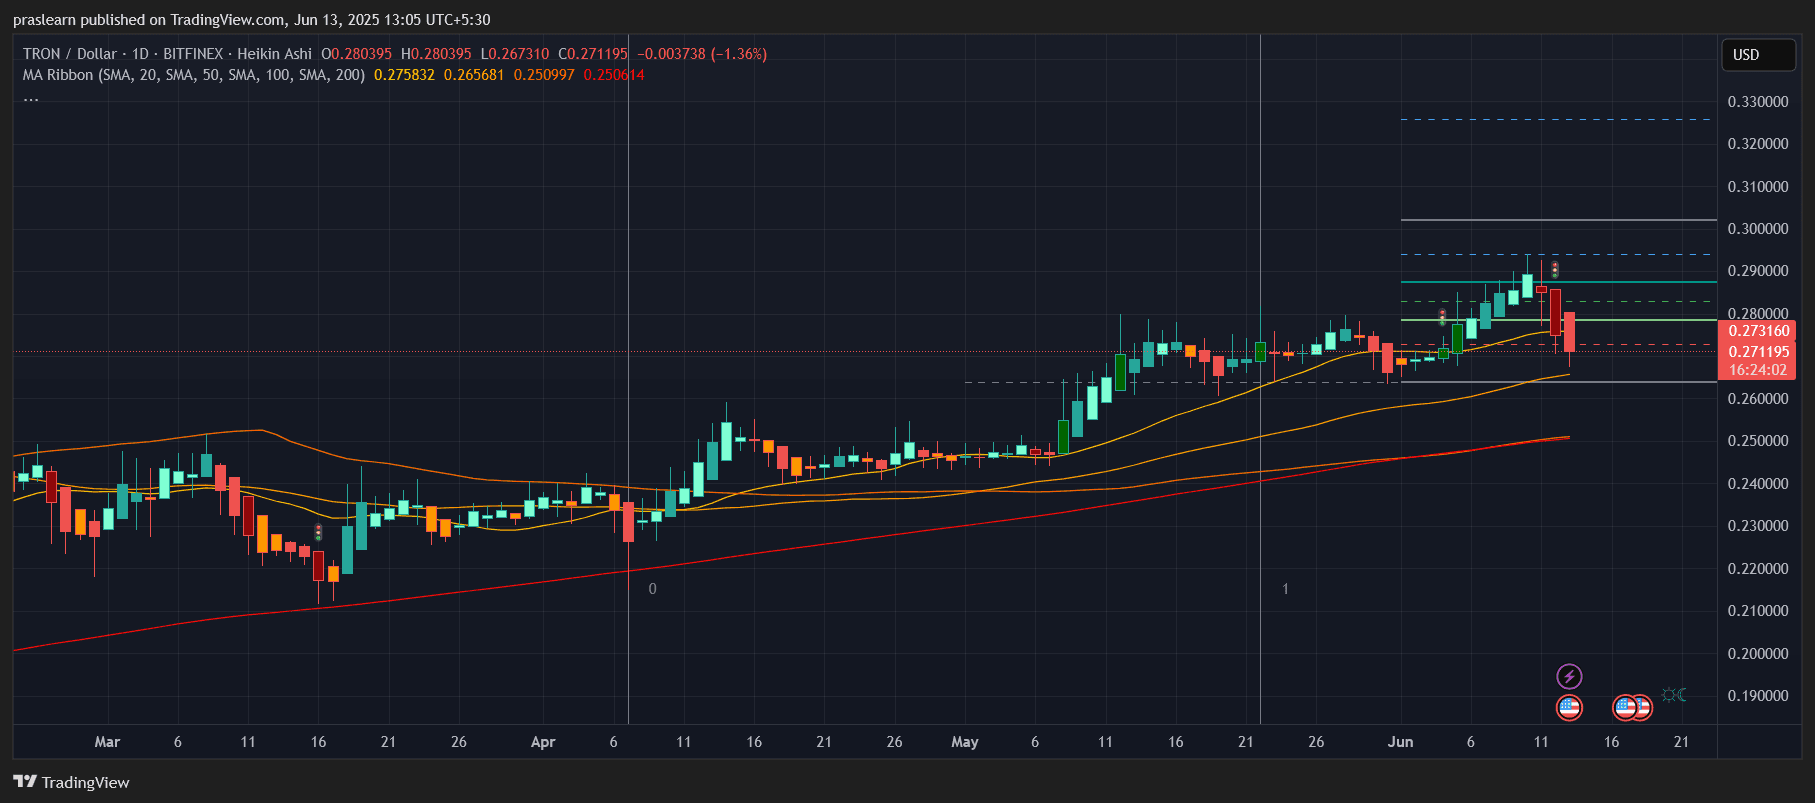
The daily chart puts things in perspective. After a strong uptrend from $0.24 to $0.29 in early June, TRX price faced rejection at the $0.295–$0.300 resistance zone. The red candle on June 12 was a clear bearish engulfing pattern, signaling a trend reversal. Price is now testing the 50-day SMA around $0.266, a key support level.
Tron price had been riding above its 20-day and 50-day moving averages for several weeks, indicating bullish momentum. But with the breakdown below the 20-day SMA ($0.2758), the sentiment has clearly shifted. If TRX closes below the 50-day SMA, we could see a move toward $0.250 in the coming sessions.
However, if buyers defend $0.265 successfully and reclaim $0.280 in the next few days, the structure of the uptrend might remain intact. The RSI on the daily chart has dipped but is still above the oversold zone, suggesting there’s still time for bulls to regroup.
Is TRON Price Still in a Bull Market?
Let’s consider some quick math. TRX price has corrected about 6.5% from its recent high of $0.29 to $0.271. In past cycles, TRX typically pulls back 8–12% after a strong rally before resuming upward. A 10% correction from $0.29 would bring it to $0.261—a level very close to the 50-day SMA.
So if $0.261–$0.265 holds, Tron price could stabilize and resume its uptrend. But if that zone breaks, the price could dive another 5% toward $0.250, where the 100-day SMA sits.
What’s the Tron Price Prediction for This Week?
If TRX price breaks and holds above $0.278, the first bullish target is $0.285 and then a retest of $0.295. On the flip side, if it drops below $0.265, the next key support is $0.250. This week will be critical as Tron price decides whether to form a higher low and continue the uptrend—or sink into a bearish phase.
Given the current technical setup, the probability of sideways consolidation between $0.265 and $0.280 is higher unless a macro catalyst pushes crypto prices broadly.
Conclusion: Buy the Dip or Wait It Out?
Traders should watch the $0.265–$0.280 range closely. A clean breakout above $0.280 with volume would confirm bullish strength, while a breakdown below $0.265 may invite more selling pressure. For now, TRON price looks like it's entering a consolidation phase after an overheated rally. A clear direction should emerge in the next 48 hours.
$TRX, $Tron