XRP’s recent price action is stirring bullish hopes among traders, as a veteran crypto analyst has identified a historical price pattern, or “fractal,” that mirrors the setup preceding XRP’s massive 2017 bull run. The analysis suggests that despite a slow recovery, XRP may be in a long-term accumulation phase, coiling for a significant future rally.
The analysis comes from veteran trader Pepa, who is known for his early calls in previous XRP cycles. Currently trading near $2.24, XRP has been consolidating, but the underlying macro chart structure is now the focal point for long-term bulls.
Veteran Trader Pepa Predicts $XRP Next Target at $23.94 Based on This Historical Formation.🧵🧵🧵 pic.twitter.com/ex81FXiSjp
— TheCryptoBasic (@thecryptobasic) June 12, 2025
Is XRP Repeating Its 2014–2018 Bull Cycle Pattern?
Pepa has identified a recurring price pattern that according to his three-week forecast, XRP’s breakout above a long-standing descending trendline resembles its 2017 structure, when the coin rocketed from $0.004 to $3.4.
He argues a similar pattern has formed since the 2018 peak, with a new breakout in November 2024 pushing XRP back to $3.4 by January 2025. Currently trading near $2.24, XRP is consolidating but Pepa believes a continuation pattern is forming, potentially leading to the 7 Fibonacci extension near $23.94.
XRP Price Analysis: Fibonacci Extensions Map the Bullish Path
The Fibonacci retracement levels shown on the chart reinforce this narrative. XRP is currently hovering between the 0.5 and 0.618 retracement levels ($2.25–$2.65), historically key consolidation zones before major moves.
Breakouts beyond the 0.786 level ($2.82) could catalyze further momentum toward the 1.618 ($3.01) and eventually to the 2.618–4.236 zones, with $4.57 as a shorter-term extreme before the long-shot $23.94.
Dive Deeper: XRP Is Now the Most In-Demand Altcoin for Spot ETF Filings from Major Wall Street Firms
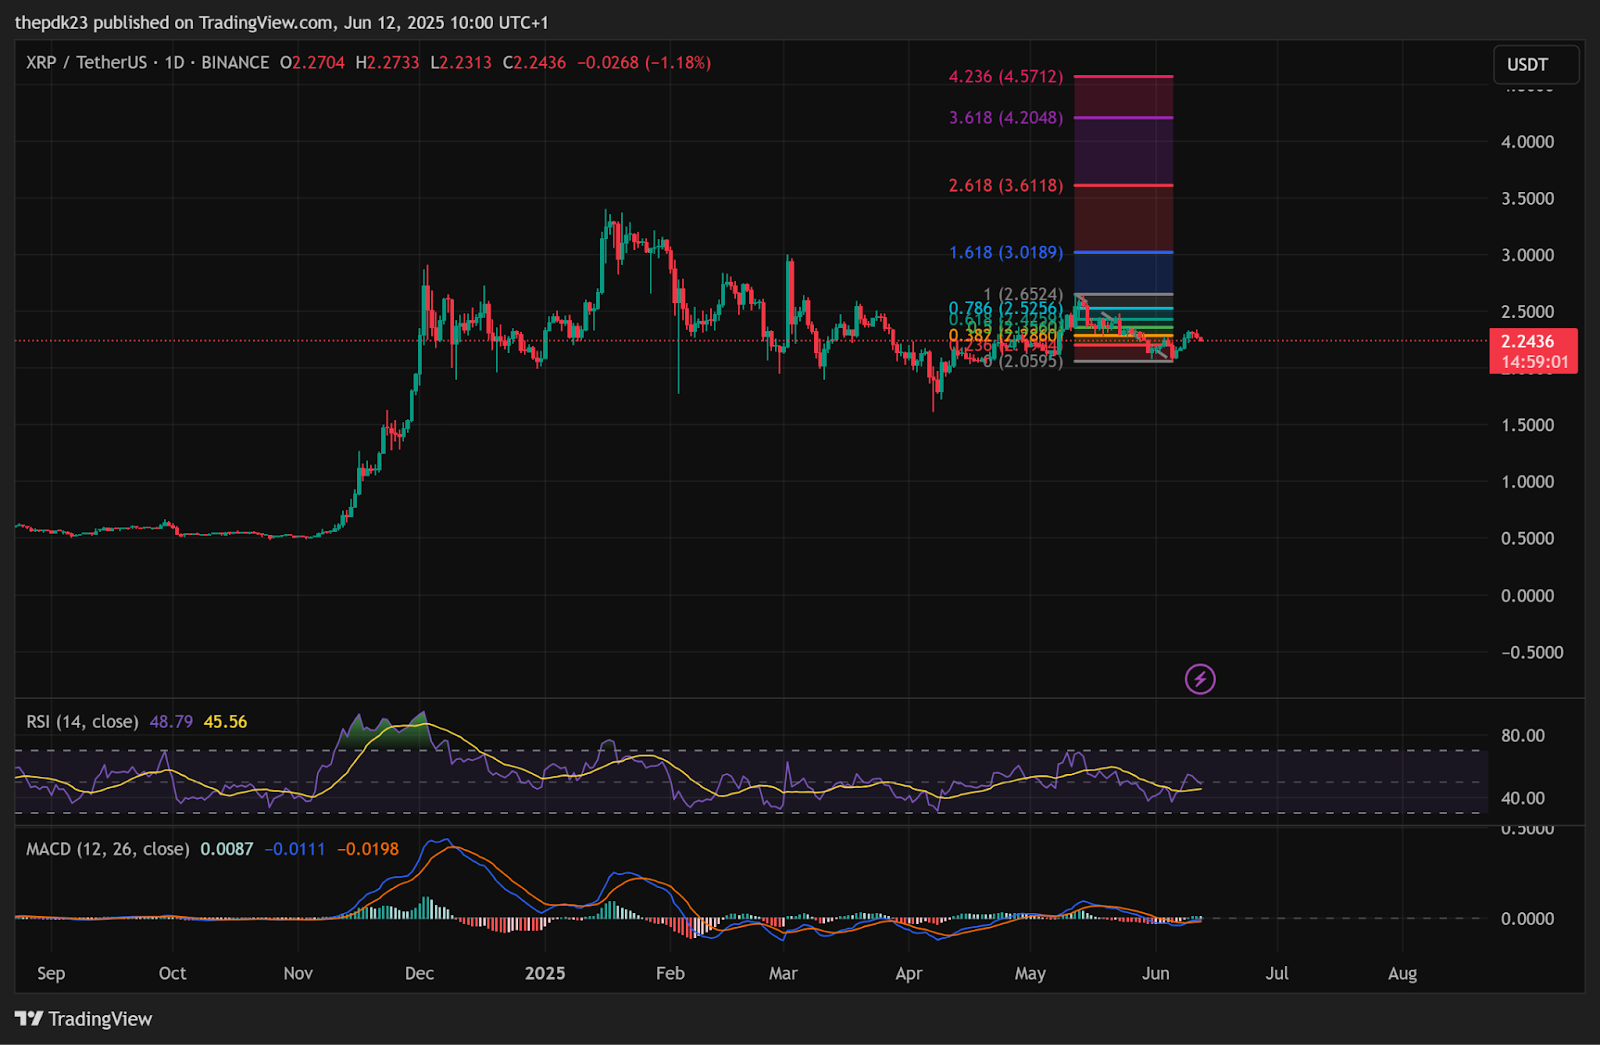
On the other hand, the Relative Strength Index (RSI) currently sits around 45.5, a neutral reading that suggests XRP isn’t overbought and has room to grow. Previous bullish runs have typically started from this mid-range RSI.
Related: Nasdaq-Listed VivoPower Makes a $100 Million Bet on a Yield-Bearing XRP Treasury
Meanwhile, the MACD shows the blue signal line just crossing above the orange slow line, a potential bullish crossover, albeit still below the zero line. This suggests early signs of momentum building, though not yet a confirmed bullish reversal.
Disclaimer: The information presented in this article is for informational and educational purposes only. The article does not constitute financial advice or advice of any kind. Coin Edition is not responsible for any losses incurred as a result of the utilization of content, products, or services mentioned. Readers are advised to exercise caution before taking any action related to the company.