

 12
12
$IOTA price is trading at a critical juncture, with both the daily and hourly charts reflecting a tug-of-war between sellers and buyers. As of June 12, 2025, the $IOTA price has dropped to $0.1861 on the daily and $0.1846 on the hourly, sparking concerns about whether a deeper crash is likely—or a short-term reversal is brewing. Here's a detailed technical breakdown.
$IOTA Price Prediction: What Does the $IOTA Daily Chart Reveal?
 $IOTA Price Prediction">
On the daily chart, $IOTA price has declined nearly 4% today and is hovering just above a strong support cluster between $0.184 and $0.180. The 20-day SMA ($0.1912) and 50-day SMA ($0.2106) are both above the current price, showing that the asset is still under bearish control. The 200-day SMA at $0.2492 remains a long way off, and this acts as a ceiling for any mid-term rally.
From a price structure standpoint, the May rally that took $IOTA near $0.26 failed to create a higher high, confirming this recent downtrend. A Fibonacci retracement from the April low to the May high suggests key levels at $0.182 (38.2%) and $0.162 (61.8%). The price recently bounced at $0.1849, making this level crucial—if it breaks, we could fall toward $0.16 swiftly.
Is the Hourly Chart Signaling a Temporary Rebound?
 $IOTA Price Prediction">
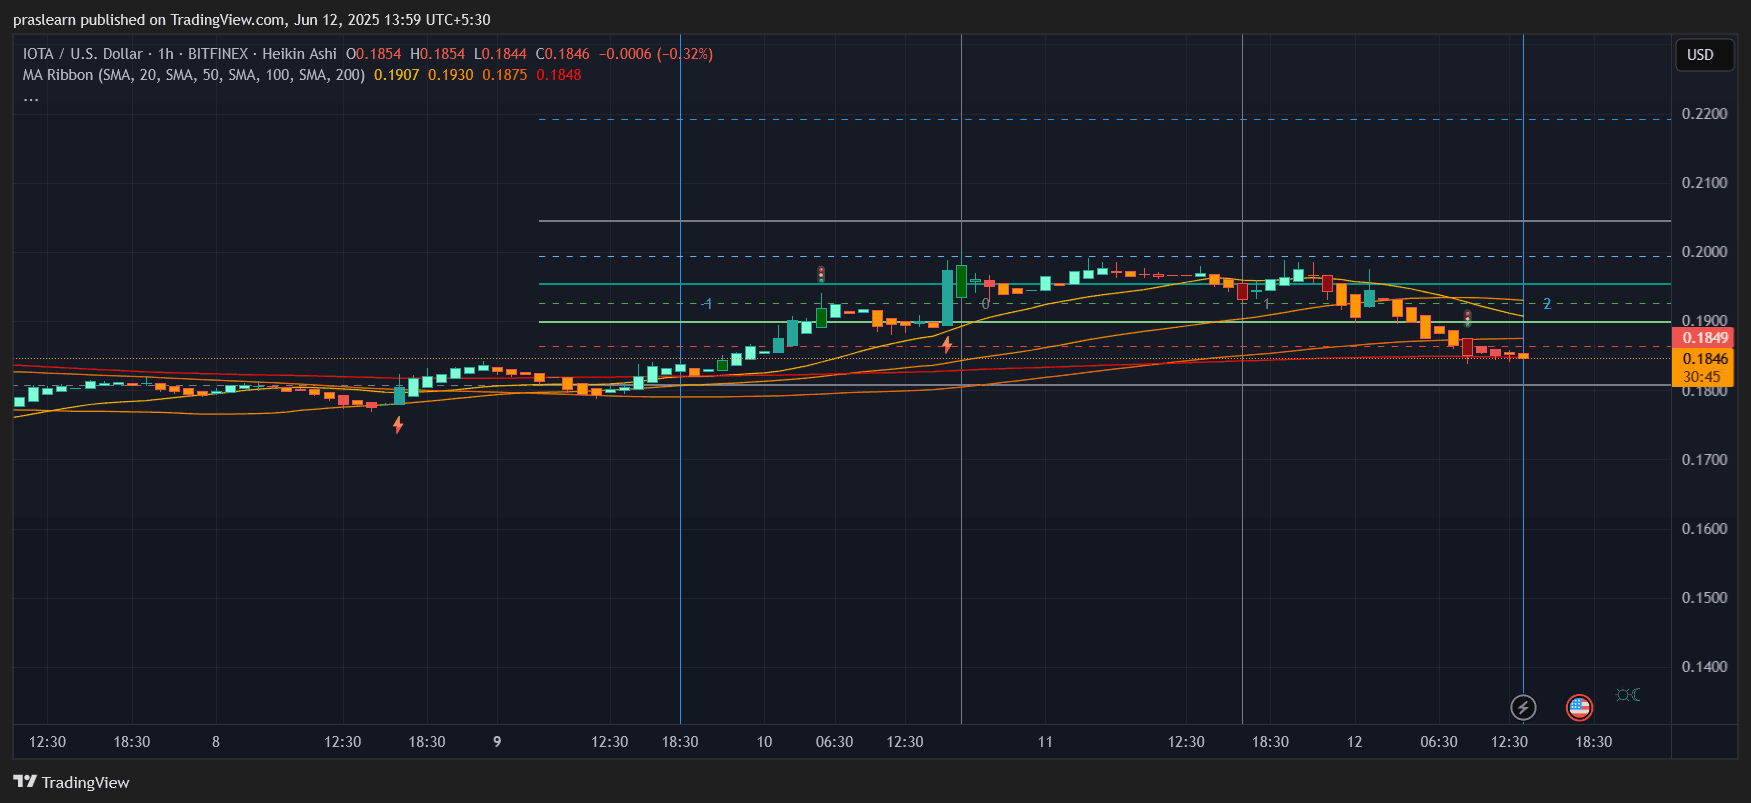
Zooming into the hourly chart, $IOTA price shows a mini-consolidation phase after rejecting the $0.20 resistance multiple times over the last 48 hours. There was a clear breakout attempt on June 10 that touched $0.215, but the move was quickly reversed. This fakeout indicates that bulls are running out of steam unless volume returns.
The hourly 20, 50, and 100 SMAs are converging at $0.1875–$0.1907. This zone is acting like a gravity point. If $IOTA can sustain above $0.190, there's room for a push back to $0.198 and potentially $0.205. However, the latest hourly candle is trading below all major SMAs, which could invite further downside.
Is $IOTA Oversold? RSI and Price Action Suggest So
Looking at the RSI across both timeframes, $IOTA price is nearing oversold territory. While we don't see extreme panic yet, the steady decline without any major bounce over the past two weeks hints at seller exhaustion. A simple price-to-SMA calculation shows:
$IOTA is trading 11.4% below its 50-day SMA:
(0.2106−0.1861)/0.2106=0.116
This discount historically leads to mean reversion moves of 5–8% within a few sessions.
If we assume a modest 6% bounce from $0.1861, the target would be:
0.1861×1.06≈0.1973
This puts the $0.197–$0.200 zone within short-term reach, provided the current support holds.
$IOTA Price Prediction: What Happens If $0.18 Breaks?
This is the key bear scenario. If $0.1849 gives way, $IOTA price could drop to the next support near $0.162 (as per Fibonacci levels). That’s a 12.9% potential drop:
(0.1861−0.162)/0.1861=0.129
This makes the next two days crucial for $IOTA holders. A clean break below $0.18 will likely trigger cascading sell orders, sending the price toward multi-month lows.
Conclusion: Bounce or Breakdown?
Right now, $IOTA price sits on a weak but crucial support base. The short-term indicators suggest that a bounce to $0.197–$0.200 is possible, especially if the price closes above $0.190 on the hourly. However, the daily structure still leans bearish, and any bounce might be short-lived unless volume confirms a trend reversal.
For traders, $0.1849 is the key level to watch. Hold above it, and you get a 6% bounce. Lose it, and you risk a 13% drop. The next 48 hours will likely decide the fate of $IOTA for the rest of June.
$IOTA

