


 19
19
Hyperliquid ($HYPE) has been trading at all-time highs for the past few days and is currently holding above the $40 mark. The token is up nearly 70% over the past 30 days, taking place as one of the top 10 cryptocurrencies by market cap, excluding stablecoins and wrapped assets.
This surge comes as Hyperliquid continues to dominate the perpetuals market and posts some of the highest revenues in crypto. With strong momentum and bullish technicals, $HYPE remains firmly in the spotlight.
Hyperliquid Dominates Perps Market With Unmatched Volume
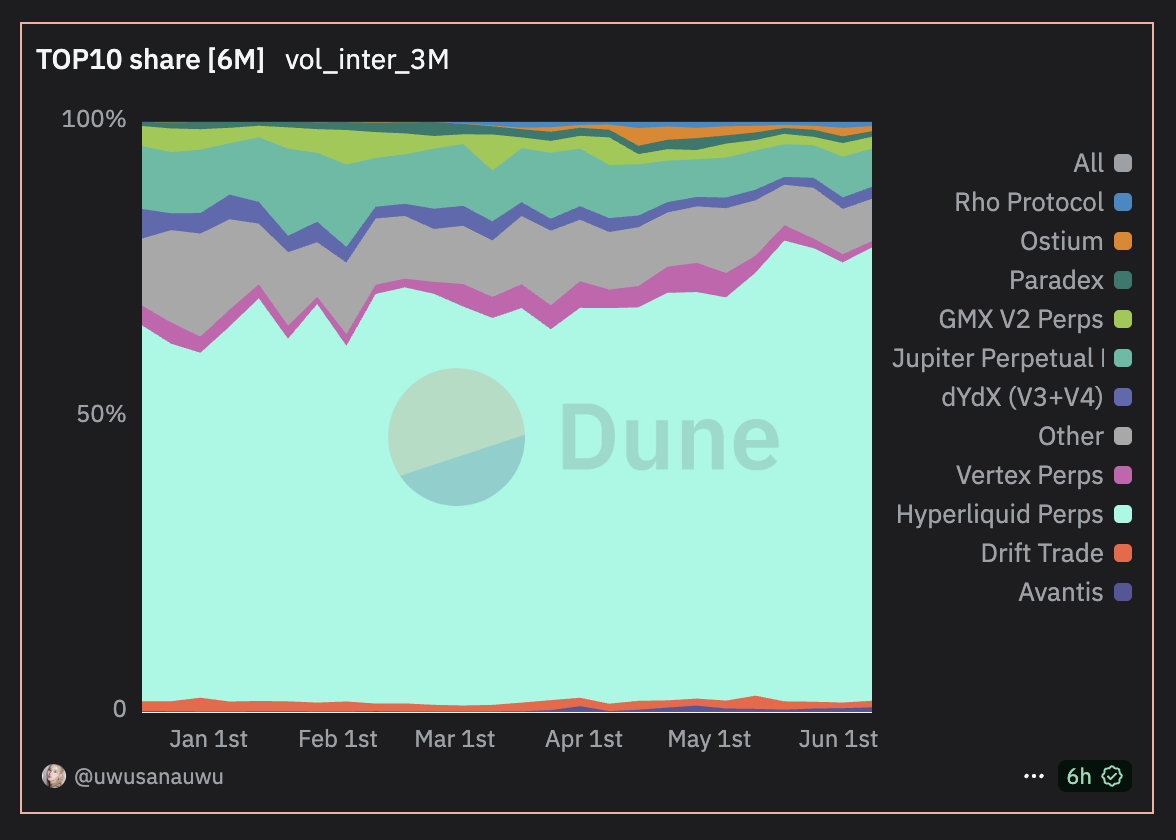
Hyperliquid has firmly established itself as the dominant force in crypto perpetuals, with its market share soaring from 63.7% in December 2024 to a staggering 76.9% today.
With weekly volumes ranging between $50 and $75 billion—dwarfing the $4 to $7 billion range of its closest competitor, Jupiter—Hyperliquid is now in a league of its own in terms of perps trading activity.
It generated nearly $65 million in revenue over the past 30 days, ranking just behind stablecoin giants Tether and Circle while outperforming established names like Tron, PancakeSwap, Axiom, and Pump.
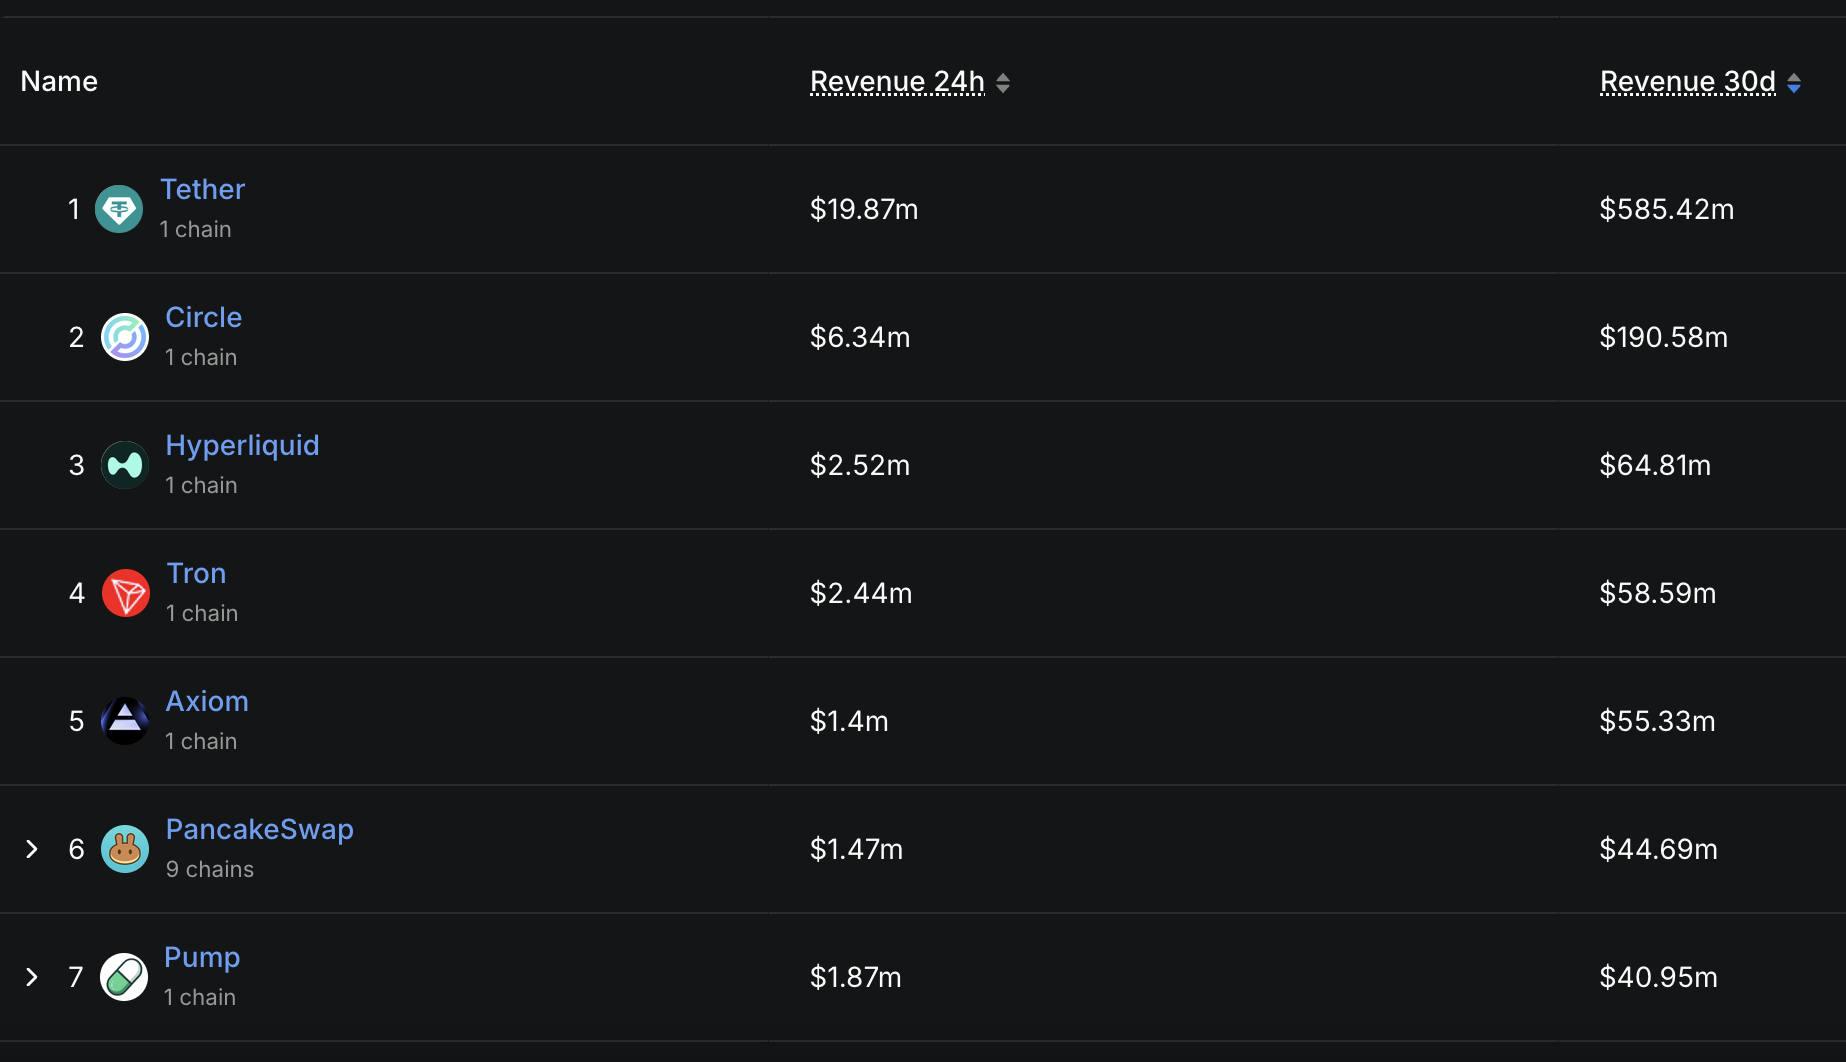
In the past 24 hours alone, Hyperliquid brought in $2.5 million in revenue, as its native token surges to new all-time highs, despite recent controversy around James Wynn trades. Recently, $HYPE was listed on Binance US and analysts are now speculating if it could be listed next on Binance.
$HYPE Cools Off After RSI Peaks, But Momentum Remains
Hyperliquid’s native token, $HYPE, has seen its Relative Strength Index (RSI) cool off to 67.27 after reaching 77.63 yesterday, though it’s still significantly higher than the 50.85 reading from two days ago.
The RSI is a momentum oscillator that ranges from 0 to 100, typically used to identify overbought or oversold conditions. Readings above 70 suggest an asset may be overbought and due for a pullback, while levels below 30 indicate it might be oversold.
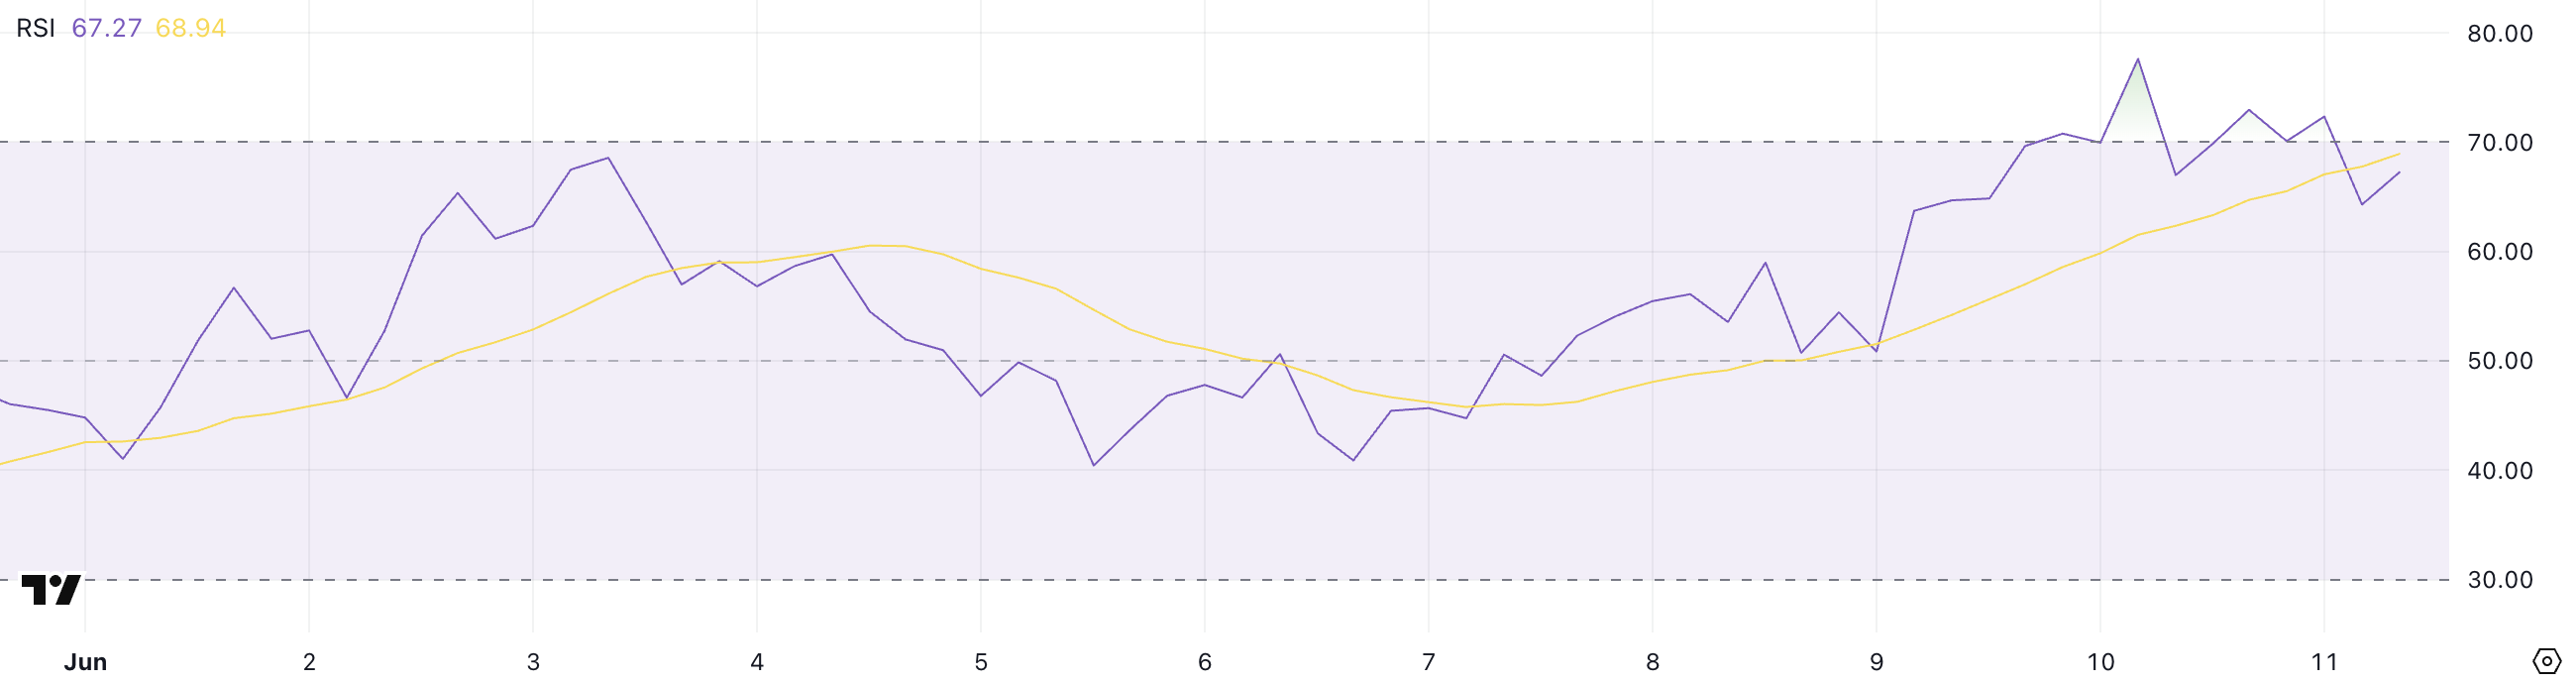
With $HYPE currently sitting just below the overbought threshold, this suggests bullish momentum remains, but buyers may be slowing down after a sharp run-up.
The BBTrend, another key indicator, is currently at -0.9 for $HYPE, up from -4.11 just one day ago, though it has remained negative for three consecutive days. BBTrend (Bollinger Band Trend) measures price strength relative to volatility bands, with positive values typically signaling upward trend strength and negative values indicating weakness or consolidation.
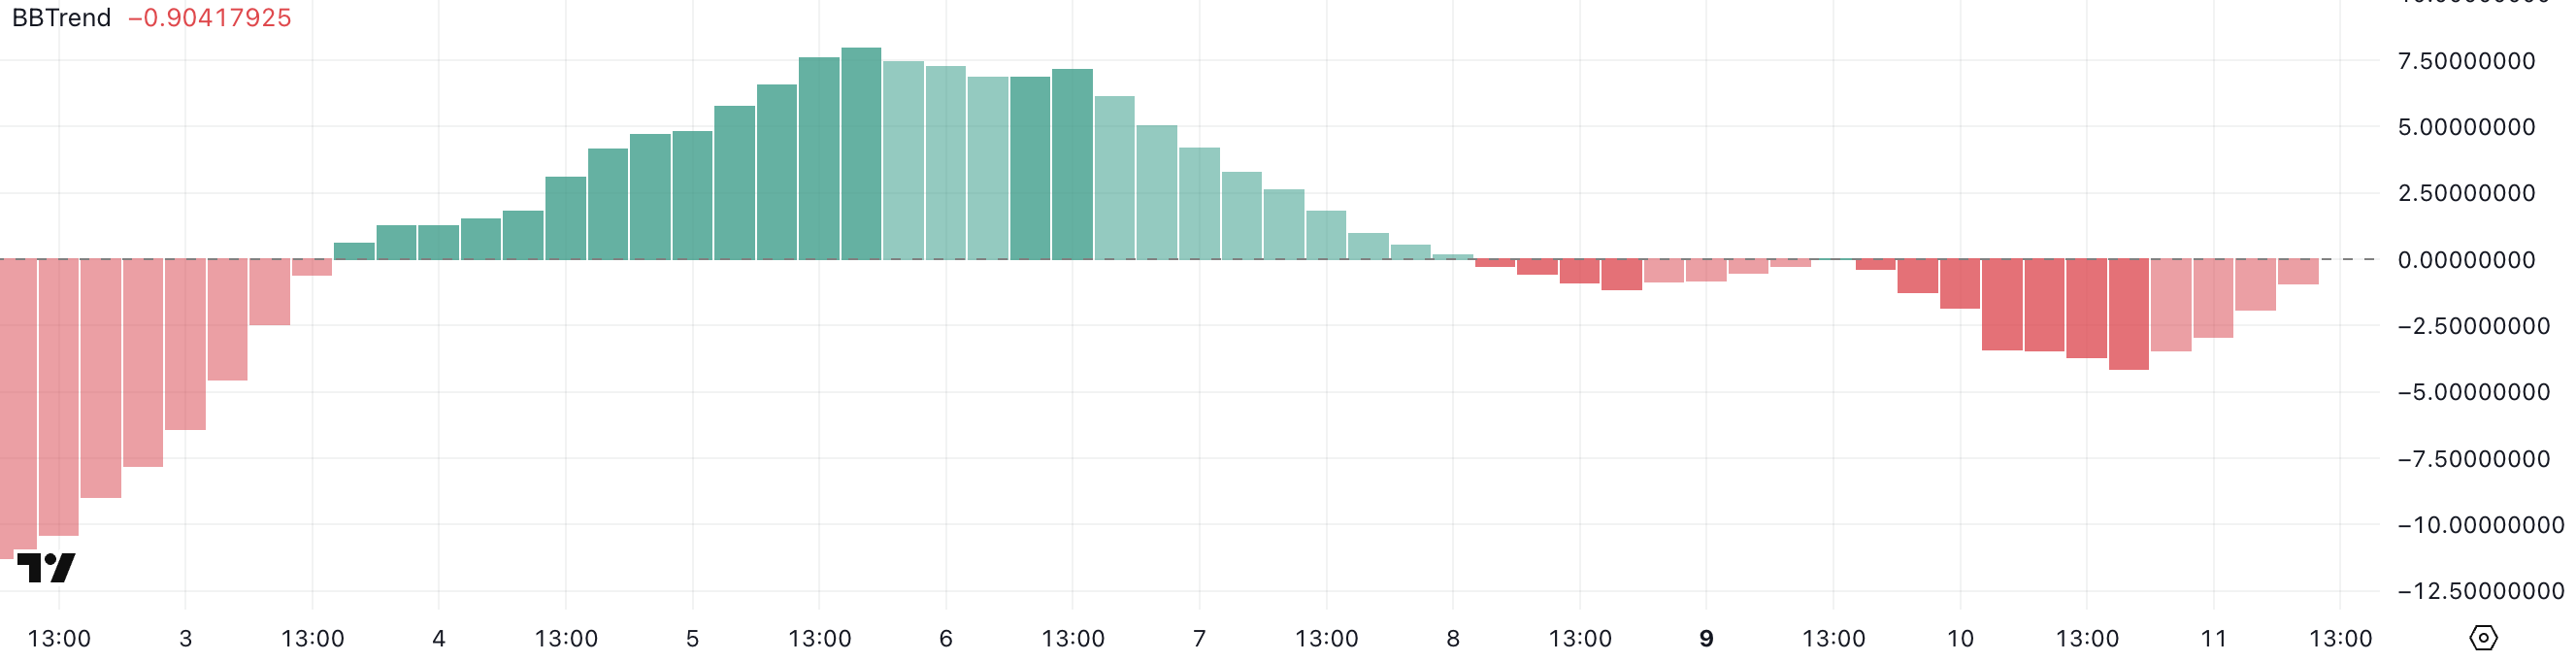
A BBTrend of -0.9 suggests the price is still in a consolidative or weakening phase, but the sharp recovery from lower values hints at stabilizing momentum.
Together, these indicators point to a cooling phase for $HYPE, where the strong rally may pause, but signs of renewed strength are beginning to emerge.
$HYPE Bulls Hold Above $40, Eyes on $45 Next
$HYPE has maintained its position above $40 since yesterday, supported by a strong EMA structure where short-term lines continue to trend above long-term lines—signaling a sustained bullish momentum.
This alignment reflects healthy market sentiment and indicates that buyers remain in control for now.
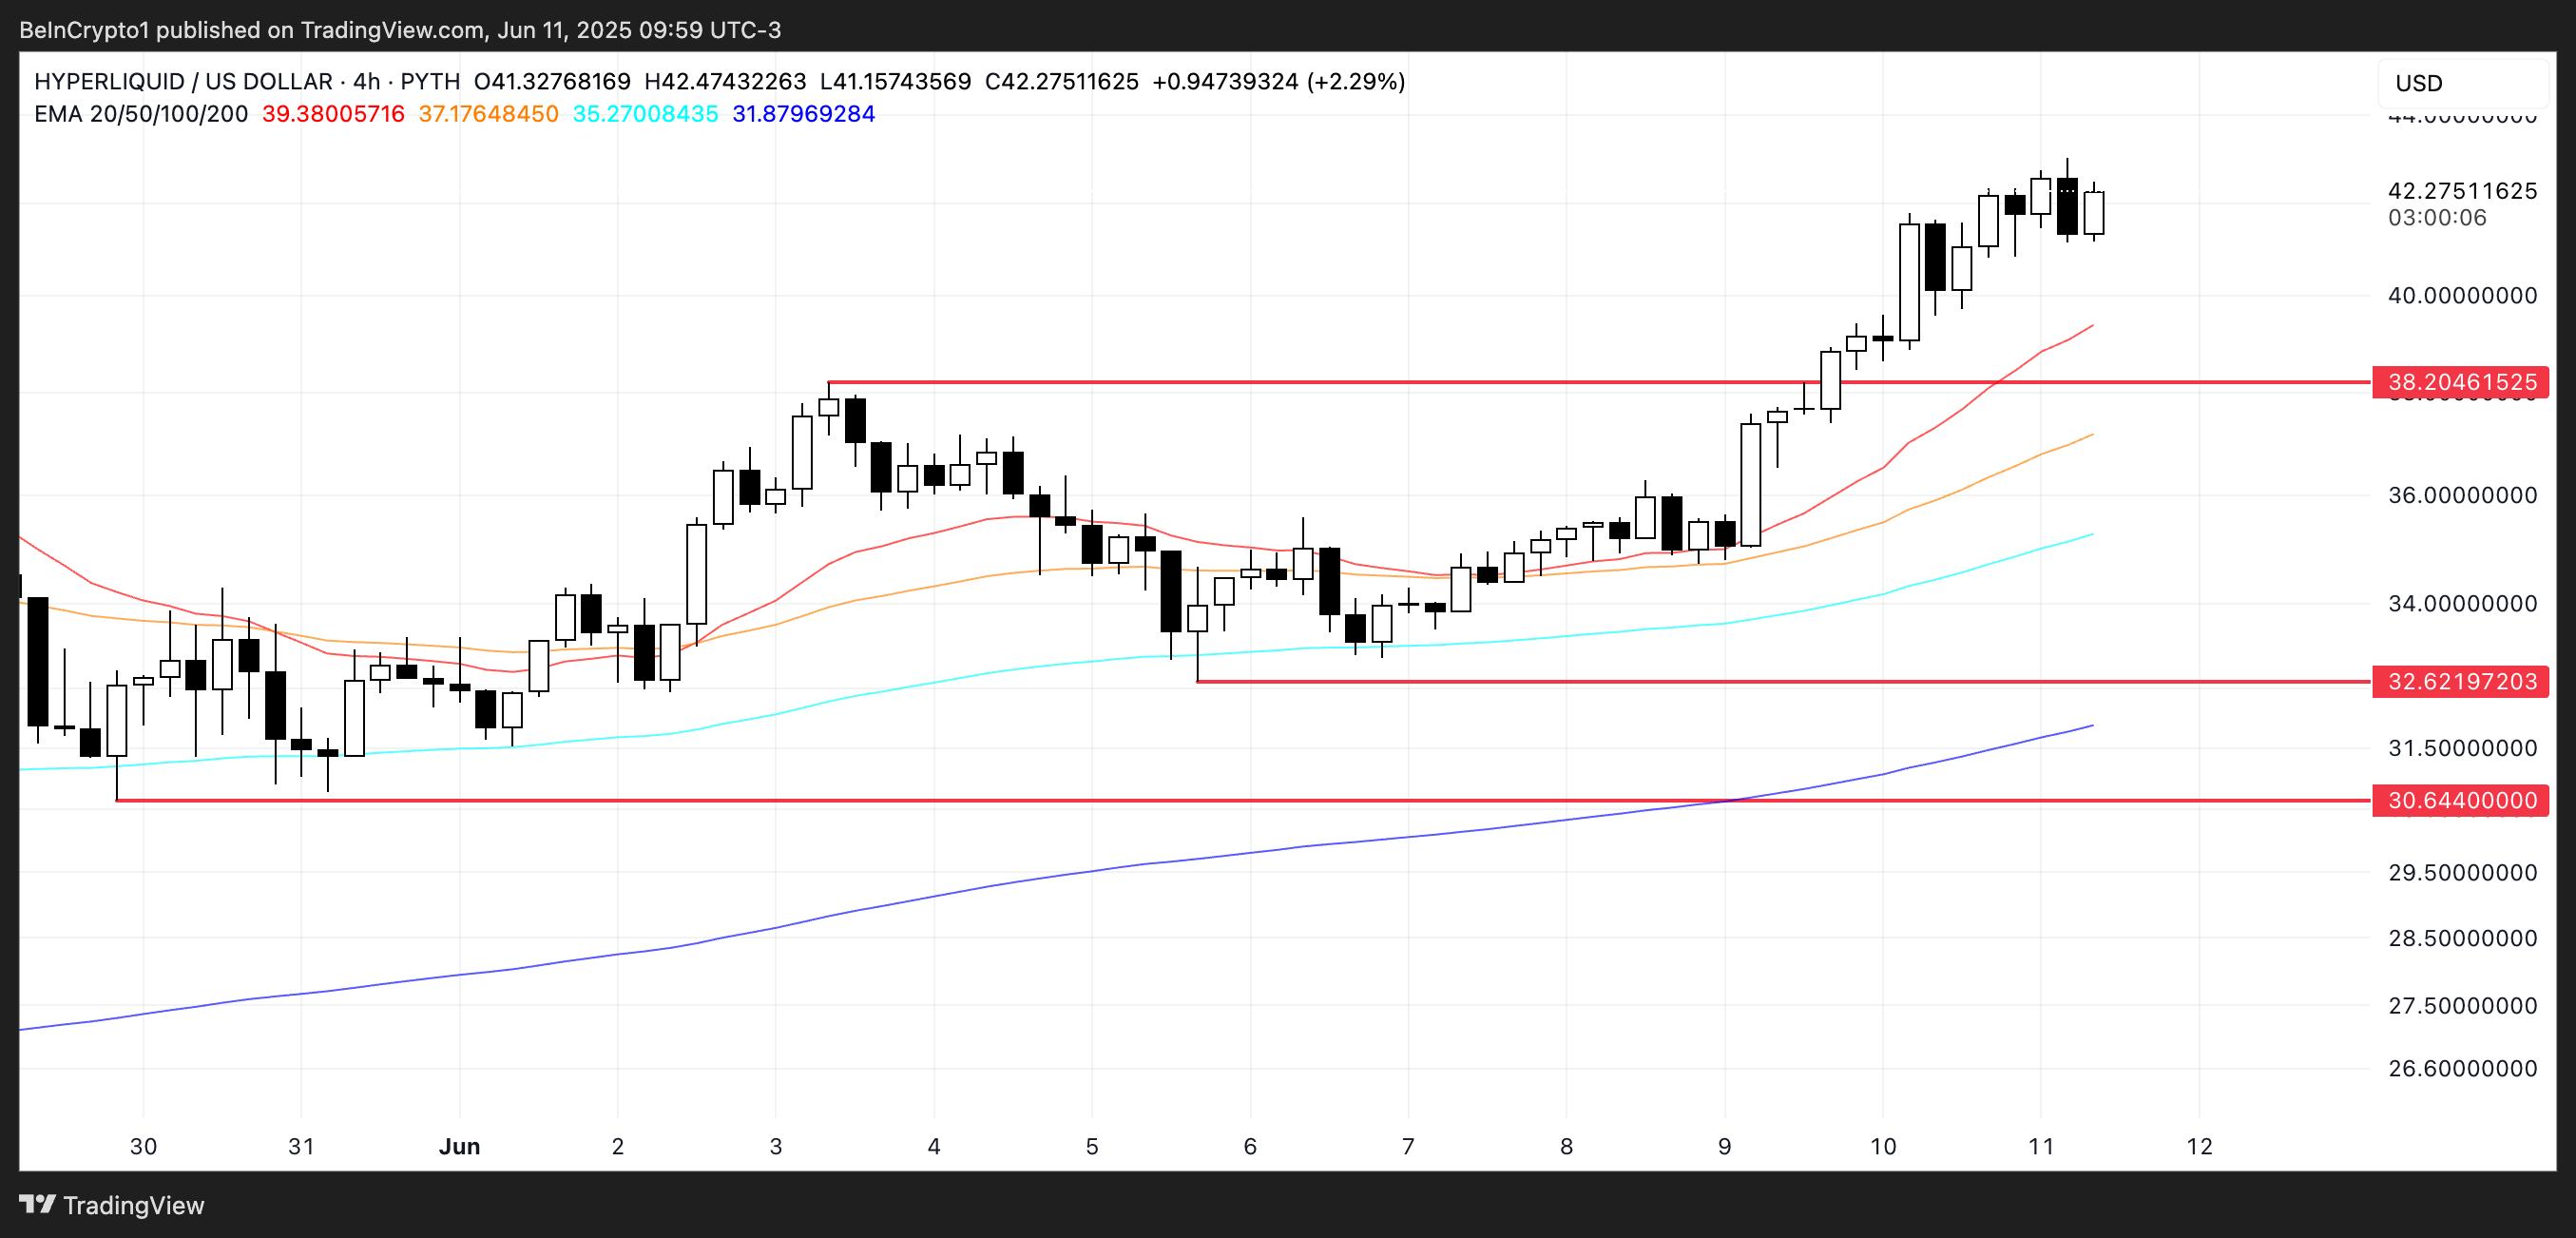
As long as this setup holds, upward continuation remains likely, with the next key test for bulls being the $45 region.
However, downside risks are clearly defined. If momentum weakens and $HYPE retests the $38.2 support level, a break below could trigger a deeper correction.
In that scenario, price may decline toward $32.62, and if that level also fails to hold under heavy selling pressure, $HYPE could drop as low as $30.64.
