


 30
30
$XRP, the fourth-biggest cryptocurrency in the market, is up by nearly 2% in the past 24 hours, trading at a market price of $2.32. The $XRP price trend gains momentum as Ondo Finance launches U.S. Treasuries on the Ripple’s $XRP ledger. With the boost in adoption, the short-term recovery in $XRP hints at an extended rally, as so does the Ondo token price, aiming for a trendline breakout.
Ondo Finance’s Tokenized US Treasuries Live on $XRP Ledger
In a recent announcement on Ripple’s blog on June 11, Ondo Finance has launched its flagship tokenized US Treasuries product, OUSG, in the $XRP ledger, a public blockchain powered by Ripple. This is a major step in the institutional adoption of Ripple and its product in the decentralized finance world.
With the tokenized US Treasuries launching on Ripple’s $XRP ledger, institutions will now have exposure to low-risk, short-duration treasury bills, while the $XRP ledger blockchain will provide low transaction costs and fast settlements.
$XRP Price Analysis
As the new adoption fuels the bullish sentiment surrounding Ripple, $XRP price has surged by nearly 1% on Wednesday. With multiple lower-priced rejection candles, the breakout rally of a falling wedge pattern gains traction on the daily price chart.
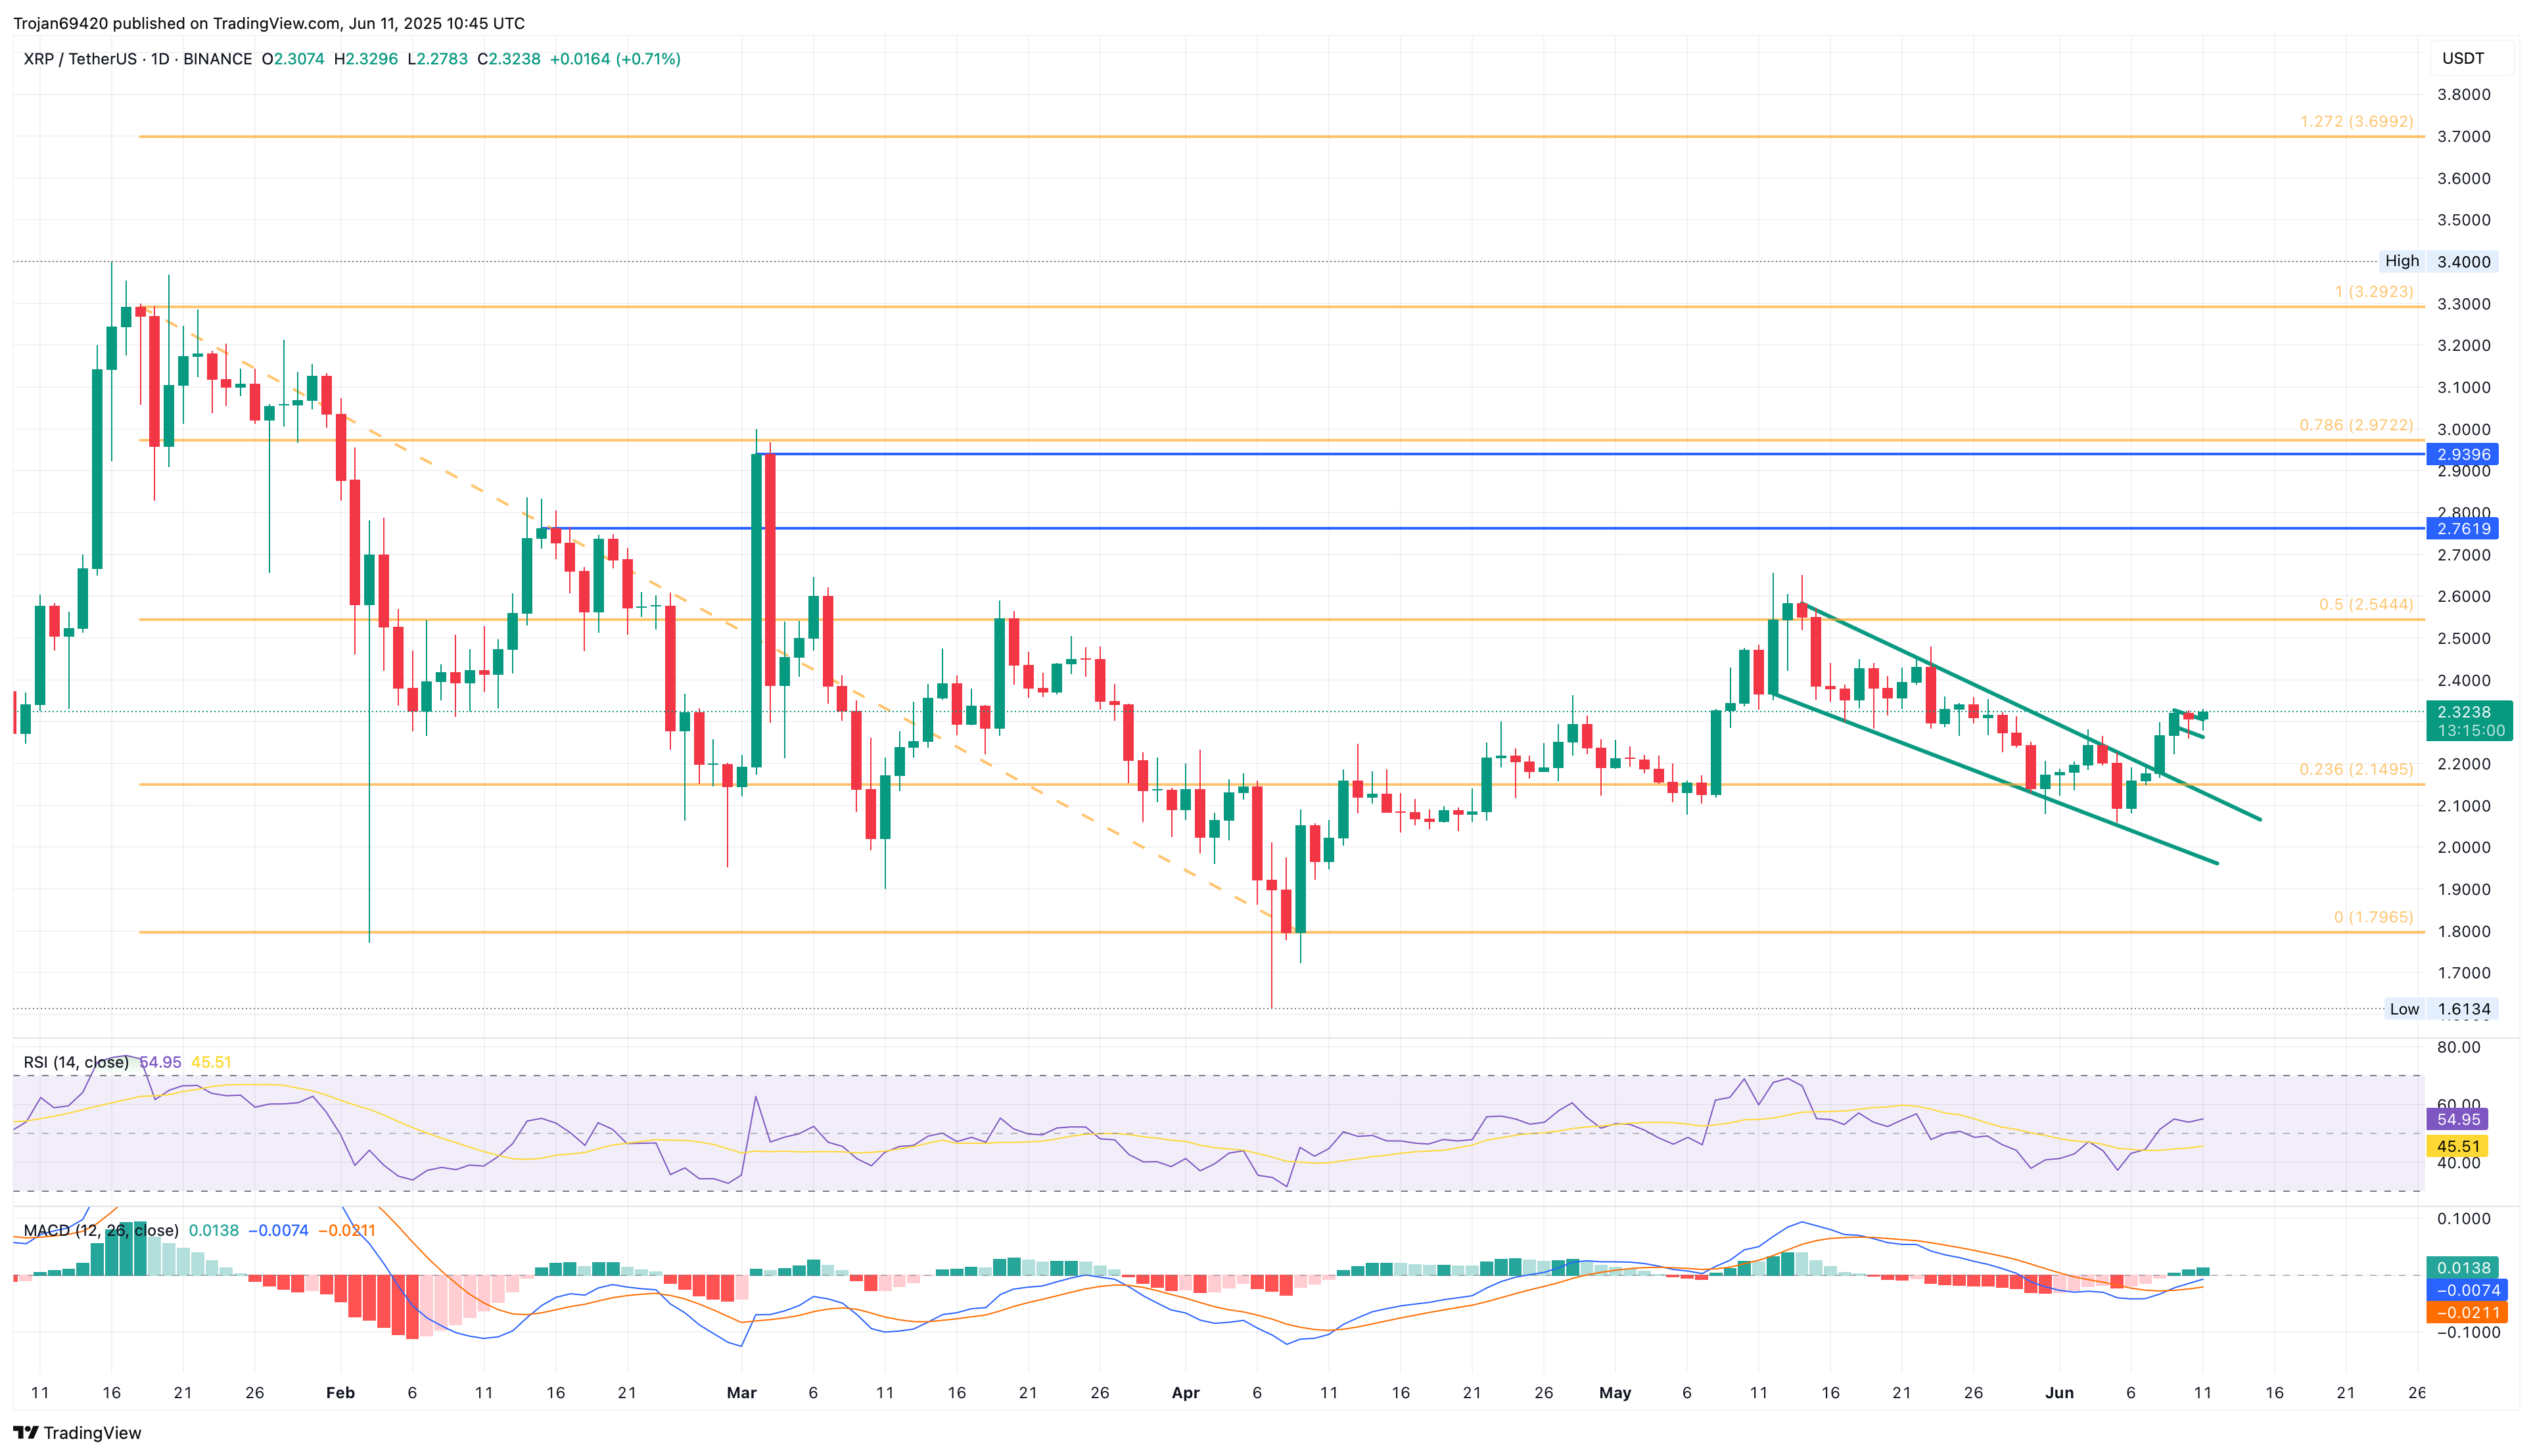
As per the Fibonacci levels, the $XRP price breakout rally is aiming to challenge the 50% Fibonacci level at $2.54, while the lower support remains at the 23.60% level at $2.14.
Supporting the bullish trend, the MACD and Signal line have given a positive crossover, while the RSI line at 54, crossing above the halfway level, suggests a surge in bullish momentum. Hence, the technical indicators highlight a path of reach resistance upwards, aiming for a price target of $2.54.
$ONDO Price Analysis
Similar to $XRP price, the $ONDO token price witnesses a V-shaped reversal over the past few days, nearing the 23.60% Fibonacci level at $0.91. However, the intraday pullback of 0.76%, despite a lower price rejection, reflects a weakness in the bullish trend.
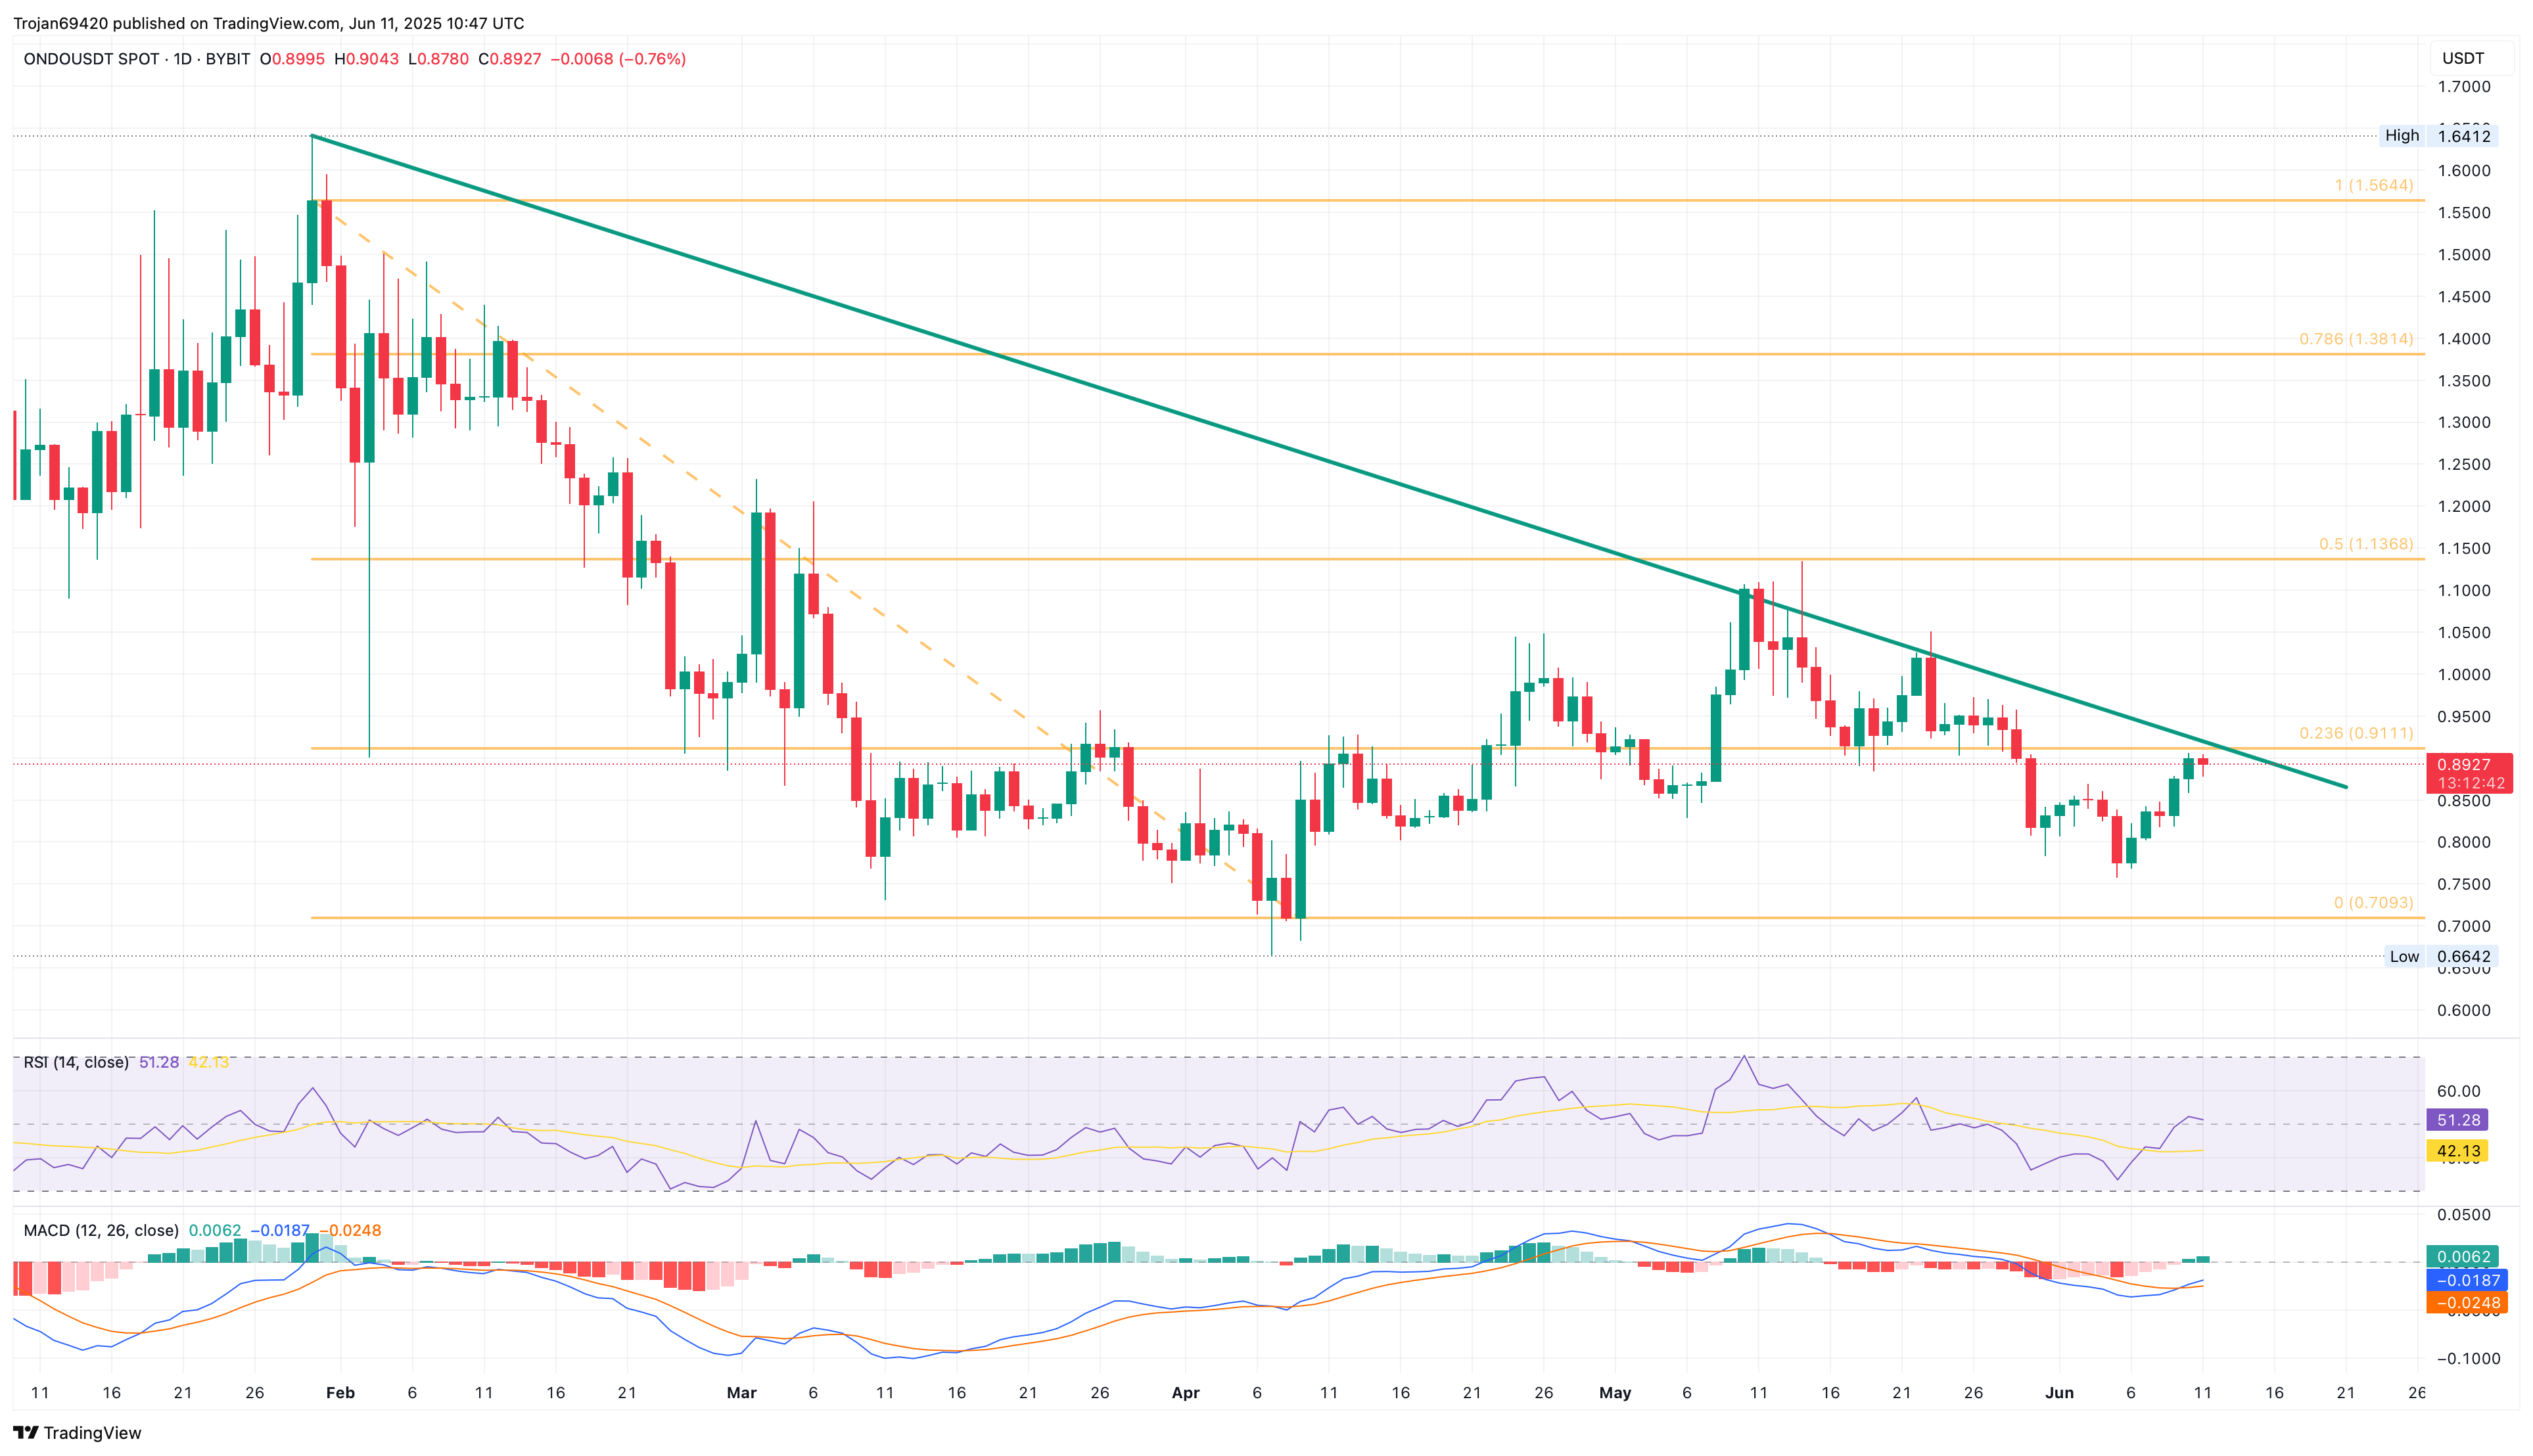
As the uptrend halts, the price action analysis reveals a confluence of resistance of a long-standing resistance trend line and the 23.60% Fibonacci level. Despite the strong headwinds, the technical indicators support a positive, optimistic viewpoint.
The RSI line at 51 spikes above the halfway level, suggesting a surge in bullish momentum, while the positive crossover in the MACD and signal lines are triggered by a signal.
A potential closing above the 23.60% Fibonacci level could extend the bullish trend to a 50% level at $1.13. On the flip side, the crucial support remains the $0.75 mark, followed by the support level at $0.70, highlighted by the lowest closing price in April.