Following a sharp recovery from recent lows, Dogecoin price action is showing signs of consolidation below a key resistance zone. As of June 10, Dogecoin price today is hovering around $0.191, up nearly 8% from the June 7 low of $0.176. This rebound marks a significant shift in short-term sentiment, but DOGE still faces technical hurdles ahead of the next leg higher.
What’s Happening With Dogecoin’s Price?
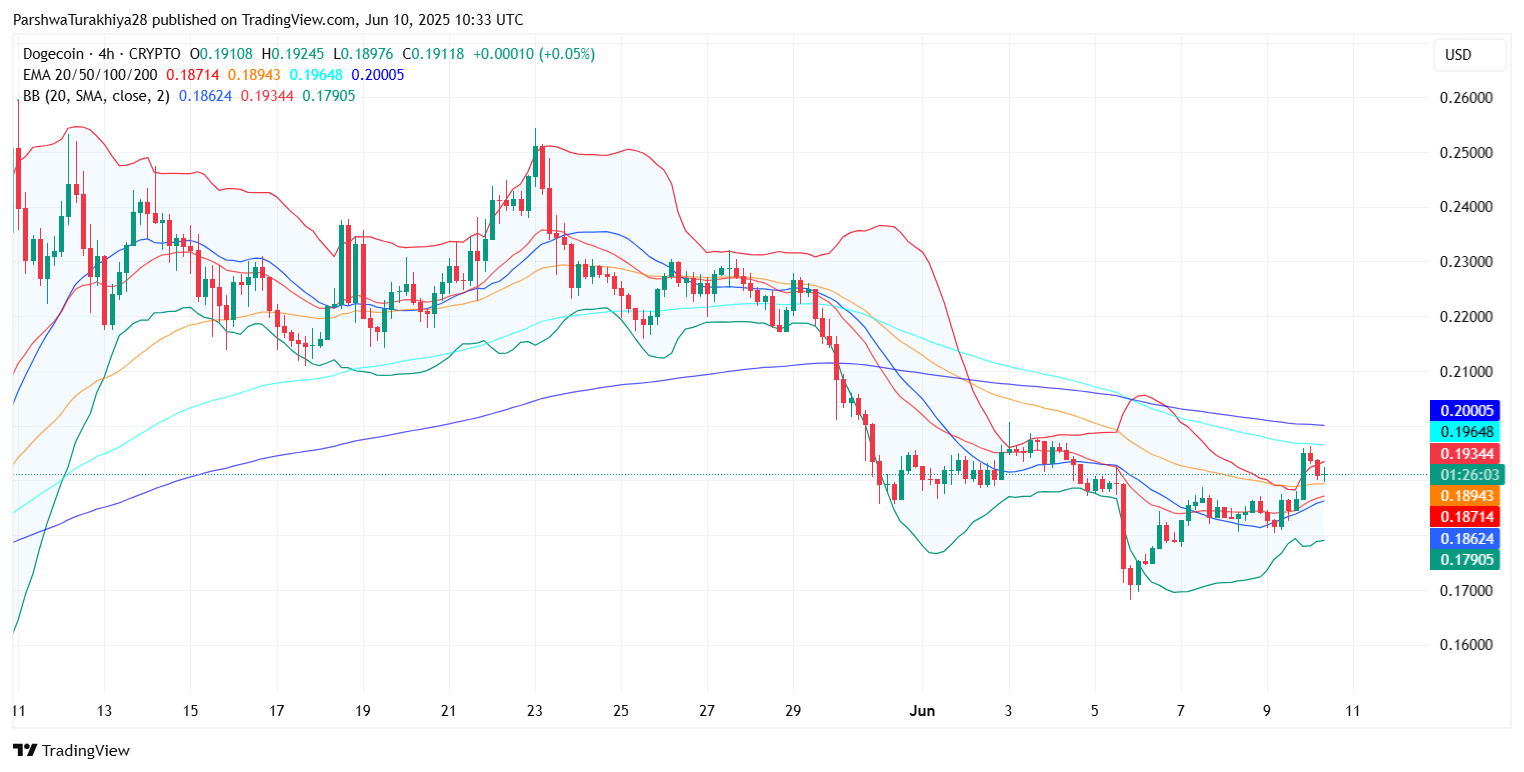
DOGE staged a clean breakout above a descending trendline on the 4-hour chart, reclaiming the $0.188–$0.190 zone, which had previously acted as a supply region. However, the price failed to break above $0.195—an area that aligns with both the upper Bollinger Band and the 100 EMA, signaling persistent resistance.
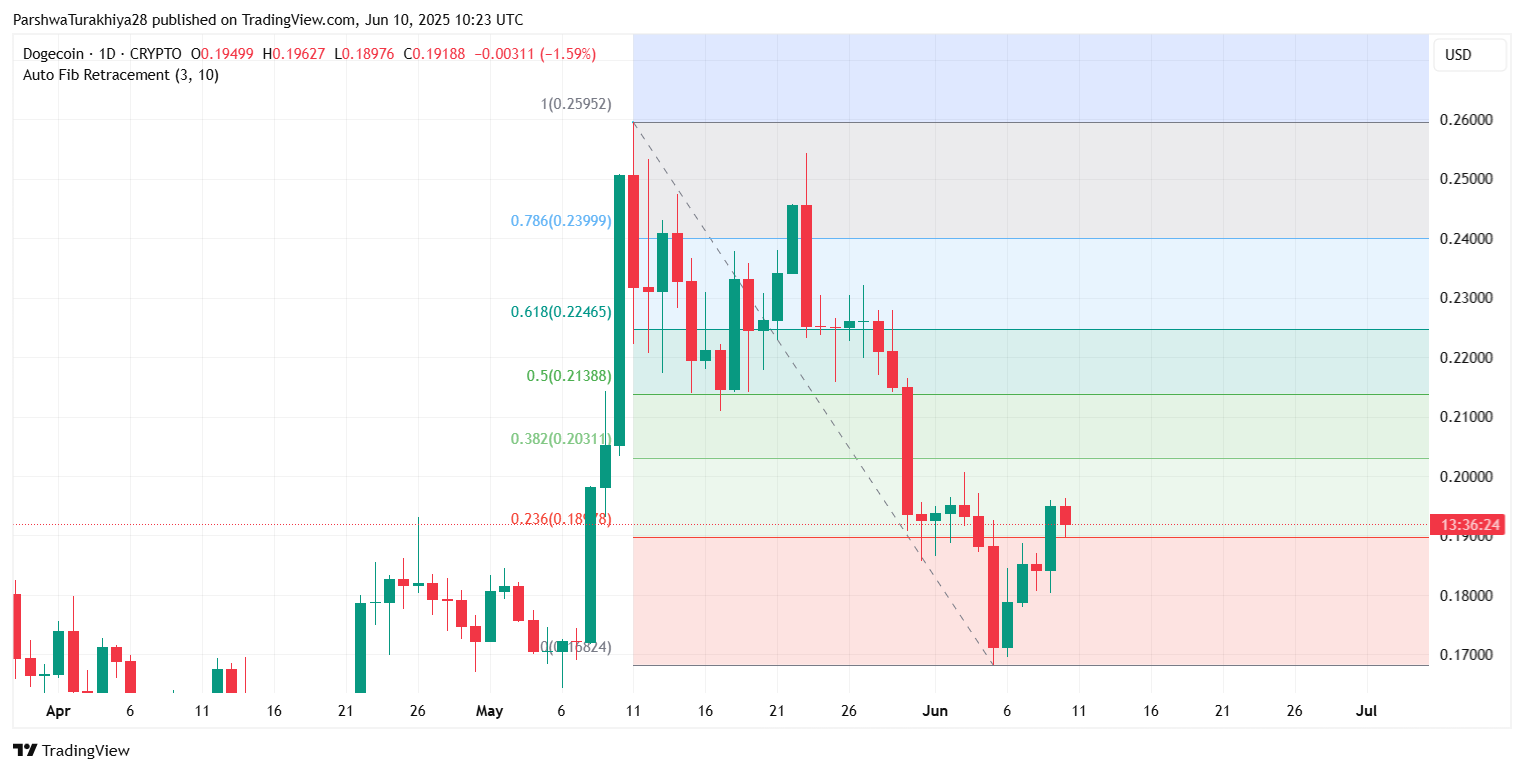
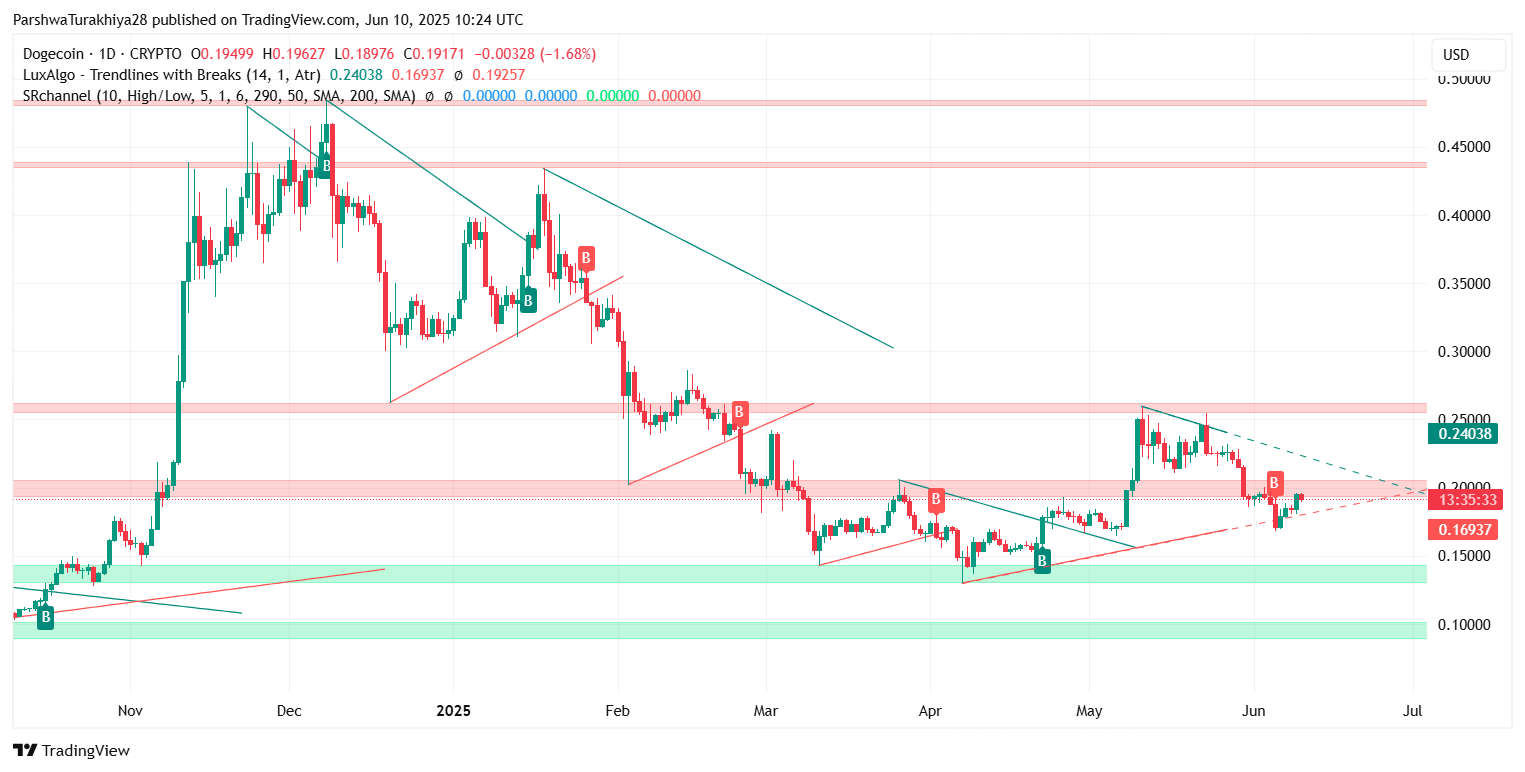
On the daily chart, Dogecoin price update shows a retracement from the May highs near $0.26 toward the Fibonacci 0.236 level around $0.188. The current bounce off this zone is technically constructive, but the recovery remains capped below the 0.382 Fib level at $0.203. Until DOGE can flip this level into support, upside risk remains tempered.
RSI and MACD Suggest Recovery Lacks Strong Momentum
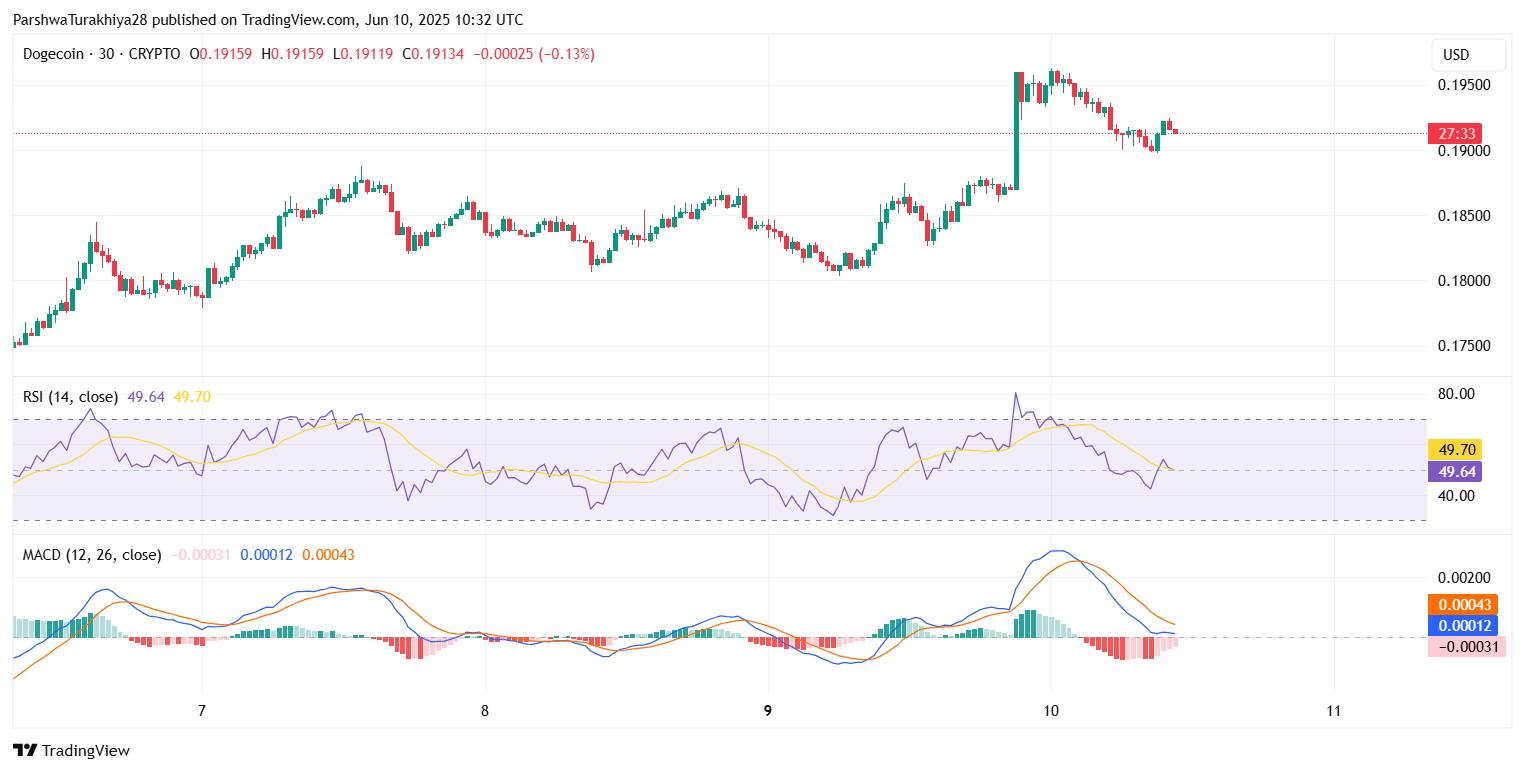
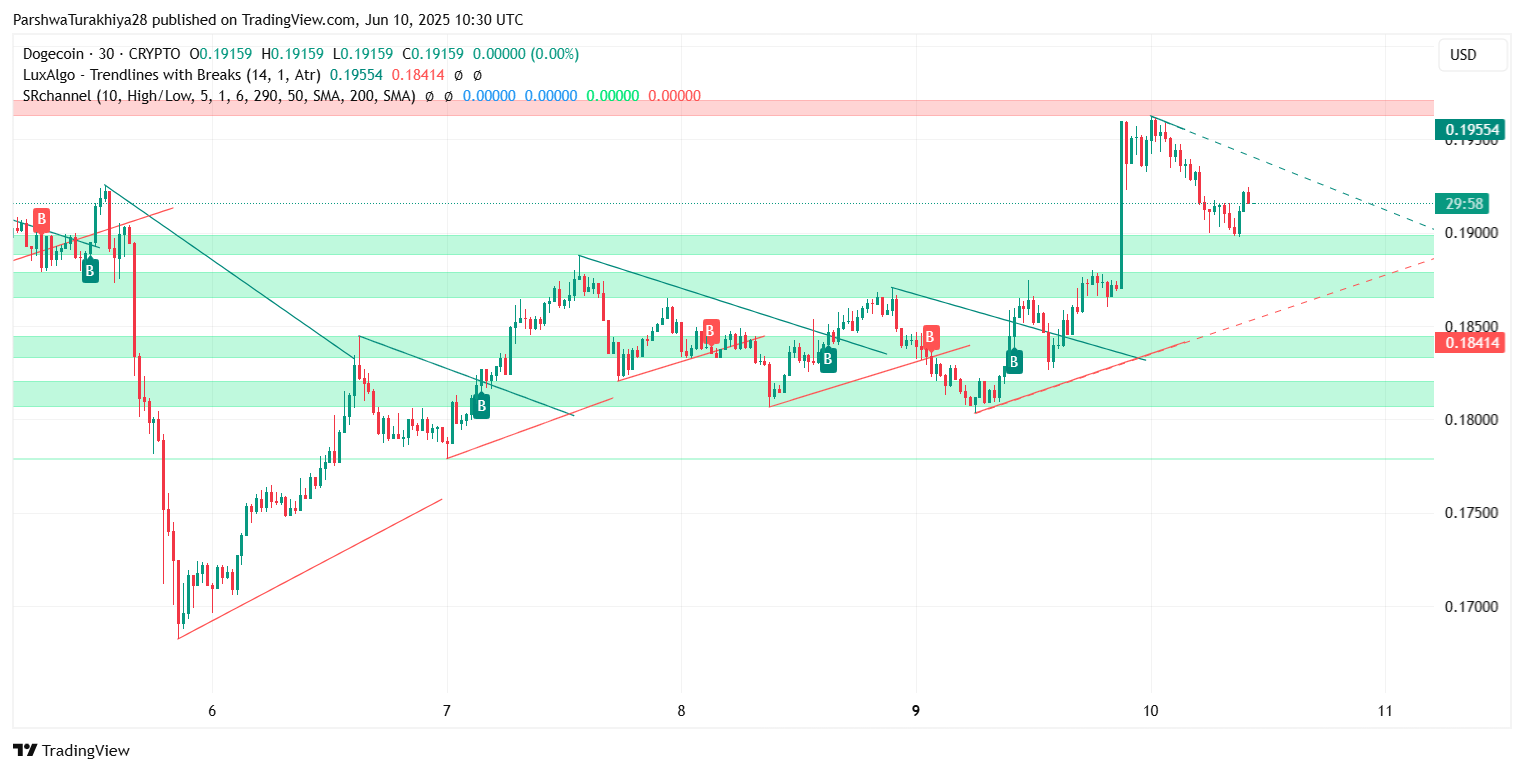
On the 30-minute chart, RSI sits just below neutral at 49.6, hinting at short-term indecision. The MACD is marginally positive, showing a weak bullish crossover, but lacks the volume needed to fuel a stronger rally. This reflects waning momentum despite a recent Dogecoin price spike.
The Stochastic RSI has rebounded from oversold conditions, which often precedes local upside, but the reaction so far has been muted. Until these oscillators show stronger conviction, the current recovery remains fragile.
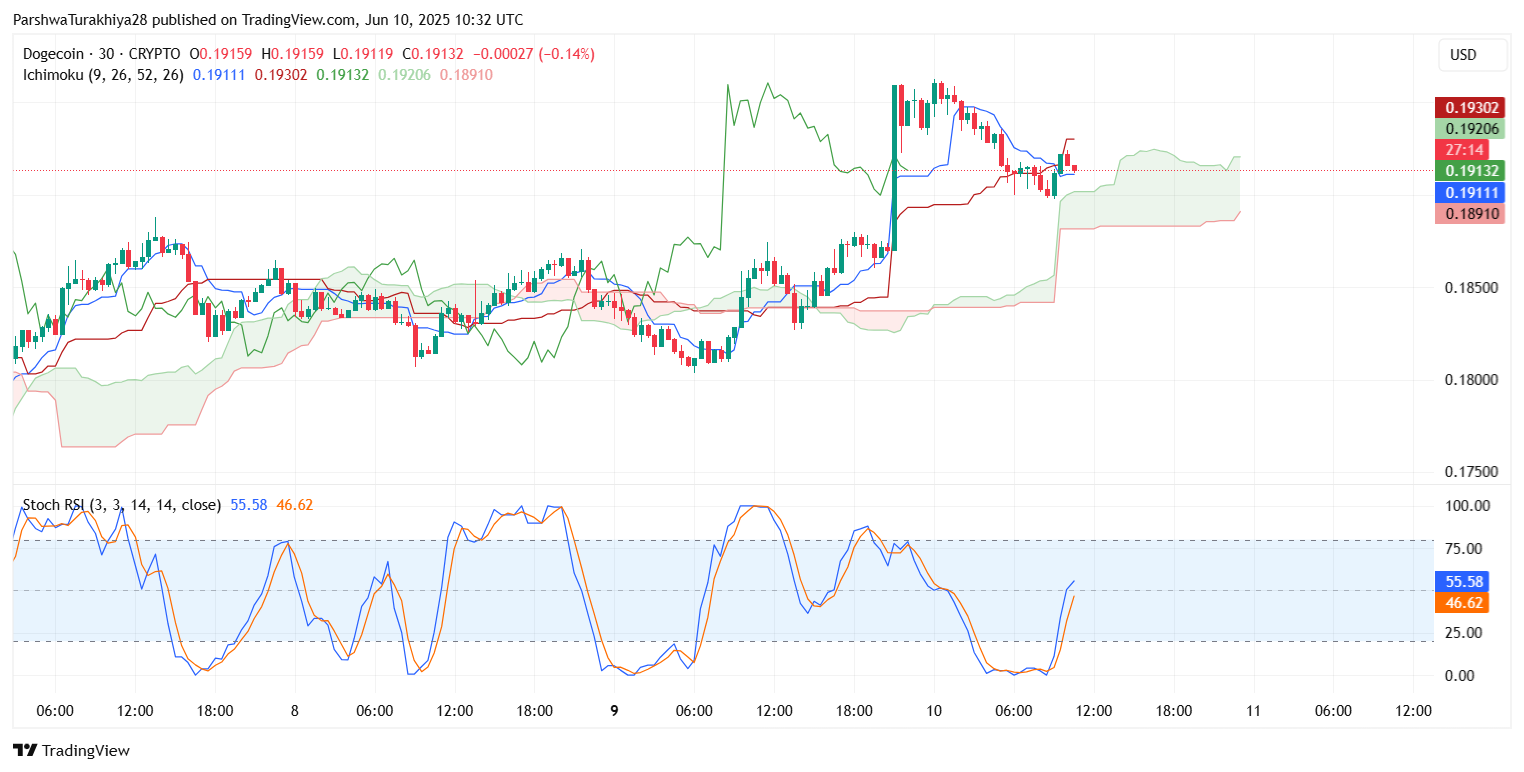
Ichimoku and Trendline Confluence Reinforce $0.192 as Pivot Zone
DOGE remains slightly above the Ichimoku Cloud on the 30-minute chart, offering near-term support at $0.189. However, the cloud top at $0.193 and the 200 EMA at $0.200 on the 4-hour chart remain key inflection points. Failure to break this resistance cluster could invite renewed pressure back toward the $0.185–$0.181 zone.
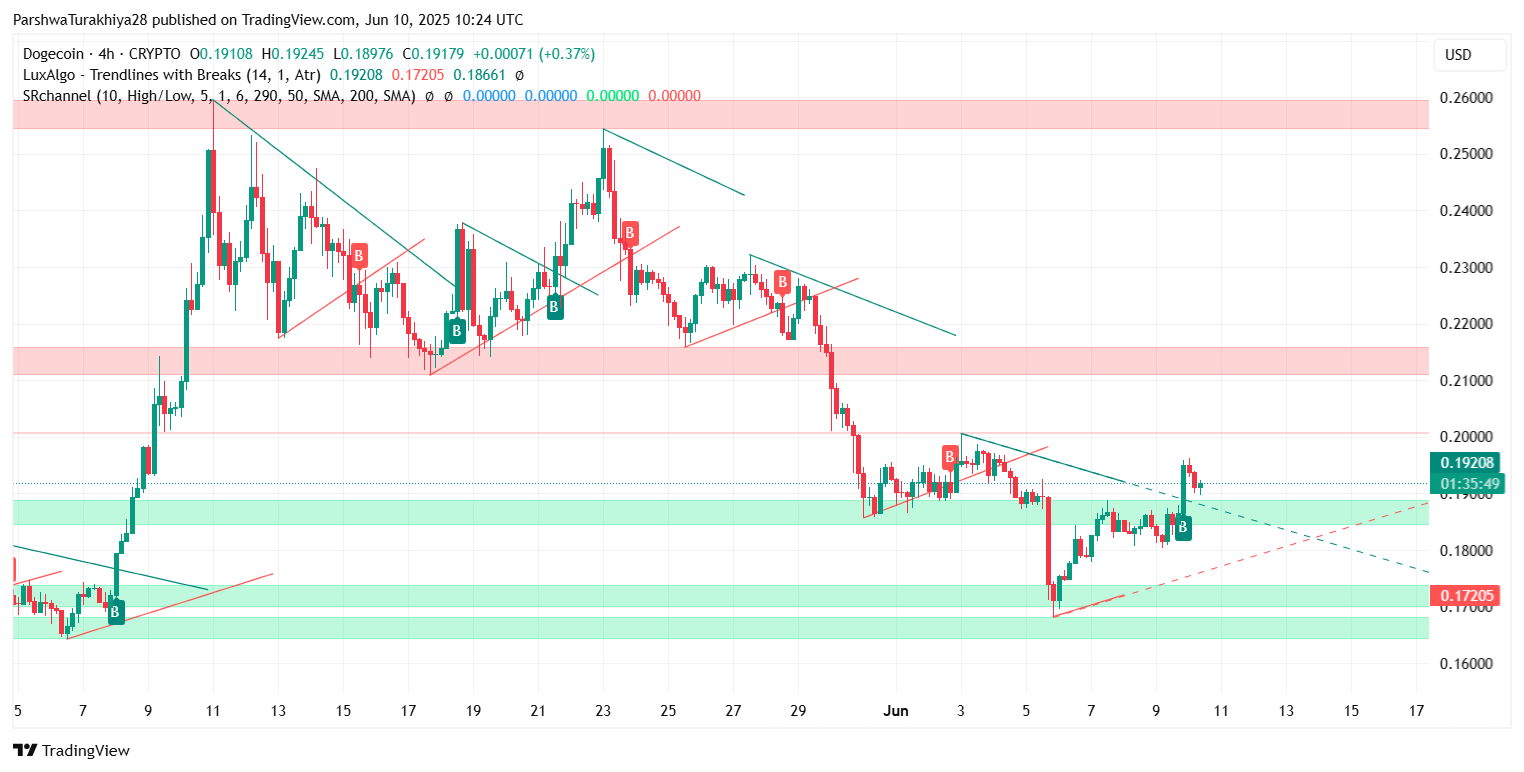
Trendline analysis confirms this outlook, with DOGE trading within a narrowing triangle. A decisive break above $0.19554 would invalidate the descending trendline and open the door to test the $0.203–$0.213 zone. Conversely, a drop below $0.186 could lead to a retest of $0.17205 and even $0.165.
Why Dogecoin Price Going Up Today
The recent uptick in Dogecoin price appears driven by speculative accumulation around the mid-$0.18 zone, a historically defended support band. Traders likely positioned early as DOGE respected this base multiple times over the last week. Additionally, broader market stability in Bitcoin and Ethereum provided tailwinds that encouraged buyers to step in at lower support.
Furthermore, the Dogecoin price action coincides with breakout signals on lower timeframes. The presence of multiple “B” buy signals from LuxAlgo indicators suggests early algorithmic interest, which could catalyze further upside if confirmed by volume.
Short-Term Forecast and Risk Levels
In the short term, DOGE is poised between compression and potential continuation. A daily close above $0.195 is critical to break the sequence of lower highs on the 4-hour and daily charts. Bulls will then target:
- $0.203 (Fib 0.382 level)
- $0.213 (Fib 0.5 level)
- $0.224 (Fib 0.618 zone, heavy resistance)
On the downside, a failure to hold $0.188 could bring:
- $0.181–$0.179 (EMA cluster and horizontal support)
- $0.172 (Fib 0% zone)
- $0.165 (last week’s low)
Dogecoin price volatility has compressed recently, as shown by the narrowing Bollinger Bands. This often precedes larger directional moves. Traders should watch for a breakout beyond the $0.195–$0.200 region or a drop below $0.181 to determine direction.
Technical Forecast Table
| Indicator | Support Levels | Resistance Levels | Signal |
| Fib Levels | $0.181 / $0.172 | $0.203 / $0.213 | Neutral |
| EMAs | 20/50 EMA at $0.189 | 100/200 EMA at $0.196–$0.200 | Mixed |
| RSI | 49.6 (Neutral zone) | Below 50 | Weak Momentum |
| MACD | Slight Bullish Cross | Awaiting Follow-Through | Early Bullish |
| Bollinger | Bands Tightening | Expansion Expected | Imminent Move Likely |
| Ichimoku | Base at $0.189 | Resistance at $0.193–$0.195 | Range-Bound |
Disclaimer: The information presented in this article is for informational and educational purposes only. The article does not constitute financial advice or advice of any kind. Coin Edition is not responsible for any losses incurred as a result of the utilization of content, products, or services mentioned. Readers are advised to exercise caution before taking any action related to the company.