After reclaiming key support near $152, the Solana price today is trading around $158.67, marking a rebound of over 4% in the last 48 hours. This recovery follows a breakout from a falling wedge pattern visible on both the 30-minute and 4-hour charts, pushing Solana price back into a critical resistance zone between $158 and $161. However, momentum indicators are mixed, and Solana price volatility is beginning to rise again.
What’s Happening With Solana’s Price?
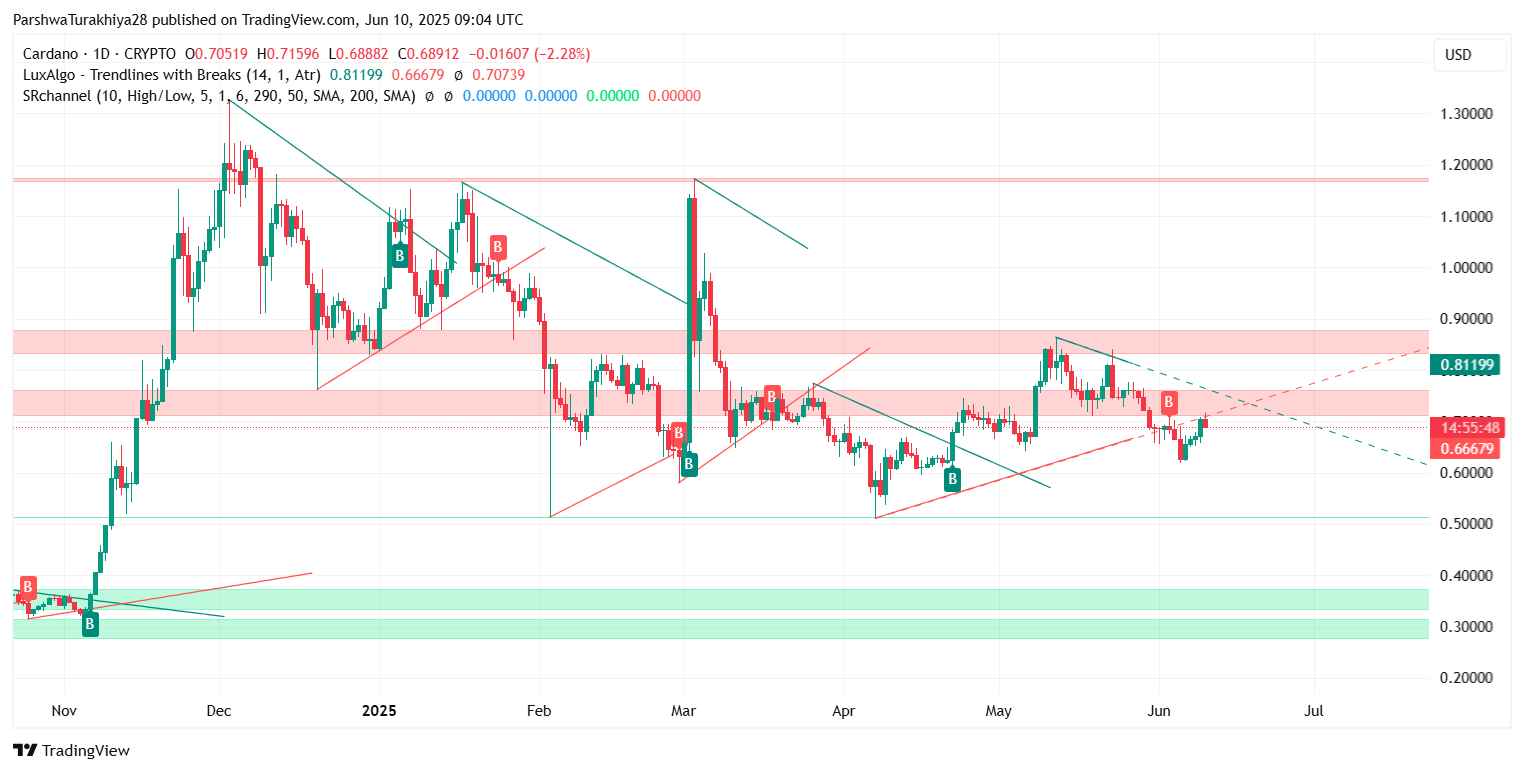
The Solana price action began to accelerate upward on June 9 after bulls defended the $144–$152 support cluster. This level had previously served as a macro demand zone, as seen on the daily chart. Price pushed sharply higher, breaking above the descending trendline and reclaiming the 100 EMA near $158.
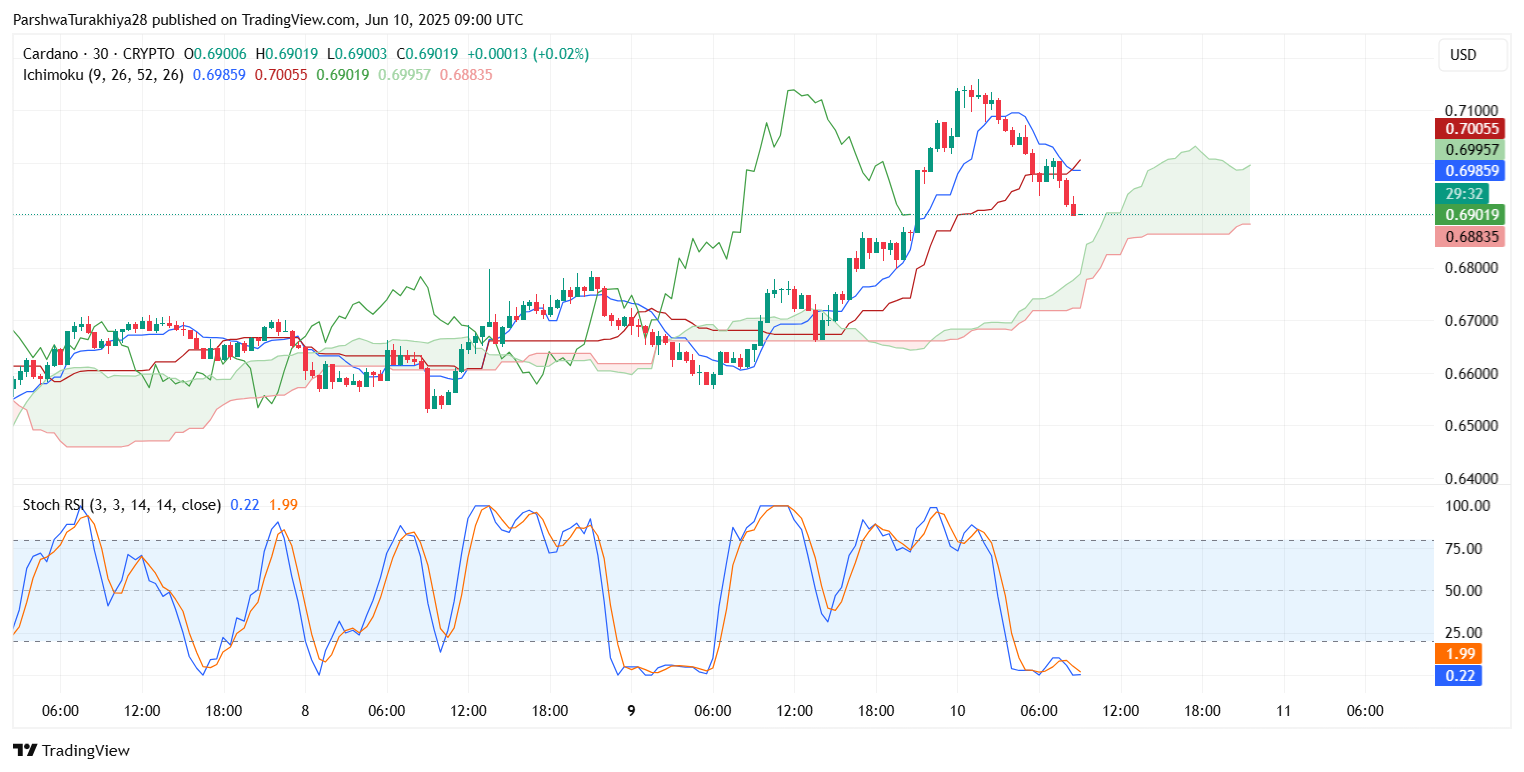
On the 30-minute Ichimoku chart, price is now testing the flat Kijun-Sen at $158.72 while holding just above the cloud base. Both Tenkan-Sen and Kijun-Sen are turning flat, suggesting short-term indecision. However, the breakout remains structurally intact as long as SOL holds above the cloud.
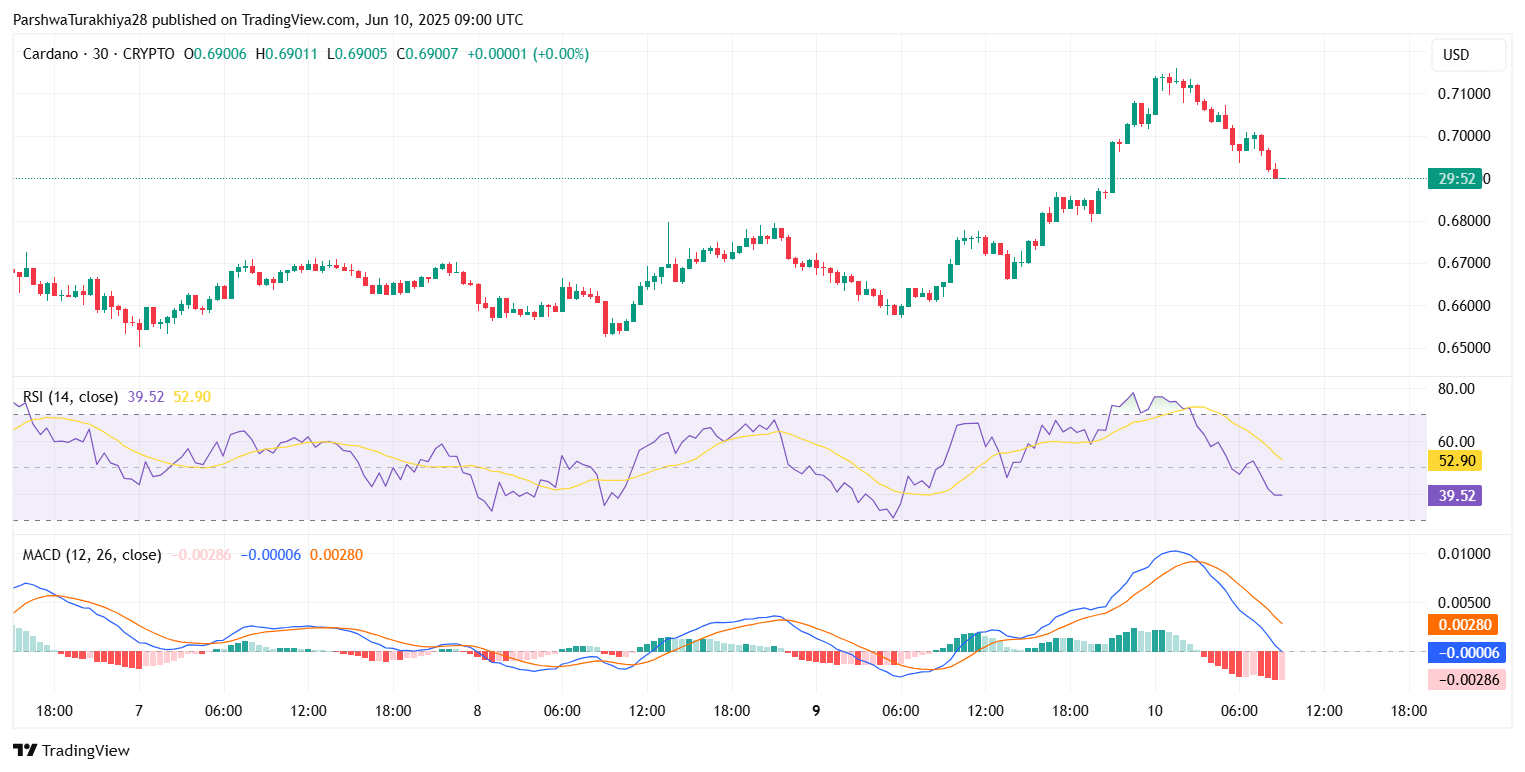
The RSI is currently neutral at 53.01, while the MACD has flipped mildly positive on the 30-minute timeframe. These indicators reflect a stalling but still constructive trend. Meanwhile, the Stoch RSI has begun to rise from deeply oversold conditions (29.75/14.13), hinting at a possible second leg higher — if resistance is broken.
Why Solana Price Going Up Today?
The primary driver behind why Solana price going up today is the breakout from the multi-session downtrend and bullish reclaim of the $152 support. This zone had previously acted as a strong base during late May, and bulls stepped in once again after a rejection near $144 last week.
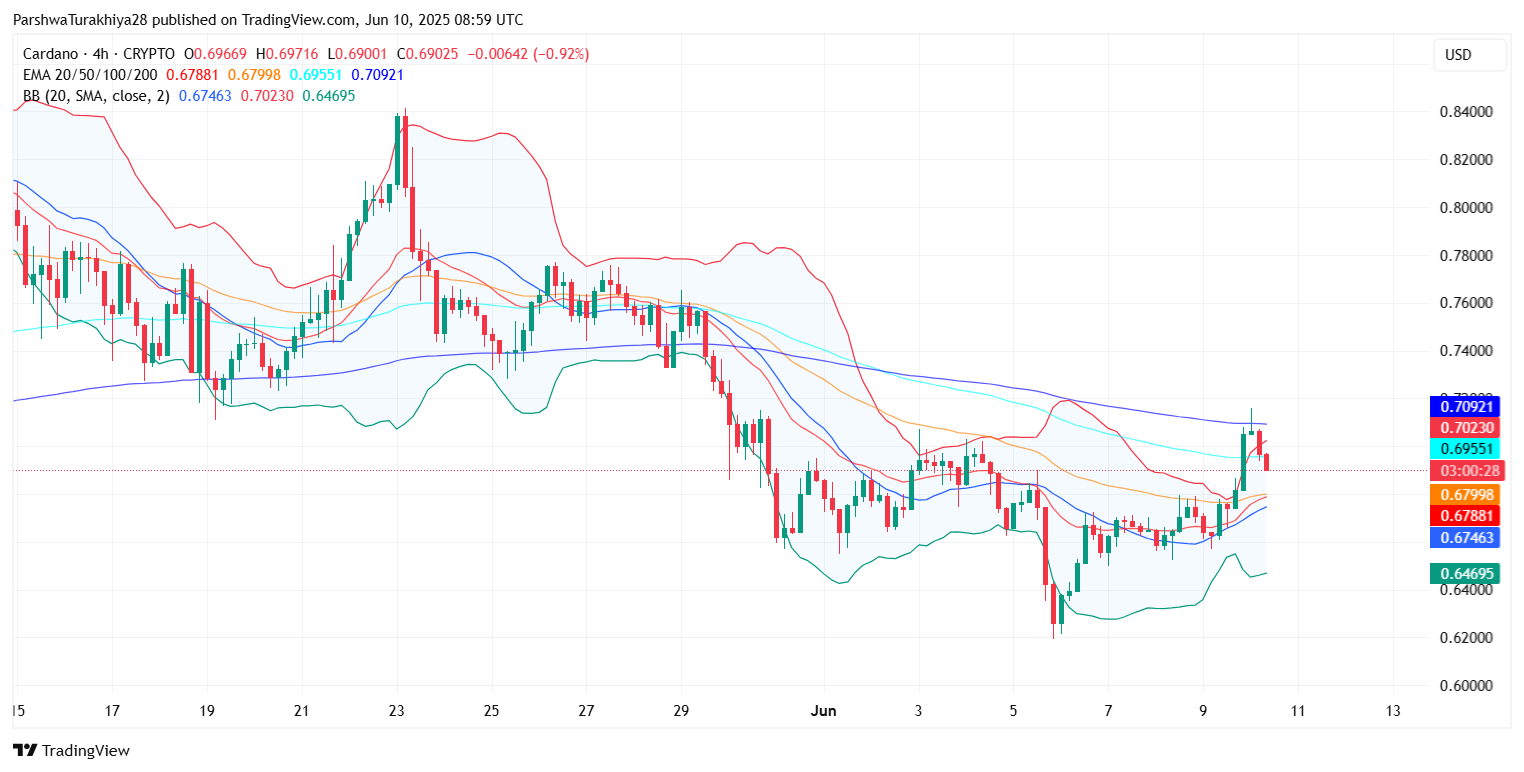
This technical breakout coincided with broader altcoin recovery in the market, propelling Solana price spikes through key moving averages including the EMA20, EMA50, and EMA100 on the 4-hour chart. Price also tagged the upper Bollinger Band near $160.58 before pulling back — a typical reaction after a sharp leg up.
While short-term charts suggest momentum is slowing, there are no signs yet of a full trend reversal, particularly as Solana price continues to trade above all major EMAs and the Ichimoku cloud on multiple timeframes.
Solana Price Update: Will Bulls Clear $161?
The next test for bulls is a clean break above $161.60, which marks the upper edge of the grey resistance band visible on both intraday and daily charts. This region has capped price action multiple times since late April. A close above this level would shift near-term market structure in favor of buyers and potentially ignite a larger rally toward $171.65 (Fib 0.5 retracement on the weekly chart).
Conversely, failure to break above $161 may trigger another retest of the $152–$155 support area. This zone coincides with the lower Bollinger Band midline and the ascending trendline that formed after the June 5 reversal.
In the broader context, the weekly Fibonacci chart shows Solana price consolidating above the 0.236 retracement at $142.48, but still well below the major 0.5 and 0.618 retracement levels at $171 and $218 respectively. A decisive move above $161 is necessary to initiate a fresh bullish wave.
Short-Term Forecast: Solana Remains at a Pivotal Level
With mixed RSI-MACD dynamics and Solana price volatility returning, traders should watch the $158–$161 zone closely for breakout or rejection confirmation. A sustained rally above $161 would target $171 and possibly $185 next. On the downside, a failure to hold $152 could risk a retest of $144.
Overall, the Solana price update for June 11 highlights an encouraging recovery with upside potential — but bullish conviction needs to strengthen with volume and a clear break above resistance.
SOL Forecast Table: June 11, 2025
| Indicator/Zone | Level (USD) | Signal |
| Resistance 1 | 161.60 | Local high, key breakout barrier |
| Resistance 2 | 171.65 | Weekly Fib 0.5 retracement |
| Support 1 | 155.01 | EMA50 and Bollinger midline (4H) |
| Support 2 | 152.62 | Trendline and demand block |
| Weekly Fib Level | 142.48 | Major macro support |
| MACD (30-min) | Mildly Bullish | Weak upward momentum |
| RSI (30-min) | 53.01 | Neutral, potential for continuation |
| Stoch RSI (30-min) | 29.75 / 14.13 | Rising from oversold |
| Ichimoku Cloud Base (30-min) | 158.26 | Holding above cloud support |
| Bollinger Band Upper (4H) | 160.58 | Rejection zone |
Disclaimer: The information presented in this article is for informational and educational purposes only. The article does not constitute financial advice or advice of any kind. Coin Edition is not responsible for any losses incurred as a result of the utilization of content, products, or services mentioned. Readers are advised to exercise caution before taking any action related to the company.