Dogecoin trades within a falling wedge pattern, with key resistance at $0.20.
While technical indicators remain bullish, rising liquidations and declining open interest suggest growing market caution. As major cryptocurrencies like Bitcoin and Ethereum remain uncertain, Dogecoin’s technical outlook hints at a potential breakout rally.
Can DOGE rally to reach the $0.20 psychological level in an attempt to recover from Thursday’s crash?
Dogecoin Price Analysis
On the 4-hour chart, Dogecoin is forming a falling wedge pattern amid its recent downtrend. Currently, DOGE is trading near the upper boundary of the pattern, with lower support at $0.1795.
Despite bullish efforts, Dogecoin is down nearly 1% today, raising the risk of a potential decline within the wedge pattern. However, technical indicators such as the RSI and MACD remain optimistic, as DOGE holds onto its weekly gains.
The RSI, currently at 44, hovers near the midpoint after bouncing from the oversold region. Meanwhile, the MACD and signal lines are trending positively toward the zero line.
That said, the MACD also warns of a potential bearish crossover as the price consolidates further.
Based on price action, a breakout above the wedge’s upper boundary could challenge the $0.20 psychological resistance, followed by the $0.22 supply zone.
Conversely, a close below the $0.1795 support on the 4-hour chart could drive Dogecoin toward the $0.1641 level.
Optimism Drops in Dogecoin Derivatives
As Dogecoin sits at a critical juncture, optimism appears to be fading in the derivatives market. According to CoinGlass, open interest has declined by 1.44%, falling to $1.90 billion.
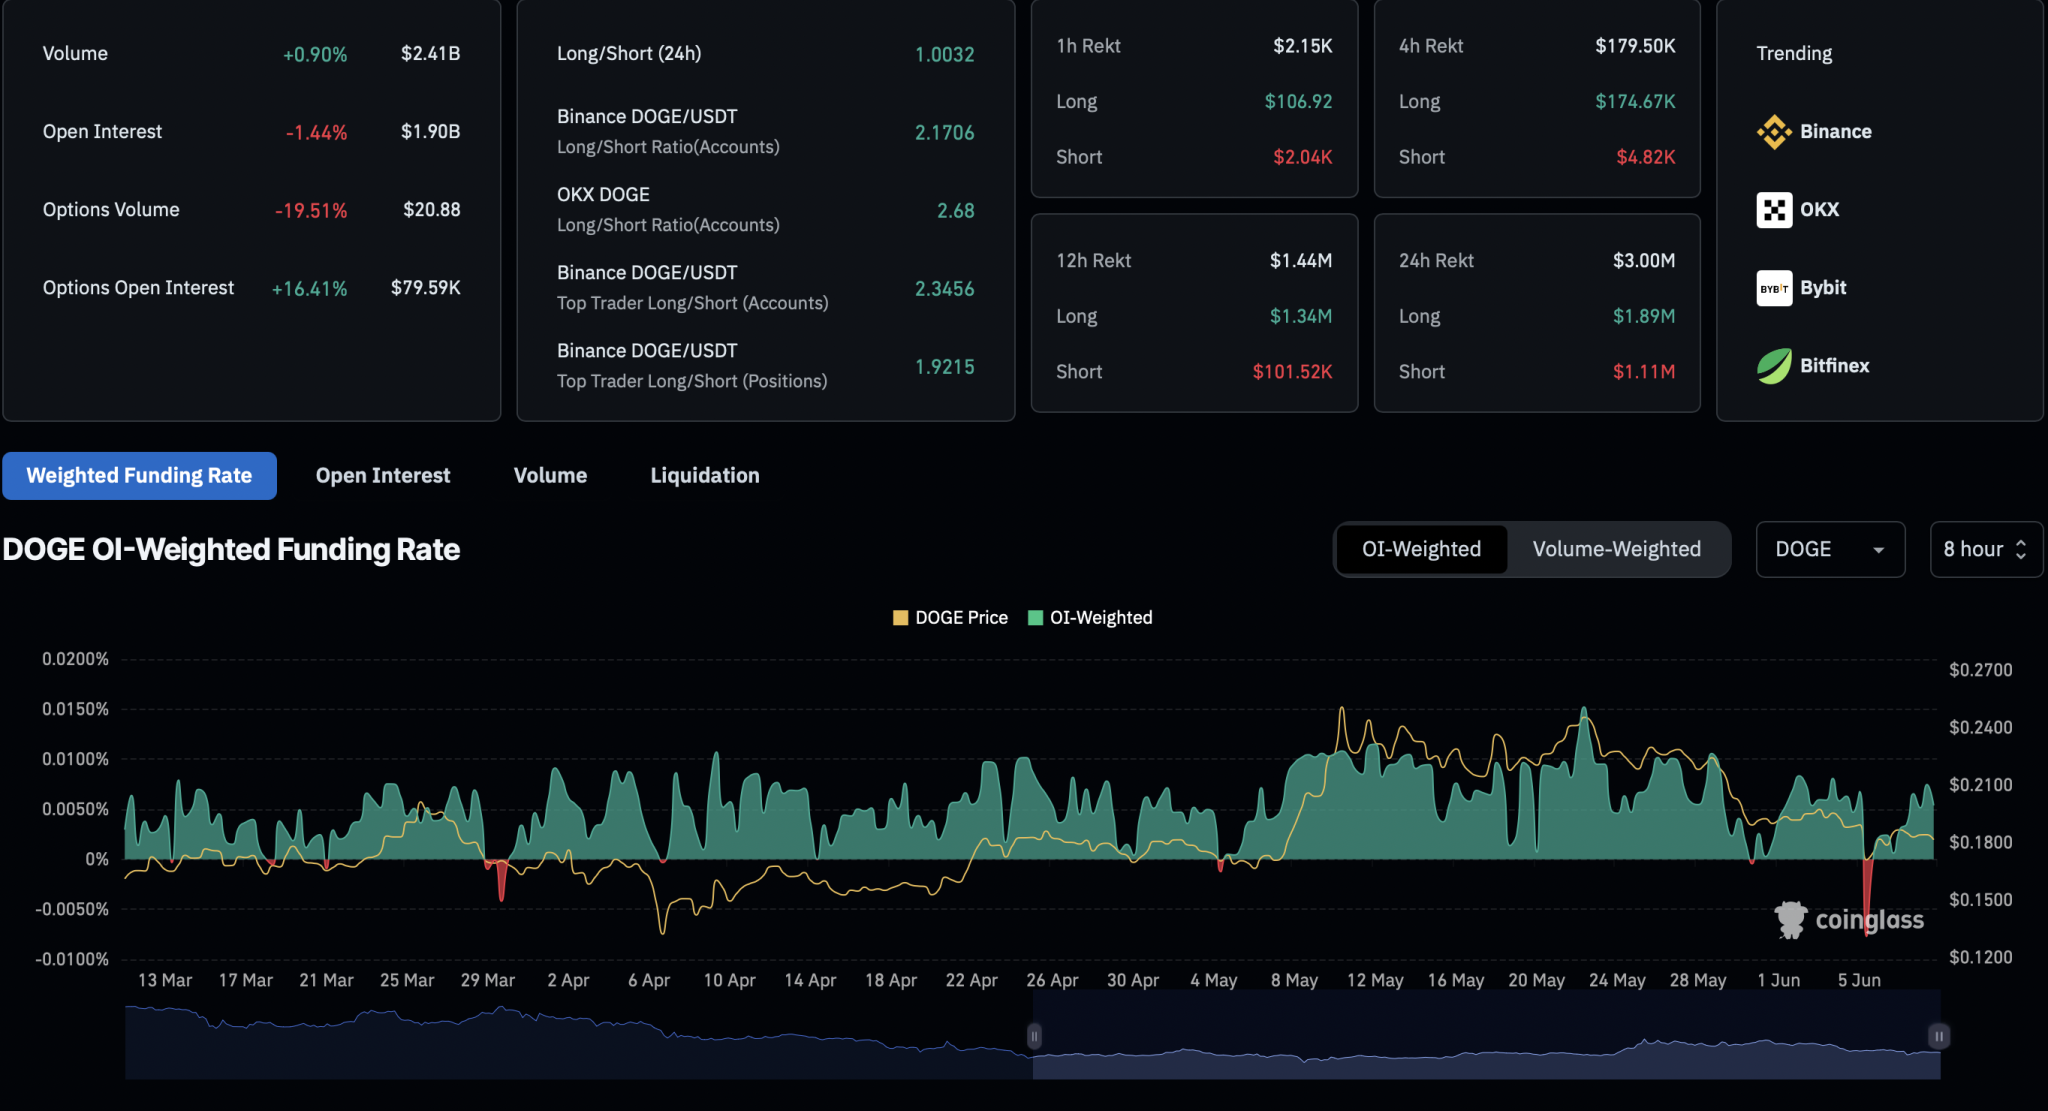
Additionally, 24-hour liquidations have surged to $3 million, with long positions accounting for $1.89 million, indicating that more bullish traders were liquidated amid recent volatility.
Bullish sentiment continues to decline, as the OI-weighted funding rate has dropped to 0.0054%, down from a peak of 0.0075% in the past 8 hours.
However, the long-to-short ratio remains balanced at 1.0032 over the past 24 hours, signaling an equal number of bullish and bearish positions.