The recent recovery in XRP price faced a notable rejection near the $2.28 mark, with bulls struggling to maintain momentum above key resistance. While XRP price today sits near $2.22 at the time of writing, broader market cues and fresh downside pressure have shifted short-term sentiment. The question now is whether this pullback marks a healthy retest—or the start of another downward move.
What’s Happening With XRP’s Price?
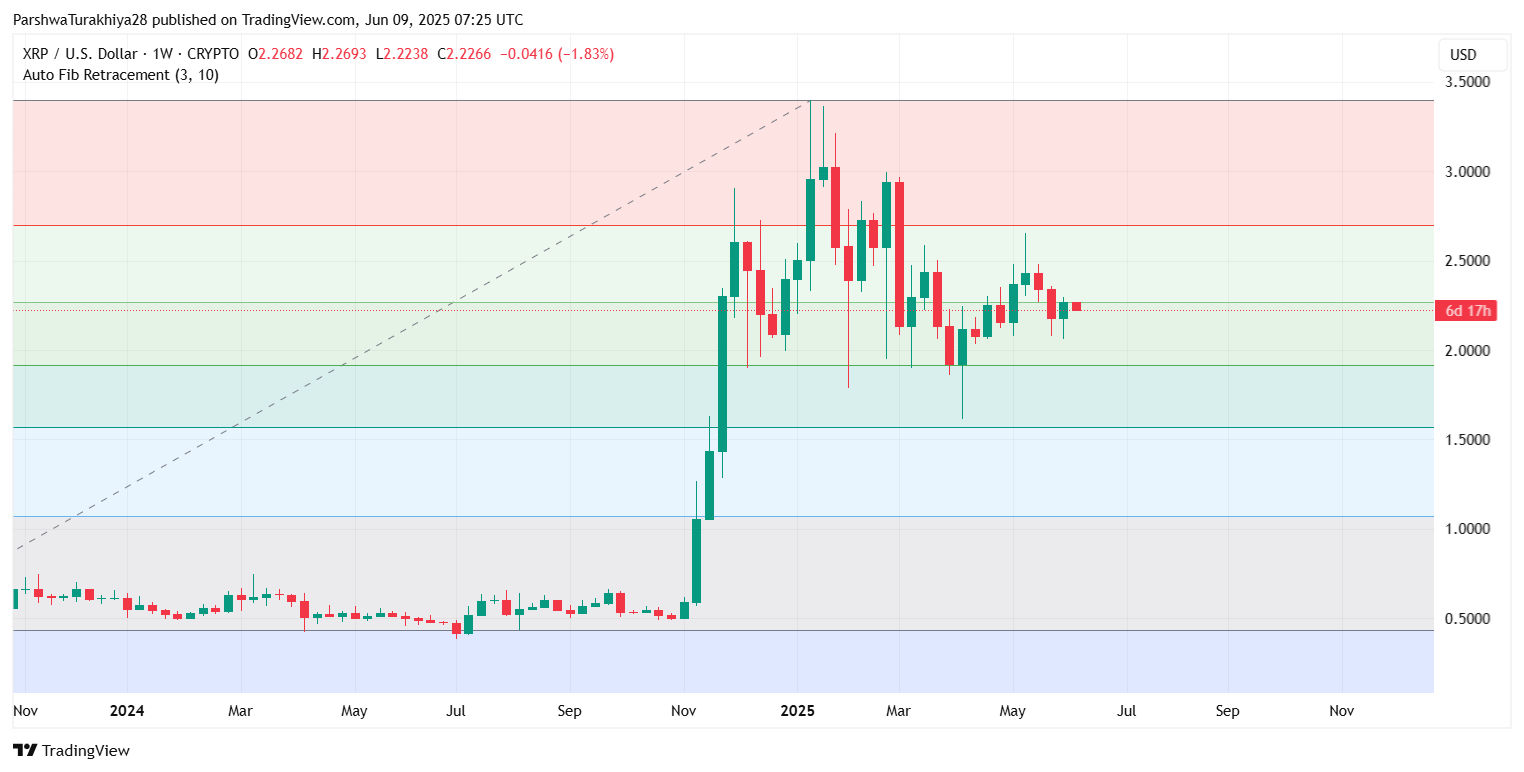
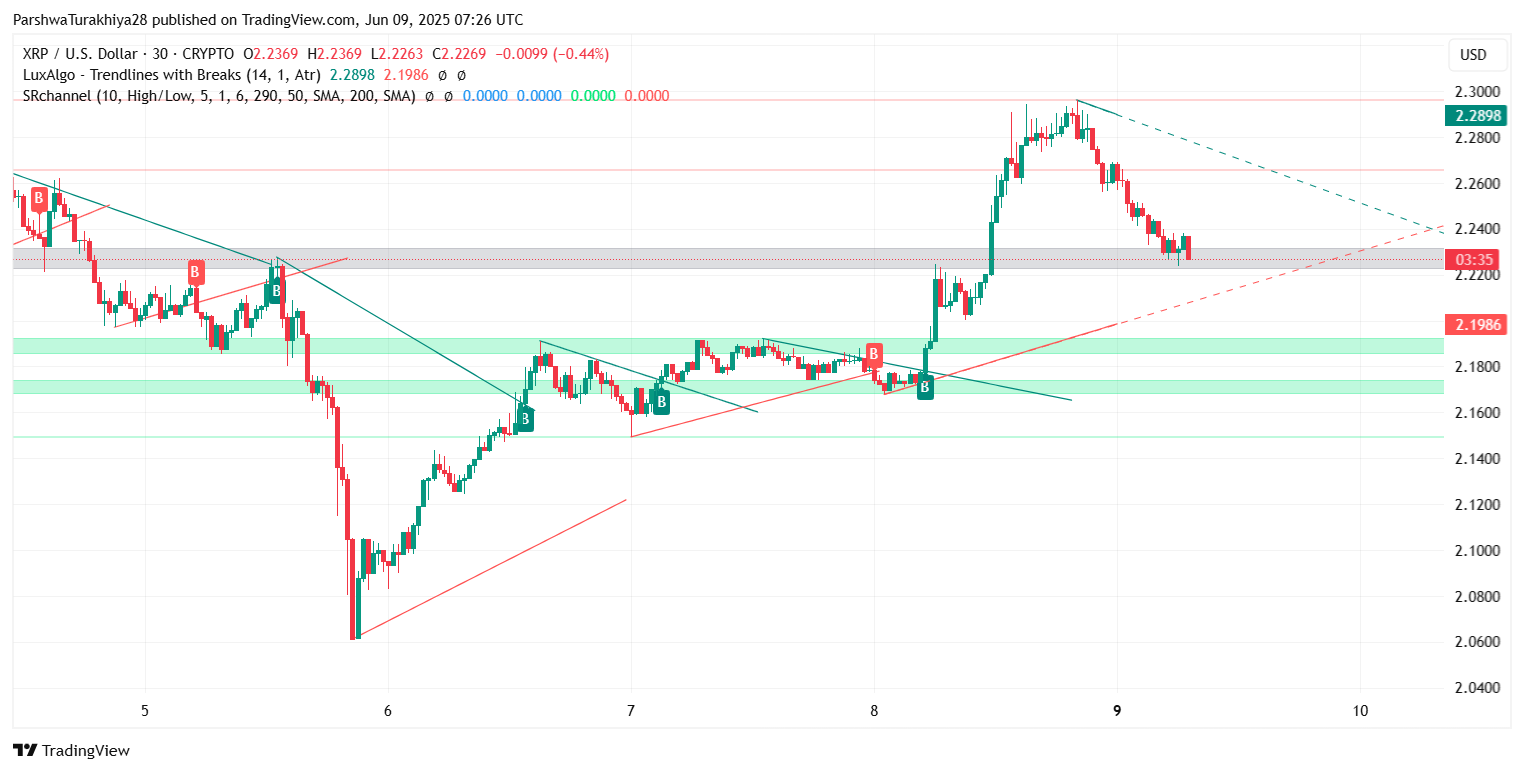
After a brief breakout attempt above the descending trendline, XRP price action saw a swift pullback from $2.30, reversing gains amid rising supply zones. The weekly chart reveals a series of lower highs since March, with XRP consistently failing to reclaim the 0.618 Fibonacci level near $2.60. On the weekly Fibonacci retracement, XRP continues to consolidate between the 0.5 level ($2.27) and the 0.382 retracement near $2.06, with bulls defending the lower bound for now.
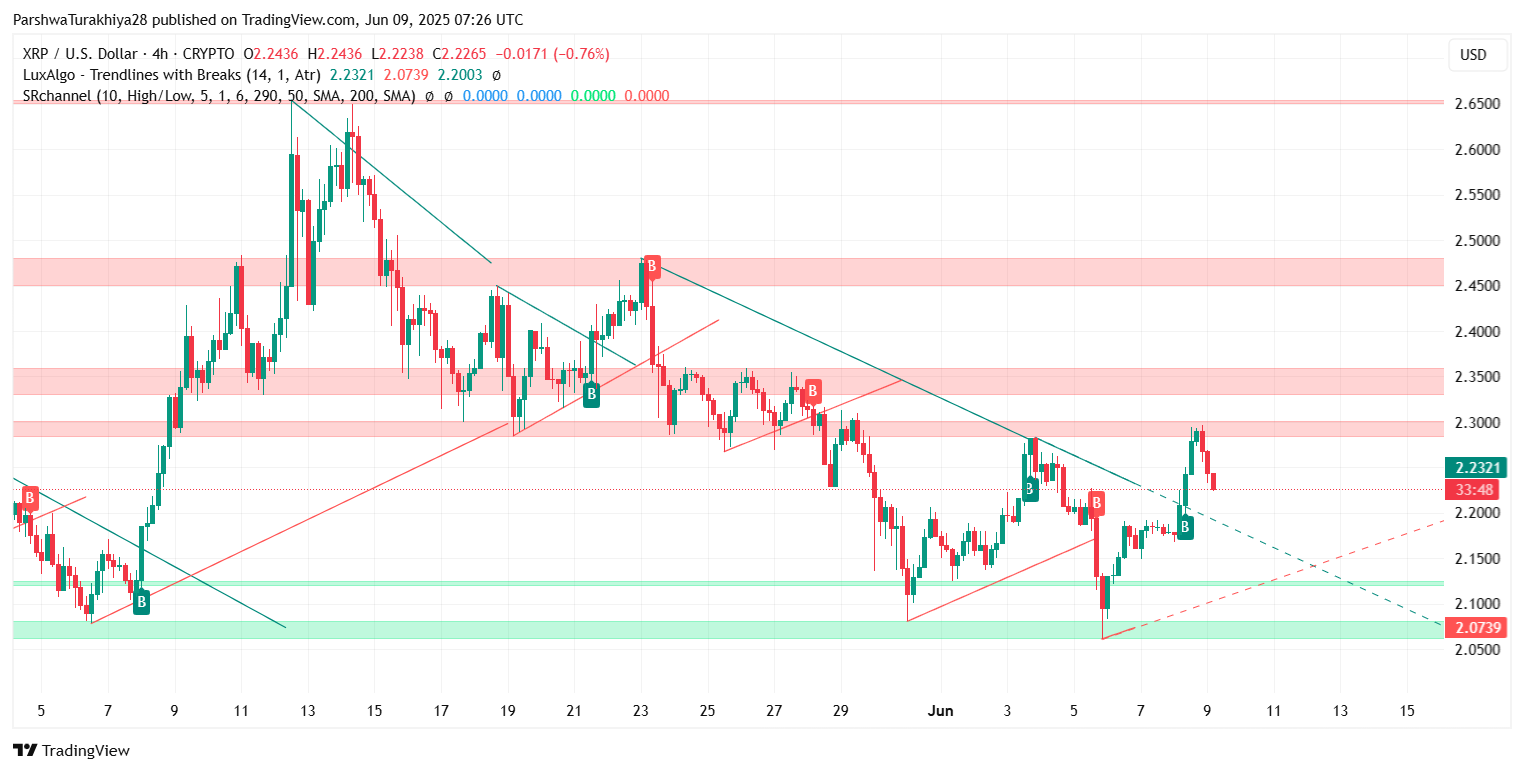
On the 4-hour chart, XRP touched an intraday high of $2.2898 before sliding back below the trendline resistance. Price is now testing the previous breakout region near $2.22–$2.20. If this zone holds as support, the bullish structure could still remain intact. A break below it, however, could reintroduce downside pressure targeting $2.17 and $2.07.
RSI, MACD Show Fading Momentum on Lower Timeframes

Short-term indicators suggest weakening bullish control. The Relative Strength Index (RSI) on the 30-minute chart has dropped sharply from overbought levels and is now hovering around 36, indicating fading momentum. The MACD histogram also shows negative divergence, with bearish crossover signals aligning with the latest rejection from resistance.

On the 4-hour view, Bollinger Bands are narrowing after a volatility spike, and price is once again below the 100-EMA ($2.23), which may act as short-term resistance. The 200-EMA near $2.25 marks a critical zone for any bullish continuation.
These signals contribute to increased XRP price volatility, suggesting traders may be rotating out of high-beta assets like XRP amid market indecision.
Ichimoku and Trendlines Highlight Key Decision Zone
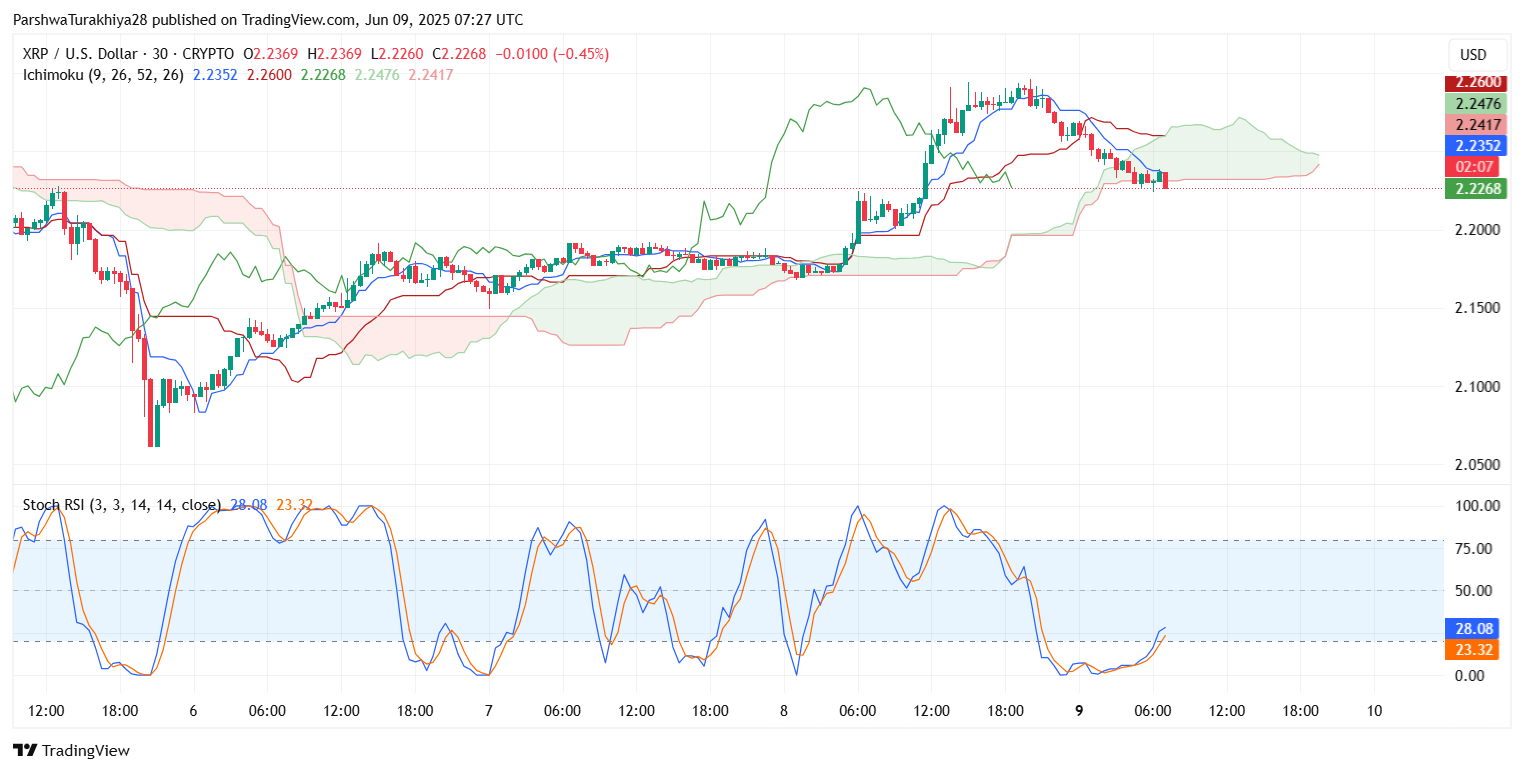
The Ichimoku Cloud on the 30-minute timeframe shows price slipping into the cloud from above. The Tenkan-sen and Kijun-sen lines have crossed bearishly, while the price hovers around the cloud’s flat top near $2.22. This zone now serves as an equilibrium point, where a breakdown could quickly push XRP toward the green support region around $2.07.
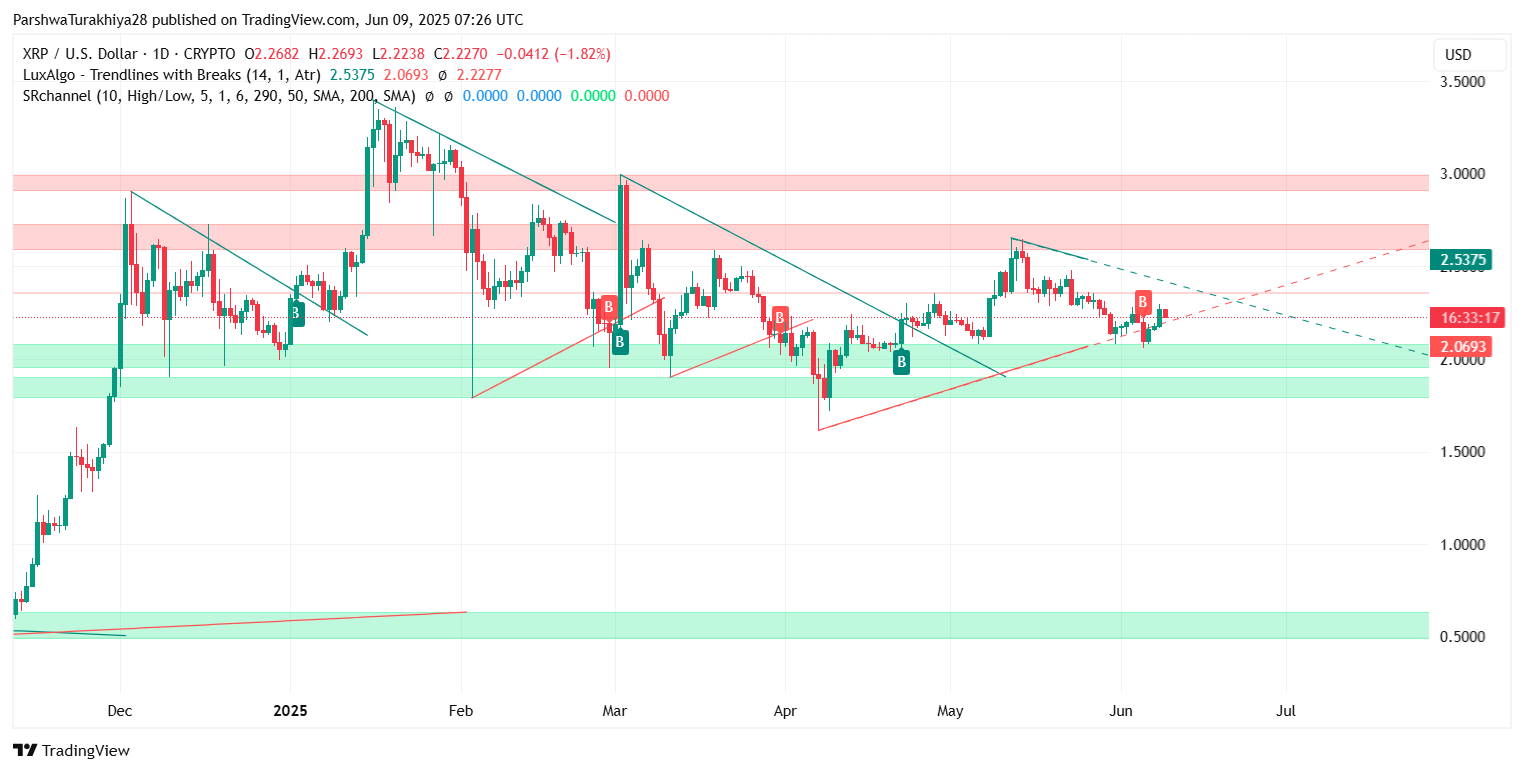
On the 1-day chart, the downtrend remains structurally intact unless bulls clear the $2.53 resistance zone, which aligns with the upper boundary of the broader descending triangle. Until then, any relief rallies are likely to be short-lived.
Why XRP Price Going Down Today
The immediate answer to why XRP price going down today lies in the sharp rejection from resistance, along with weakening technical indicators and the failure to maintain momentum above $2.25. In addition, broader risk-off sentiment in crypto markets—especially following Bitcoin’s failure to reclaim $71,000—has weighed on altcoins like XRP.
Another bearish element is the increasing friction near the $2.30 zone, which aligns with prior supply areas. Traders are viewing these rallies as opportunities to exit positions rather than initiate new ones, resulting in increased overhead pressure.
Short-Term XRP Price Forecast and Key Levels
The near-term XRP price update remains cautious. A breakdown below $2.20 could accelerate losses toward $2.07–$2.05, where previous support held firm last week. On the flip side, a recovery above $2.26 and sustained strength over $2.30 would open up a path toward $2.35 and $2.53.
A bullish continuation remains possible, but the current XRP price action must invalidate the recent bearish rejection by reclaiming lost ground quickly. If not, the trend may continue to drift sideways to lower.
XRP Technical Forecast Table
| Technical Indicator | June 9 Forecast | Bias |
| Resistance Levels | $2.26, $2.30, $2.35 | Bearish rejection from $2.30 |
| Support Levels | $2.20, $2.07, $1.98 | Holding $2.20 is key to upside chances |
| RSI (30-min) | 36.09 | Bearish |
| MACD (30-min) | Bearish crossover | Bearish |
| Bollinger Bands (4h) | Narrowing | Low volatility phase returning |
| Ichimoku Cloud (30m) | Price inside cloud | Neutral, watch for breakdown |
| EMAs (4h) | Below 100/200 EMA | Bearish |
| Fib Levels (Weekly) | Holding above 0.382 ($2.06) | Neutral bias |
While XRP showed signs of breakout strength earlier in the week, today’s rejection near $2.28 raises caution. Holding $2.20 is essential to preserving the short-term bullish case. If broken, XRP price could retest deeper support near $2.07. Until bulls reclaim control above $2.30, the trend remains neutral to slightly bearish.
Disclaimer: The information presented in this article is for informational and educational purposes only. The article does not constitute financial advice or advice of any kind. Coin Edition is not responsible for any losses incurred as a result of the utilization of content, products, or services mentioned. Readers are advised to exercise caution before taking any action related to the company.