Perhaps one of the most pivotal points in Shiba Inu's recent market history is about to happen. The meme token is showing indications that a breakout might be closer than it appears, not on the surface but underneath, despite its lackluster price action over the past few weeks.
SHIB's price has been trapped below significant resistance levels such as the 100 and 200 day moving averages. SHIB is trading at about $0.0000125 at the time of writing, which is just above the crucial structural and psychological support level of $0.0000120. This level has been tested numerous times in the past, so a significant bounce here might signal a local reversal.
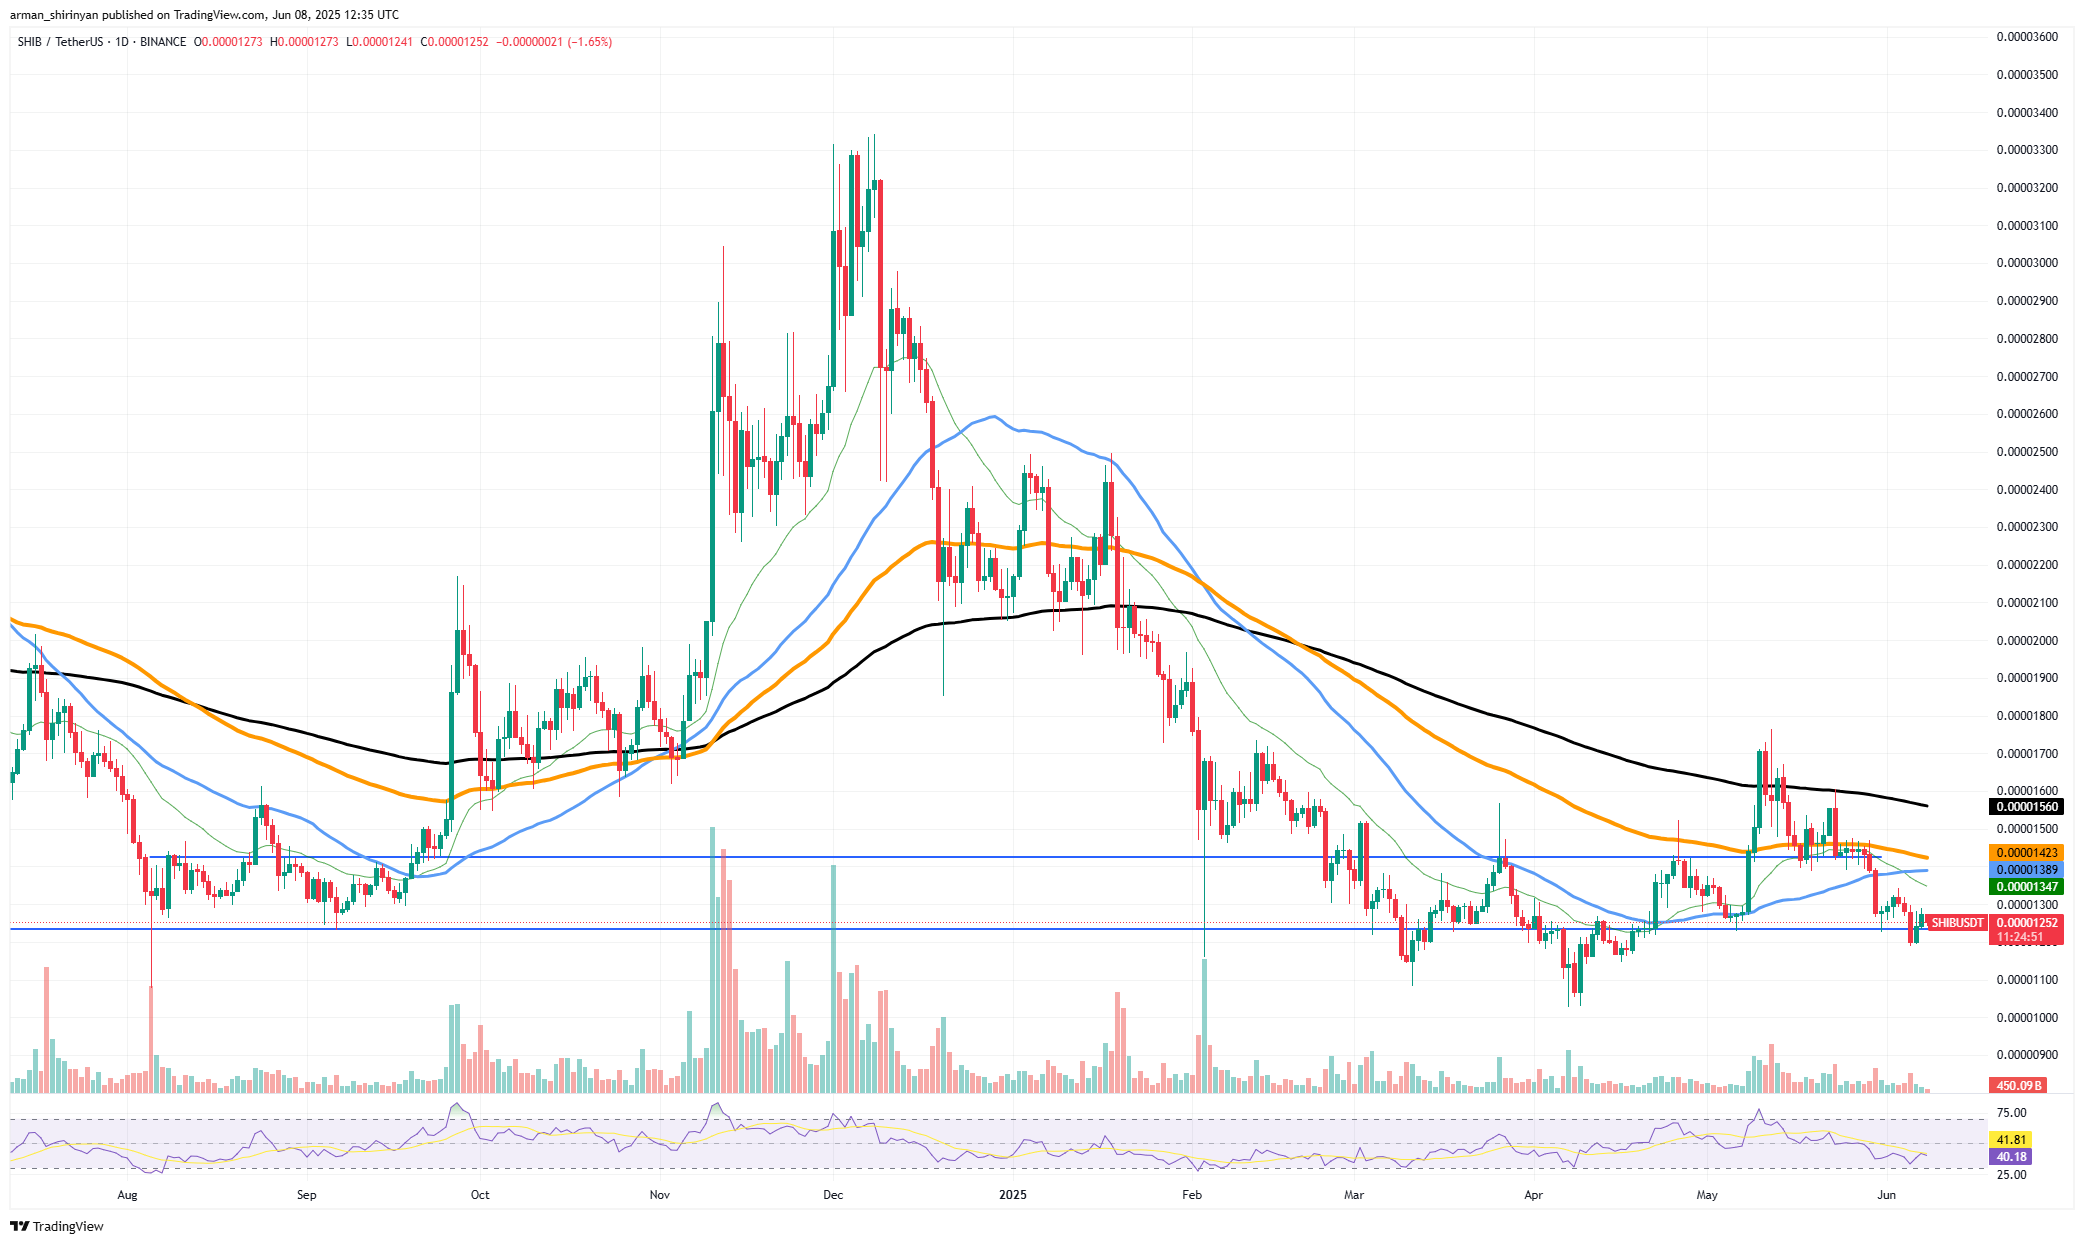
SHIB isn't in overheated territory and still has room to run, according to the RSI, which is close to 40. Here's the shocking part though: SHIB's on-chain data indicates a sharp increase in the volume of large transactions. A six-month high of over 24 trillion SHIB was transferred through whale transactions on June 5, according to IntoTheBlock. This indicates a major accumulation or redistribution event, especially when combined with more than 500 large transactions in a single day.
A reversal or rally is frequently hinted at when such a high volume changes hands as the price consolidates close to support. Here's where the big chance is relevant. Momentum may shift if SHIB can hold support above $0.0000120 and recover the resistance range of $0.0000134-$0.0000138.
Depending on new capital inflows and improved market sentiment, a successful breakout could result in a rise toward $0.0000155 and beyond. Traders and investors should keep a close eye on this setup. The combination of technical support and robust whale activity offers SHIB its best chance in weeks to overcome stagnation and resume an upward trajectory, but it does not ensure a breakout.
XRP's unexpected plunge
Investors should prepare for surprises as XRP is showing indications of impending volatility. The asset has reached a crucial point on the chart following a period of sideways movement and waning momentum, and it may not remain there for long. A descending trendline that had been holding down the price since early May was recently broken by XRP from a technical perspective.
A potential change in sentiment is suggested by this breakout and a bounce from the 200 EMA. For a short-term rally toward $2.25 and $2.30, the price is currently trading at about $2.14, just above significant moving averages like the 50 and 100 EMA, which may serve as both support and launching pads. The true wild card in this situation though is off the chart. On-chain metrics, which are not displayed in the current image but are pertinent for context, indicate that the volume of large transactions has drastically decreased in recent days.
There might be a brief lull before the storm due to this decline in whale activity. Historically, either as a result of aggressive sell-offs or strategic accumulation, these quiet periods from major holders typically precede sharp moves. The bottom RSI indicator is moderately strong, indicating that there is still room for upward price movement and that the asset is not overbought.
In addition to a confirmed descending resistance breakout and increasing support at the long-term moving average, the setup is ready for volatility. XRP seems poised for a move that might surprise a lot of people. The waning whale activity might just be a brief hiatus before major players return and forcefully influence price action. It is possible that the upside breakout scenario will prevail if the asset continues to move above $2.08-$2.10.
Bitcoin at locals
Following a brief recovery, Bitcoin is testing a local resistance zone and flirting with uncertainty once more. The asset is currently trading at about $105,500, and although the short-term trend indicates consolidation, the longer-term outlook points to possible turbulence, especially if Bitcoin is unable to maintain above important levels.
According to the chart, Bitcoin is currently trading close to the upper end of a recently formed ascending trendline, but it is also running into significant resistance just below the $108,000 mark, which served as a rejection point during its previous unsuccessful breakout attempt.
A correction could easily push the asset below $100,000, retesting psychological and technical support levels as momentum seems to be waning. Price action has so far respected the 50 EMA (blue), which is currently serving as dynamic support. But any decline below this moving average, particularly on a daily close, would cause sentiment to change and pave the way for a more significant decline toward the $98,000-$96,000 range, where the 100 EMA is waiting.
The next significant target for bears may be the 200 EMA close to $91,700 if that level also breaks. There is still not much volume, which suggests that neither side is very convinced. The RSI has also been unable to generate any significant upward momentum, remaining in the mid-range region with no discernible bullish divergence.