Shiba Inu price has shown signs of a potential long-term trend reversal, according to a recent technical analysis by crypto market analyst Javon Marks.
While the price of SHIB currently stands at $0.00001322—marking a 2.71% increase over the past 24 hours and an 8.70% decline in the last week—the broader focus is on a chart pattern developing since 2022.
According to Marks, the formation of an Inverse Head and Shoulders pattern across this extended timeline could indicate a significant technical pivot for the asset. The pattern, which spans from early 2022 to mid-2025, is a bullish reversal signal typically forming after sustained downward trends.
Breakdown of Inverse Head and Shoulders Pattern
The structure of the pattern begins with the left shoulder forming in mid-2022, after a steep fall from Shiba Inu’s October 2021 all-time high of around $0.000081.
At that point, Shiba Inu price dropped to a local low near $0.0000077 in June 2022, creating a double bottom structure. This was followed by the head of the pattern, which developed after another drop around December 2022 and hit its lowest point in June 2023 at approximately $0.00000657.
Subsequently, SHIB entered a recovery phase that led to a sharp surge in March, with the price reaching a local top of $0.00003629. However, the asset later pulled back again, with notable dips in September 2024 and April 2025, forming the right shoulder of the pattern. This shoulder remains higher than the head, aligning with the typical characteristics of an Inverse Head and Shoulders structure.
Potential Confirmation and Shiba Inu Price Target
The pattern’s neckline, which serves as the breakout level, remains a key point of observation. According to the analysis, a clear move above this neckline would confirm the pattern. If that occurs, the projected Shiba Inu price target is $0.000081.
This target, based on technical measurement principles, would represent a gain of approximately 512.6% from current levels at $0.00001322. Marks notes the importance of this confirmation before any implications are drawn regarding future price movement.
On-Chain Activity Trends From IntoTheBlock
Supporting this technical structure, recent on-chain data from IntoTheBlock shows increasing network activity around SHIB. From early to mid-2025, three key metrics have recorded gains.
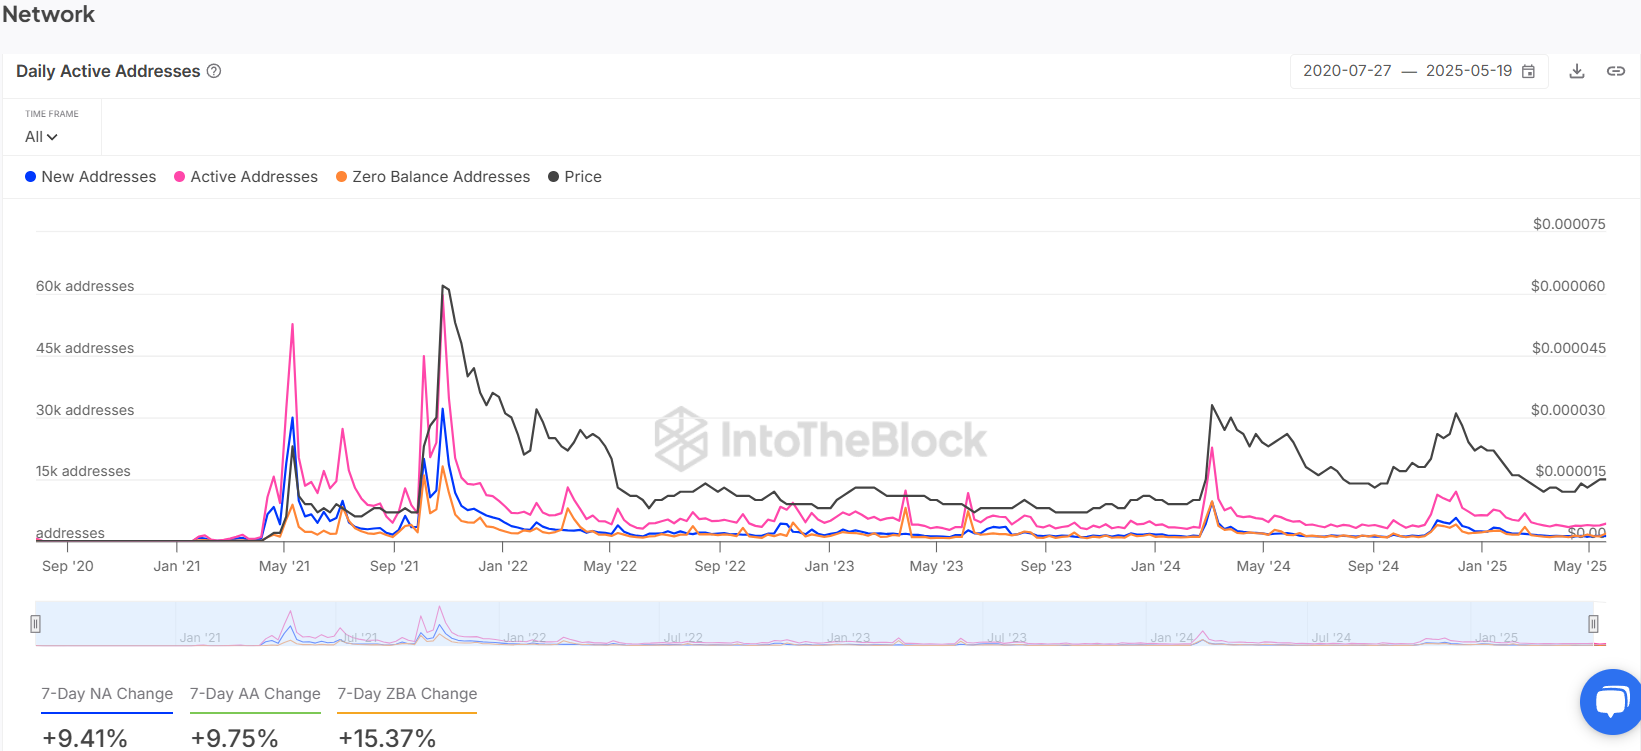
Specifically, new addresses rose by 9.41%, active addresses increased by 9.75%, and zero balance addresses climbed by 15.37%.
Importantly, this network chart is essential in supporting a bullish SHIB narrative. While the price remains below previous highs, the resurgence in new and active addresses reflects improving fundamentals and growing network traction.
Typically, spikes in address activity precede significant price movements. If this behavioral pattern holds, the recent rise in address growth could be an early indicator of another price acceleration phase.