


 15
15
- Pepe price hovers $0.000013 on Tuesday after rejecting the key resistance level last week.
- $PEPE’s momentum indicators show a bearish divergence, suggesting a possible trend reversal.
- On-chain data show bearish bets among traders reached its highest in over a month.
Pepe ($PEPE) price shows signs of bullish exhaustion on Tuesday after failing to breach a key resistance level at $0.000016 last week. The price action of the frog-themed meme coin flashes a bearish divergence on the momentum indicators, suggesting a possible trend reversal. Meanwhile, on-chain data shows an uptick in bearish sentiment, with short positions among traders climbing to the highest level in over a month, raising the odds of a potential downside move.
Pepe Price Forecast: Momentum indicators show weakness
Pepe price faced rejection around its daily level at $0.000016 on Friday and declined 12.19% until Sunday. However, it recovered slightly at the start of the week. At the time of writing on Tuesday, it hovers at $0.000013.
The Relative Strength Index (RSI) indicator reflects weakness in momentum on the daily chart. The higher high in the frog-theme meme coin formed on Friday does not reflect the RSI lower high for the same period. This development is termed a bearish divergence, often leading to a trend reversal or short-term pullback. Moreover, the Moving Average Convergence Divergence (MACD) indicator also showed a bearish crossover on Saturday, suggesting a sell signal and a correction ahead.
Coinglass’s long-to-short ratio also shows another bearish sign for $PEPE, which reads 0.86. This ratio below one reflects bearish sentiment in the markets as more traders are betting for the memecoin to fall.
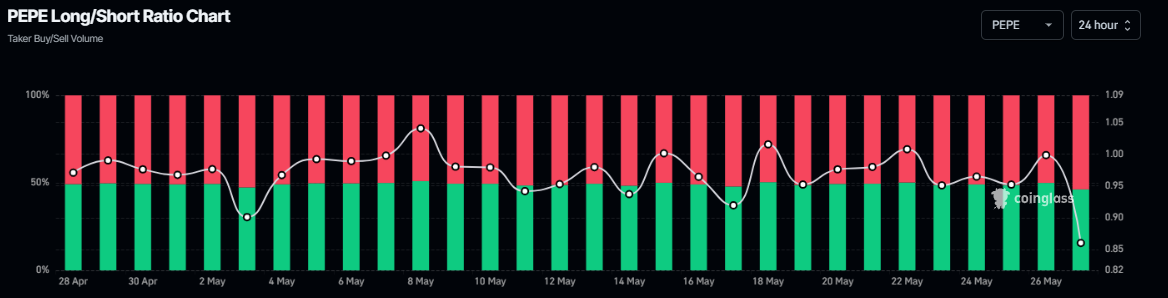
$PEPE long-to-short ratio chart. Source: Coinglass
Sideline investors looking for sell opportunities could do so at its current level at $0.000013.
If Pepe’s pullback continues, it could extend the decline to retest its next daily support at $0.000012. Any follow-through selling below this level could set off a drop to $0.000011, its 50-day Exponential Moving Average (EMA).
The bearish outlook of the Pepe meme coin remains in place as the price is below the key daily resistance level at $0.000016 on the daily chart; a close above this level would invalidate the bearish thesis.
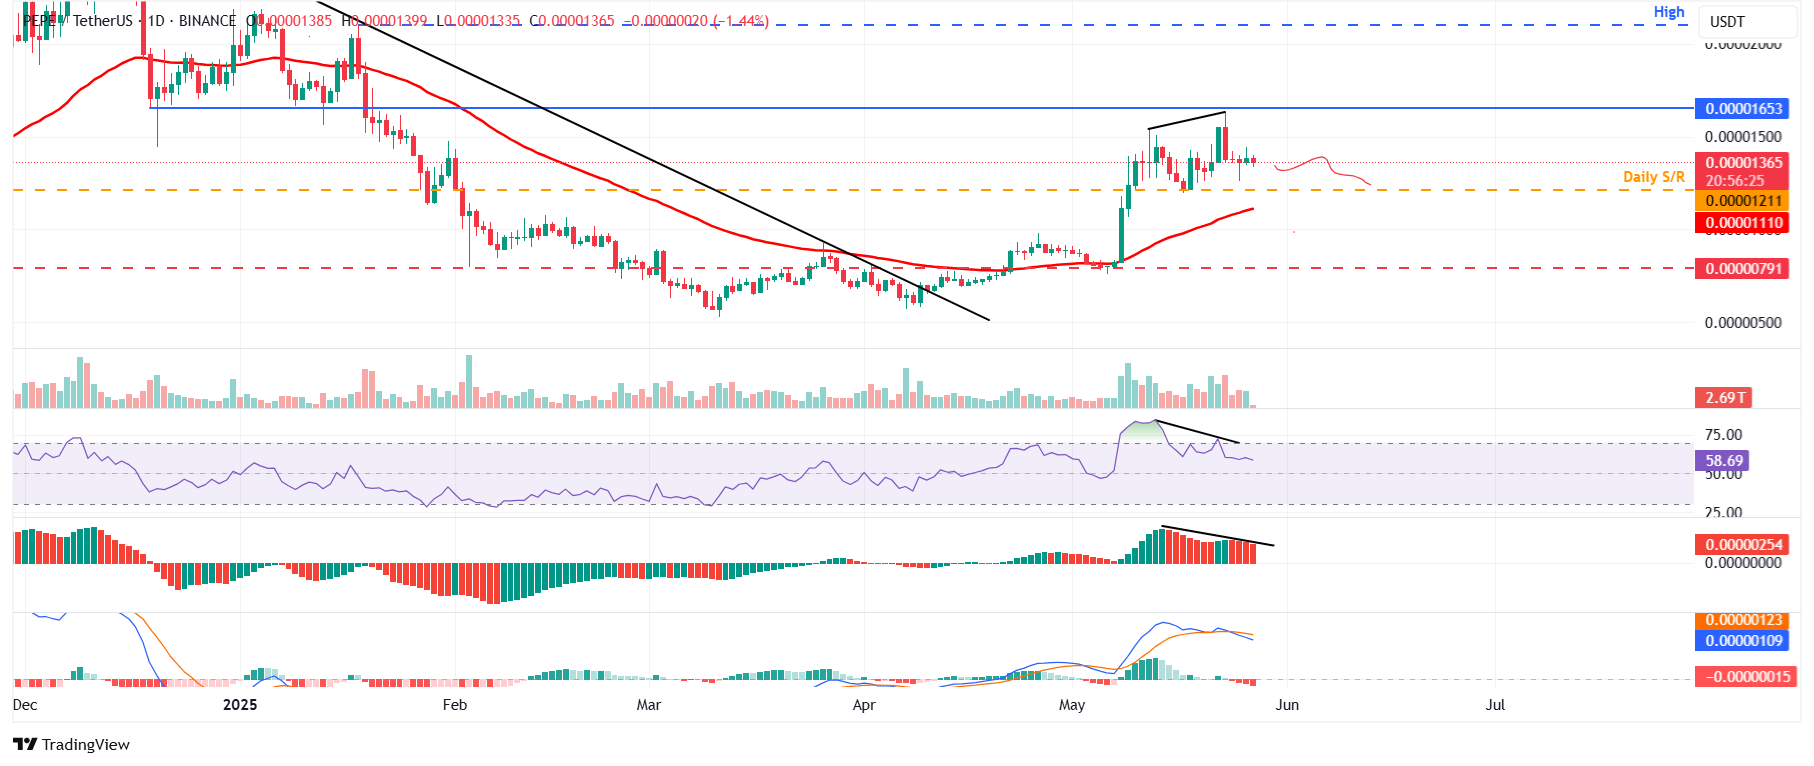
$PEPE/USDT daily chart

