

 15
15
- Quant exceeds $100 with the announcement of Overledger Fusion, the first-of-its-kind layer 2.5 network.
- Technically, the $JUP outlook suggests extended gains with a key pattern breakout.
- Four, previously known as BinaryX, leads the gaming tokens rally amid a bullish outlook.
The broader cryptocurrency market witnessed a slowdown in the top altcoins like Ethereum (ETH), Ripple (XRP), Solana (SOL), and Dogecoin (DOGE), with a 1% to 3% drop in the last 24 hours. Ignoring this, Quant ($QNT) maintains a recovery trend, with the layer 2.5 network announcement for institutions and decentralized finance (DeFi). Jupiter ($JUP) and Four ($FORM) prolong the uptrend with technical signals suggesting breakout gains.
$QNT targets 40% gains with pattern breakout
Quant records a sharp rise of 10% on Monday, surpassing the $100 psychological level. On Tuesday, the $QNT token holds $104 with no significant movement at press time.
With a bullish engulfing candle formed on Monday, the price action registers an inverted head-and-shoulders pattern breakout, as shared in the daily price chart below. This marks a potential beginning of a trend reversal rally in Quant.
Supporting the reversal thesis, the 50- and 200-day Exponential Moving Averages (EMAs) record a golden cross. Additionally, the Moving Average Convergence/Divergence (MACD) and its signal line record a positive crossover on Tuesday, suggesting a bullish trend ahead.
The 41% pattern breakout target is estimated by extrapolating the depth of the pattern to the neckline at $101, suggesting an uptrend to $143. Based on the Fibonacci retracement, from $165 on December 7 to $59.90 on April 8, the 78.6% level coincides with the $143 price target. However, minor hurdles are present at the $112 (50% level) and $125 (61.8% level).
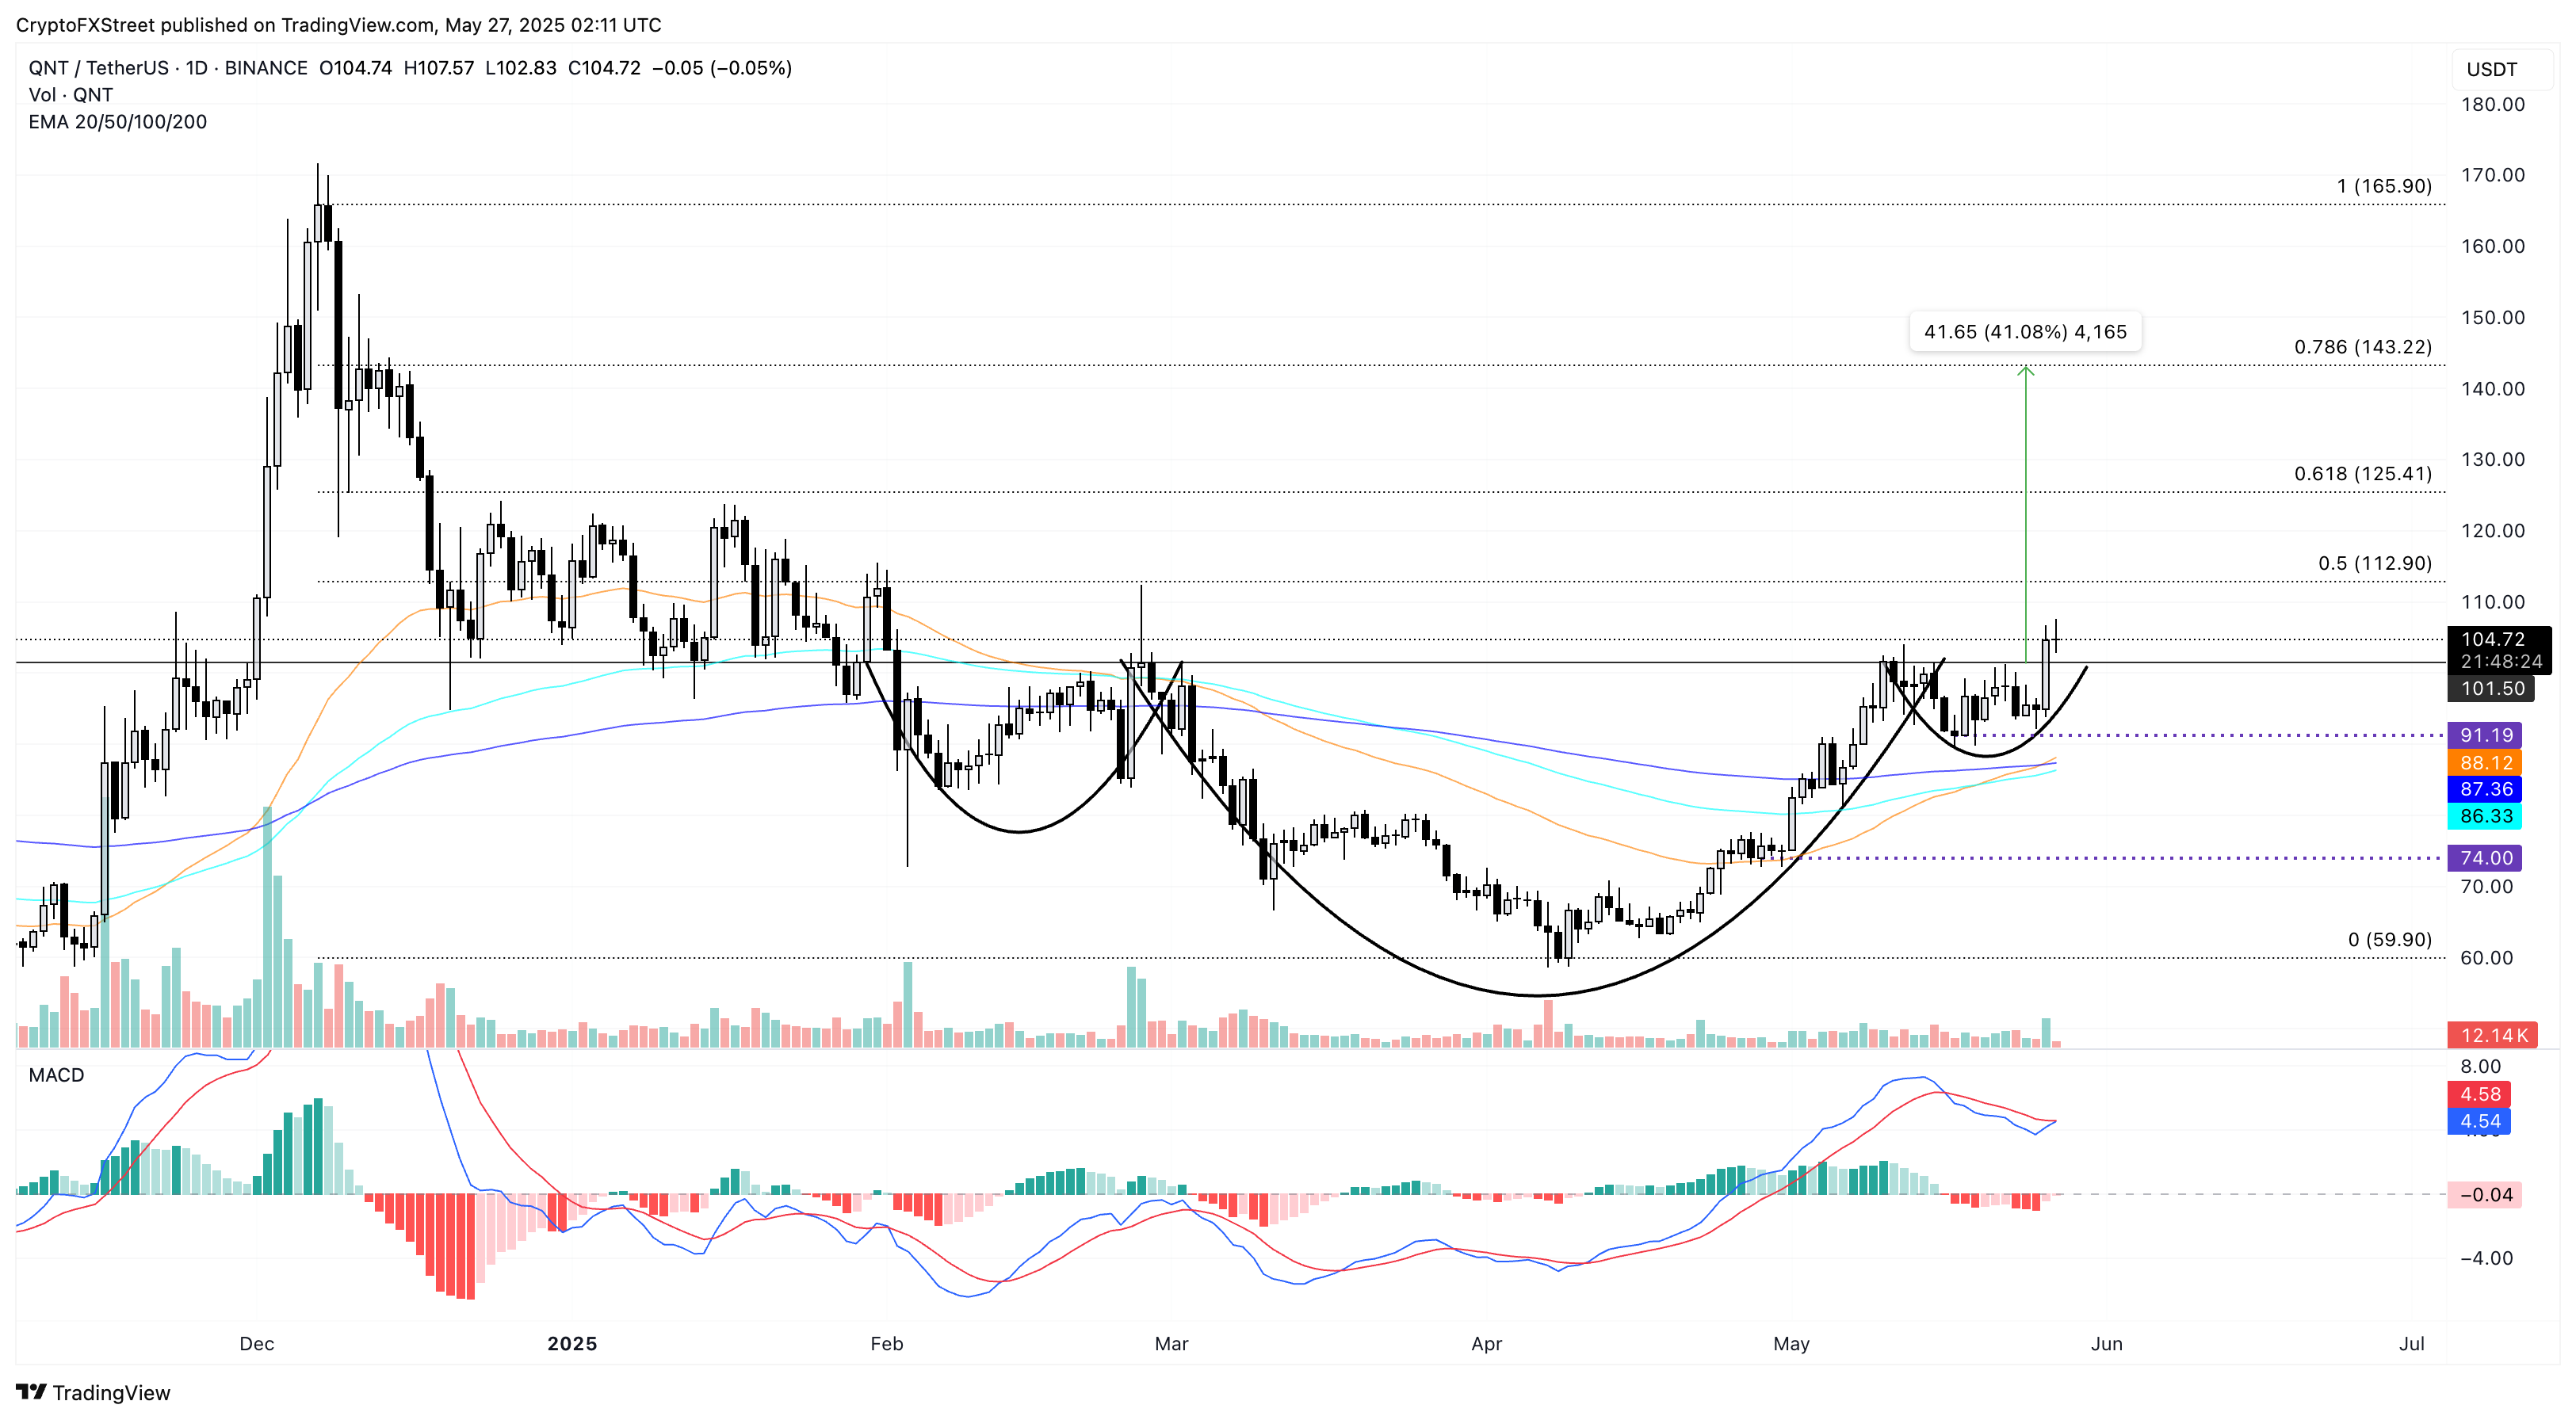
$QNT/$USDT daily price chart. Source: Tradingview
Conversely, a drop under the $100 level could invalidate the bullish pattern, extending the correction to the $91 support level.
Jupiter sustains uptrend, records rounding bottom breakout
Jupiter trades at $0.5932 with over 5% gains over the last 24 hours at press time on Tuesday. The rising $JUP token records over 26% gains this month to reclaim the $0.50 psychological level.
With a 9% jump on Monday, $JUP token exceeds $0.5839, acting as the neckline of a rounding bottom pattern shared in the daily price chart below. The extended rally holds above the 100-day EMA (light blue) at $0.5581, aiming to challenge the 200-day EMA (deep blue) at $0.6662.
The MACD indicator sustains a positive trend with its signal line after multiple fake crossovers due to a choppy uptrend in $JUP spot prices. Hence, investors must remain cautious as Jupiter nears the 200-day EMA, which could lead to volatile price movements.
With the pattern breakout, the 45% price target at $0.8480 is calculated similarly to Quant’s, close to the March 2 peak at $0.8357.
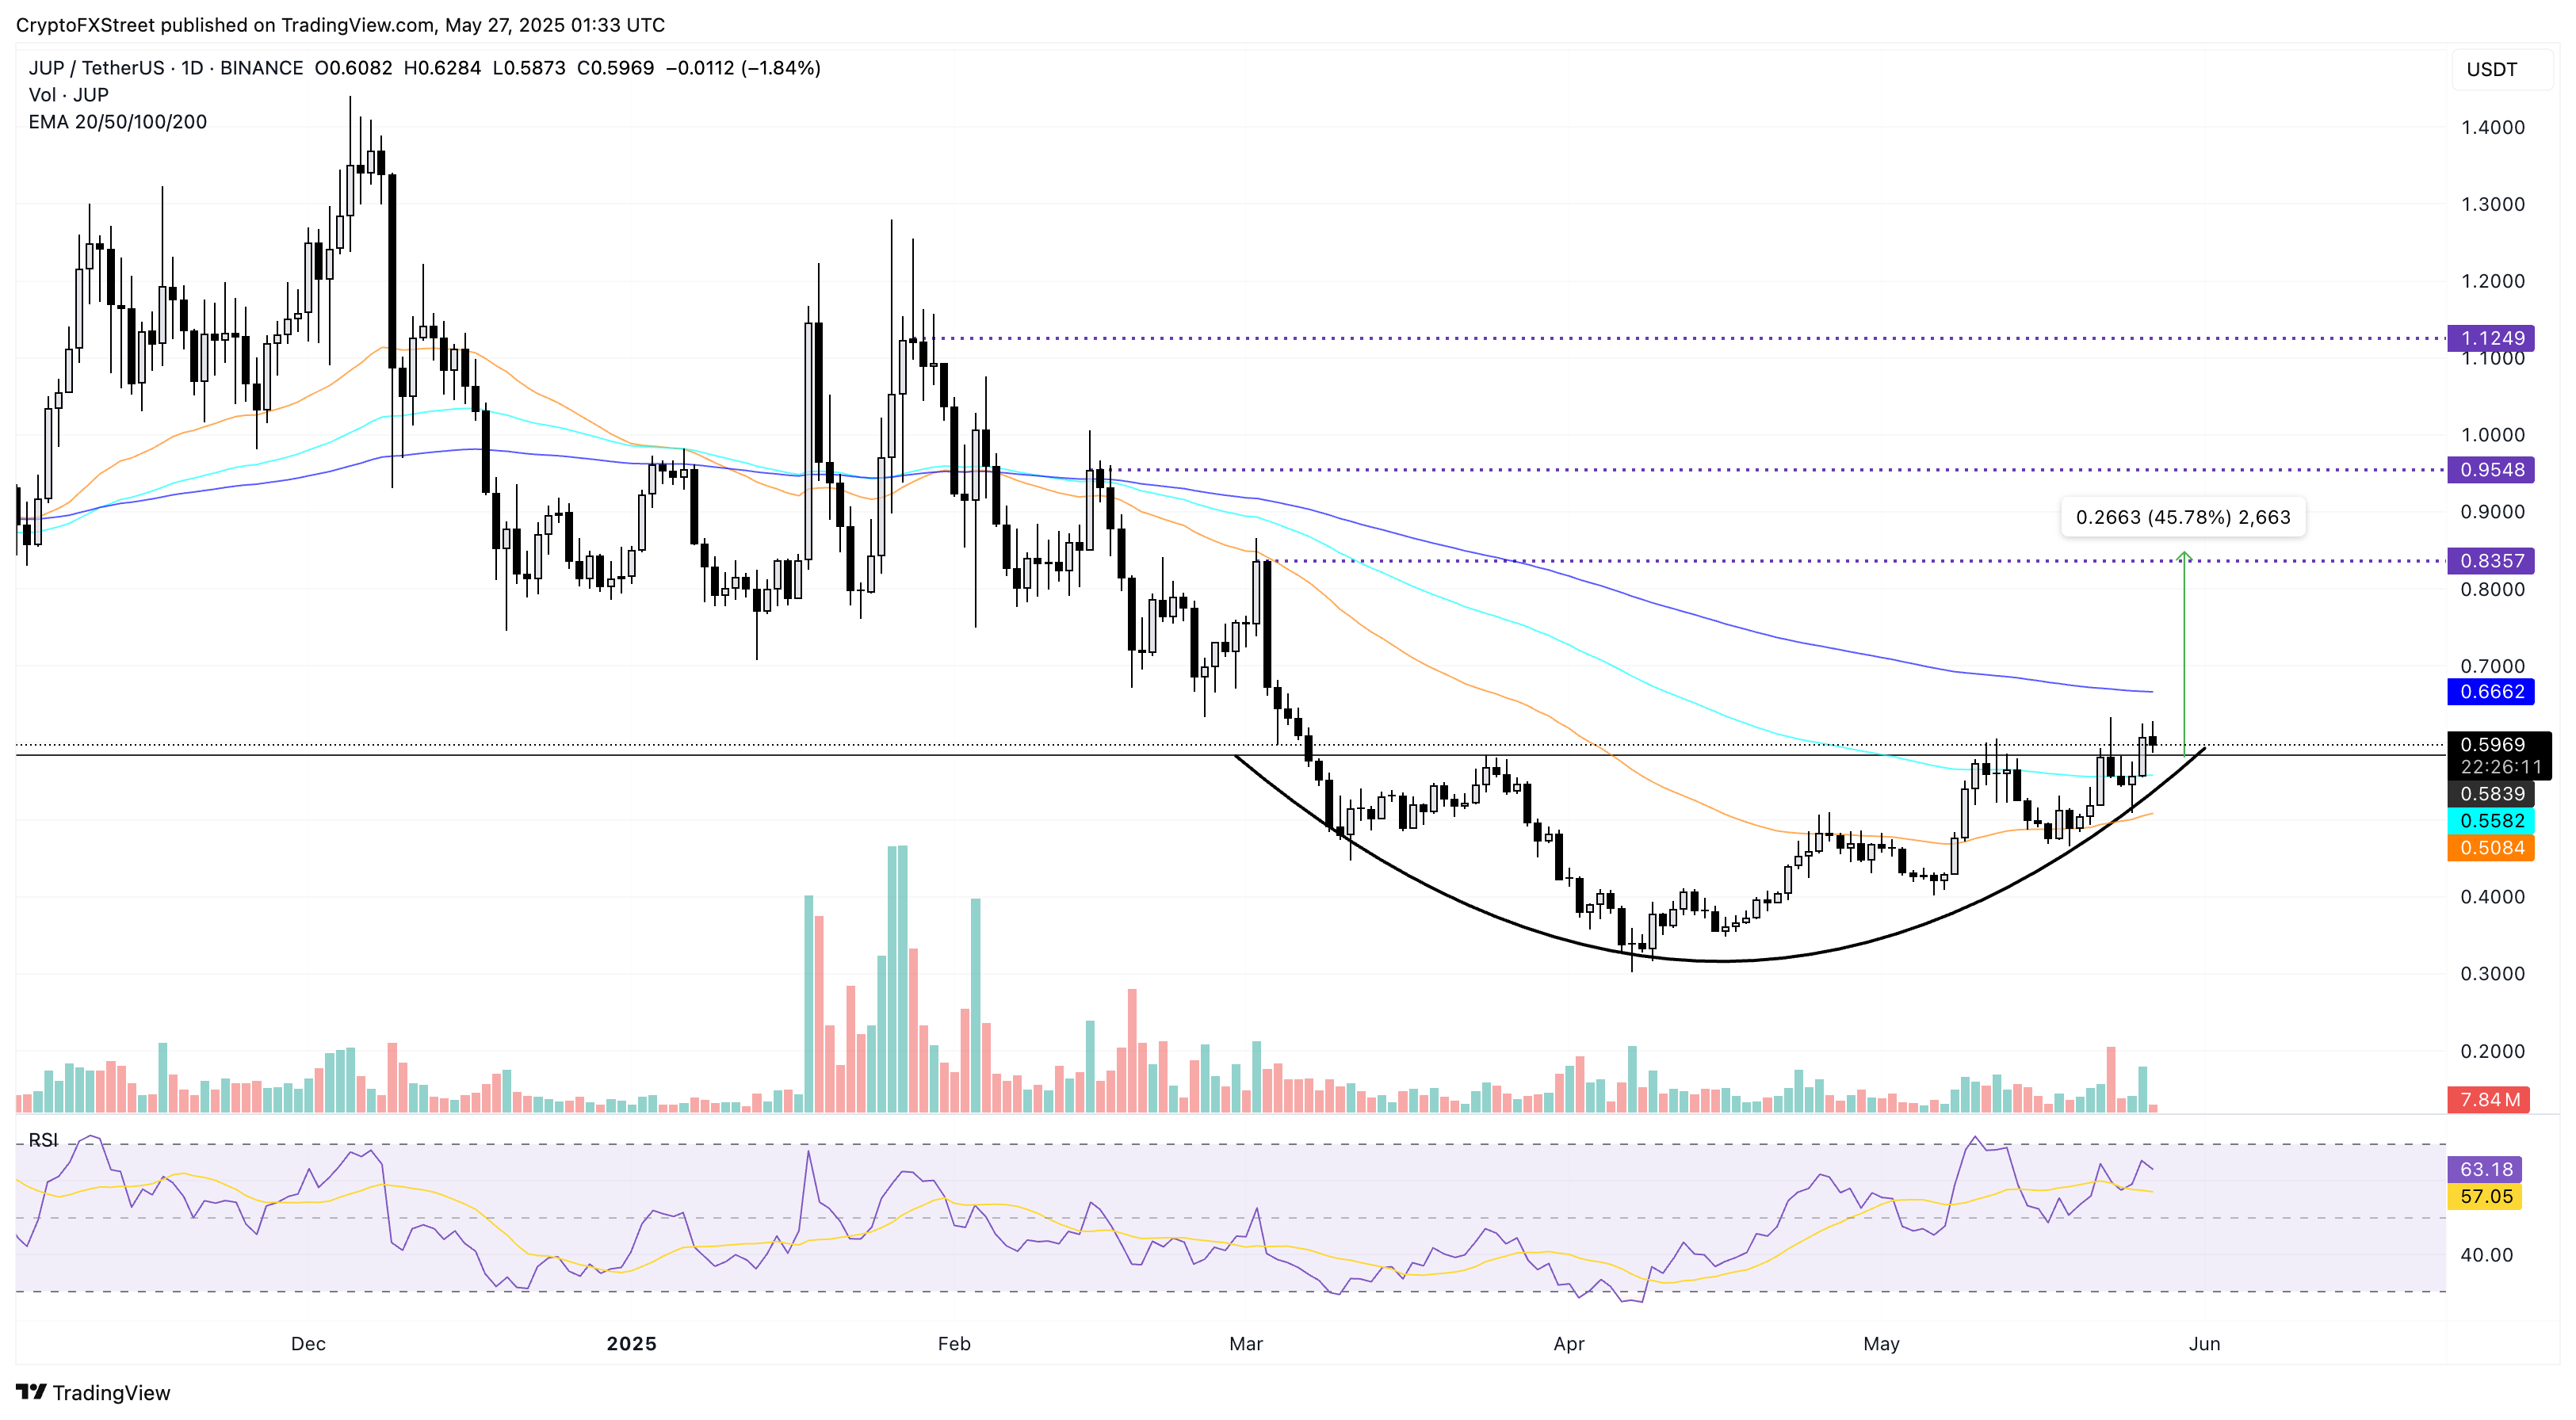
$JUP/$USDT daily price chart. Source: Tradingview
However, a closing under the $0.5839 neckline will nullify the bullish pattern, potentially leading to the 50-day EMA (yellow) retest at $0.5084.
$FORM uptrend targets rising wedge breakout
BinaryX rebranded as Four ($FORM) gains momentum with the new persona, scaling more than 40% this month, trading at $3.00 at press time. With a 4.80% surge on Monday, Four hit a new all-time high as it tests uncharted levels.
In the daily chart, the price action forms a rising wedge pattern with long-wick candles from March 24 to May 26, giving rise to a resistance trendline alongside the converging supporting trendline starting from March 20, with a touchdown during early May consolidation.
Technical indicators maintain an upbeat outlook as FOUR trades near the wedge’s upper boundary. The MACD and its signal line give a positive crossover after a short fake crossover event, reflecting the resurgence of buying pressure.
The Relative Strength Index (RSI) at 70 hits a crucial level as it moves flat near the overbought boundary line. As RSI reaches a crossroads, the recent recovery supports the bullish momentum but brings the risk of overbought conditions.
With the use of trend-based Fibonacci extension over the $0.80 low on March 14 to the $2.44 peak on March 24 and the third leg at $1.91 on April 6, a potential breakout rally could face resistance at $3.56, aligning with the 100% level.
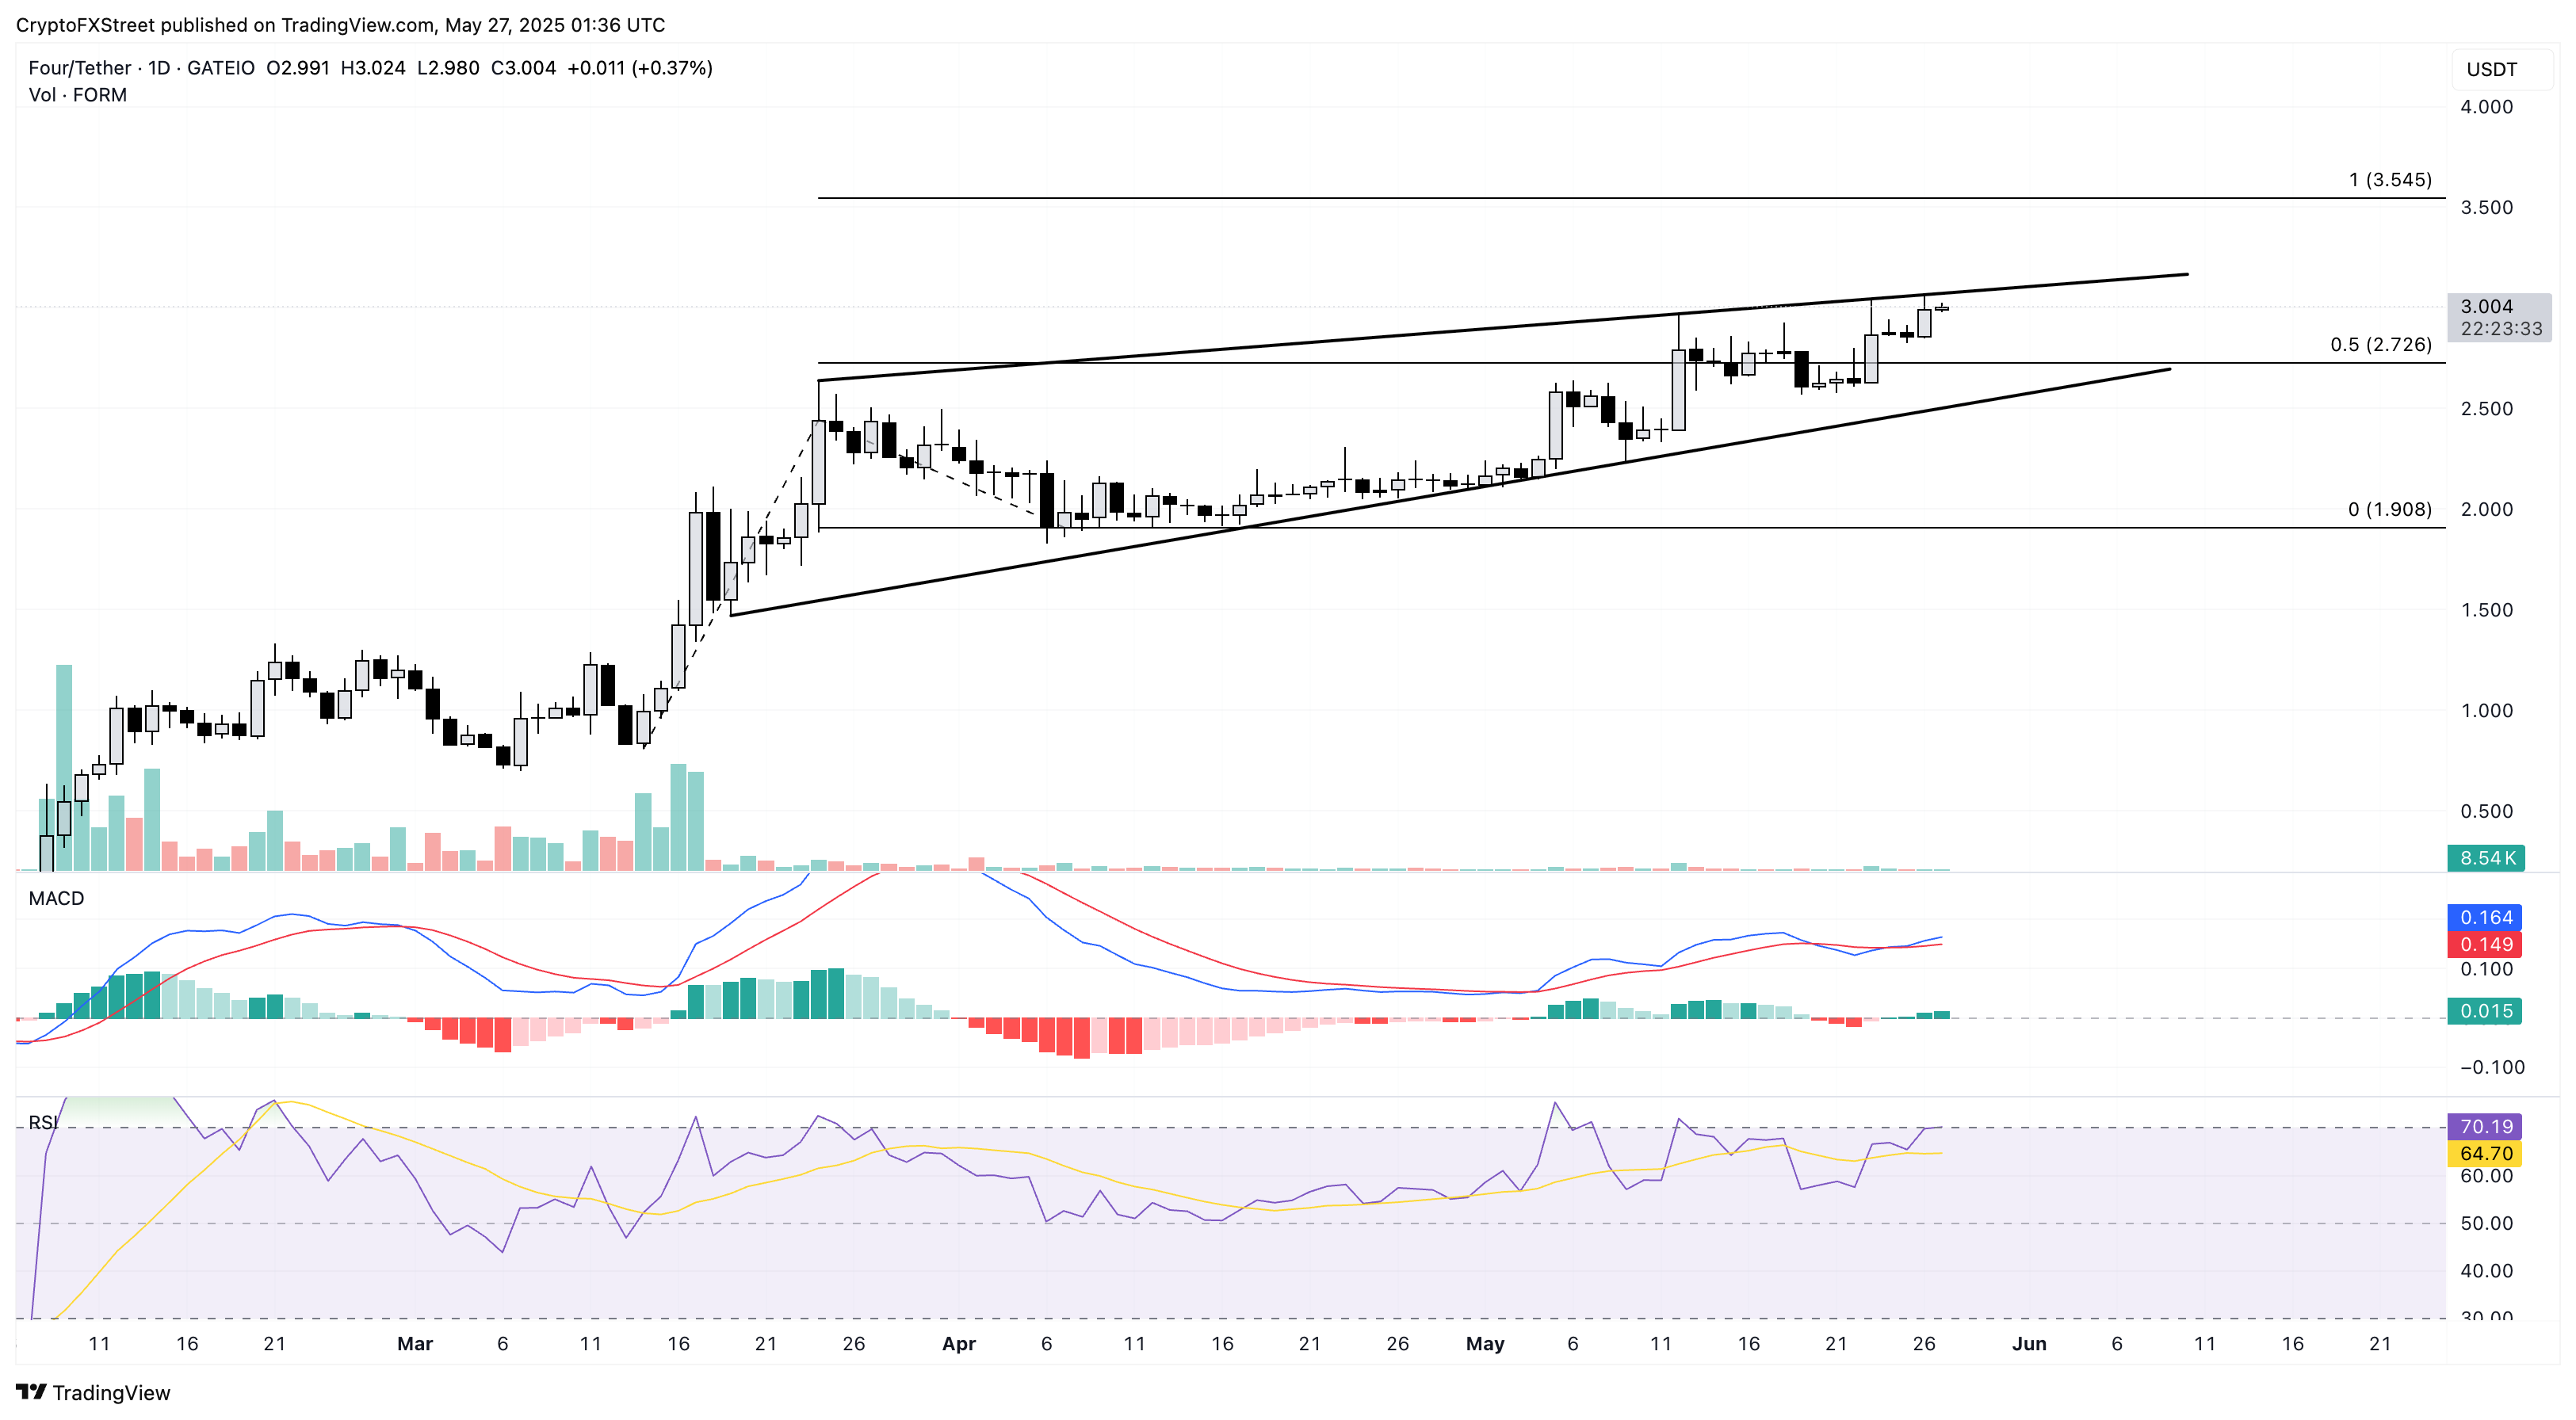
FOUR/$USDT daily price chart. Source: Tradingview
Conversely, a flip from the overhead trendline could test $2.73, which aligns with the 50% level.
