


 24
24
Hedera ($HBAR) has recovered over 5% in the past week. Despite some corrections today, multiple technical indicators flash bullish signals, suggesting a potential shift in momentum.
The DMI shows buyers firmly in control, the Ichimoku Cloud has flipped bullish, and a golden cross appears close to forming on the EMA lines. With key resistance levels approaching, $HBAR could be gearing up for an extended move—if the current momentum holds.
$HBAR DMI Shows Buyers Are In Full Control
Hedera’s DMI chart is showing signs of strengthening trend momentum, with the ADX (Average Directional Index) rising to 24.17 from 21.82 just a day ago.
The ADX measures the strength of a trend regardless of its direction. Readings above 25 typically indicate a strong trend, while values between 20 and 25 suggest a trend may be developing.
With the ADX nearing that threshold, Hedera could be preparing for a more decisive move if momentum continues building.
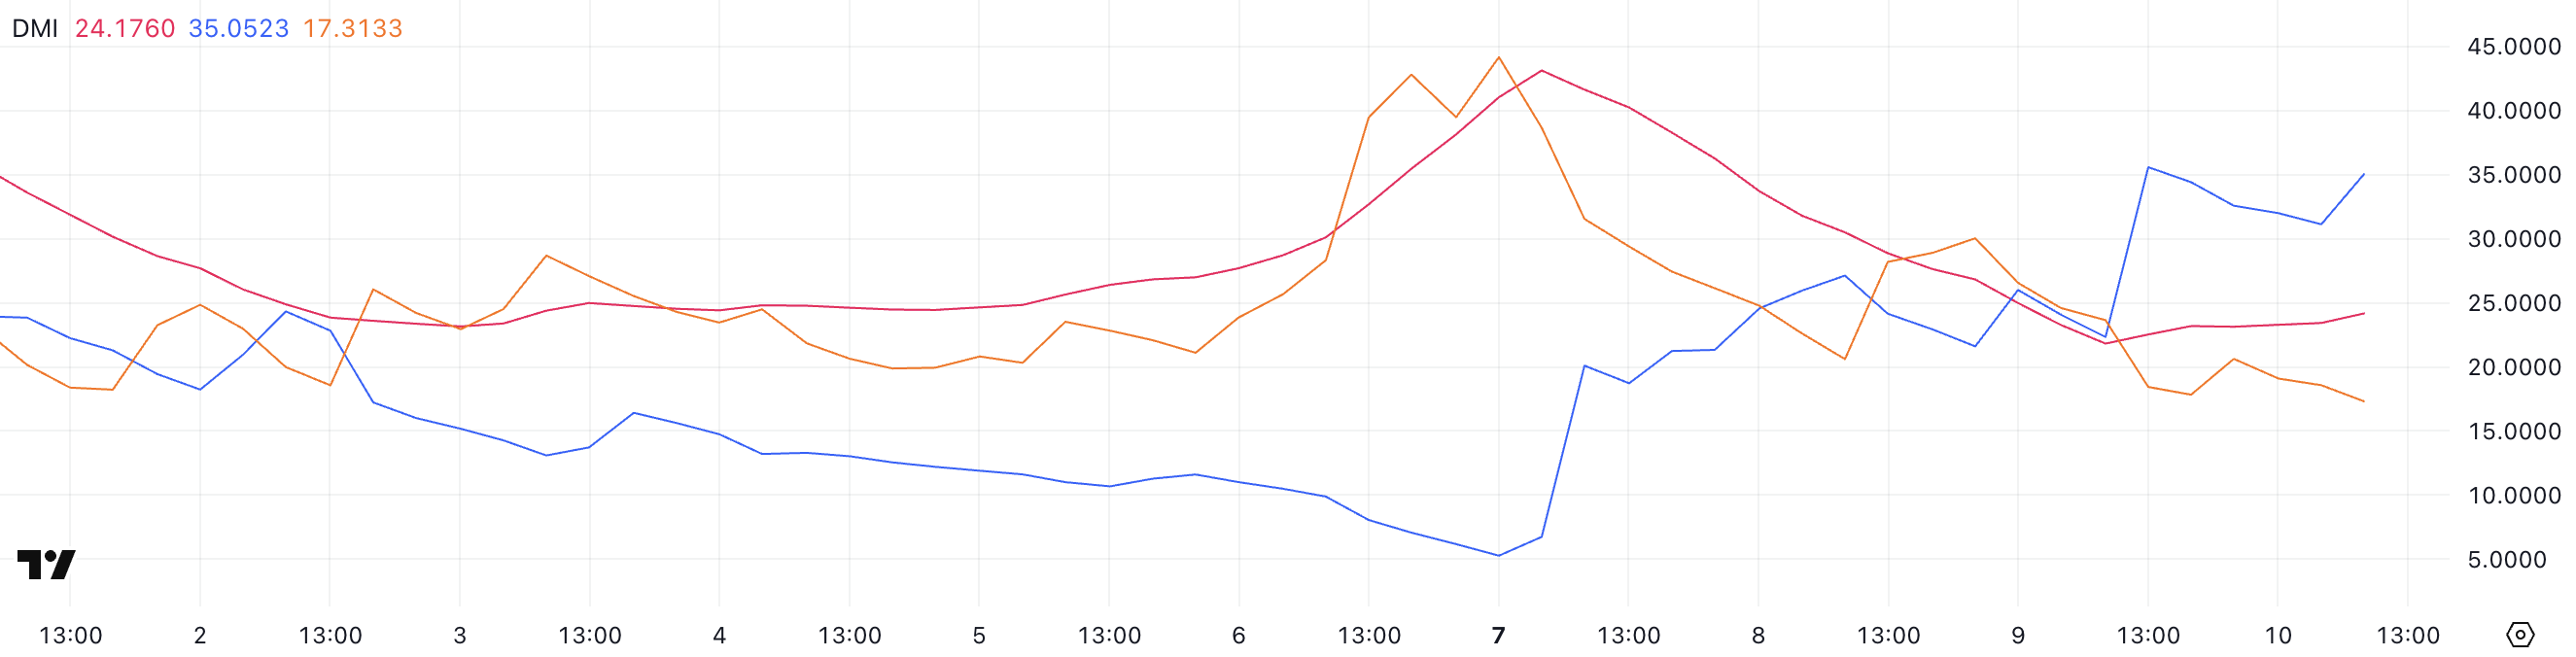
Looking at the directional indicators, the +DI has surged to 35.05 from 22.33, while the -DI has dropped to 17.31 from 23.65. This widening gap between the bullish and bearish pressure signals a strong shift in favor of buyers.
If this setup holds, it could indicate a developing uptrend for $HBAR, especially if the ADX continues to climb above 25.
The combination of rising bullish momentum and weakening selling pressure is a positive technical signal, suggesting that Hedera may be gearing up for further upside in the short term.
Hedera Ichimoku Cloud Shows A Bullish Setup
Hedera’s Ichimoku Cloud chart is flashing a bullish signal. After a strong move upward, price action broke above the red cloud (Kumo).
This breakout places the candles above both the Tenkan-sen (blue line) and the Kijun-sen (red line), which is generally seen as a sign of bullish momentum and short-term trend strength.
The cloud ahead has also started to thin, suggesting that resistance may be weakening. If momentum holds, further upside is more achievable.
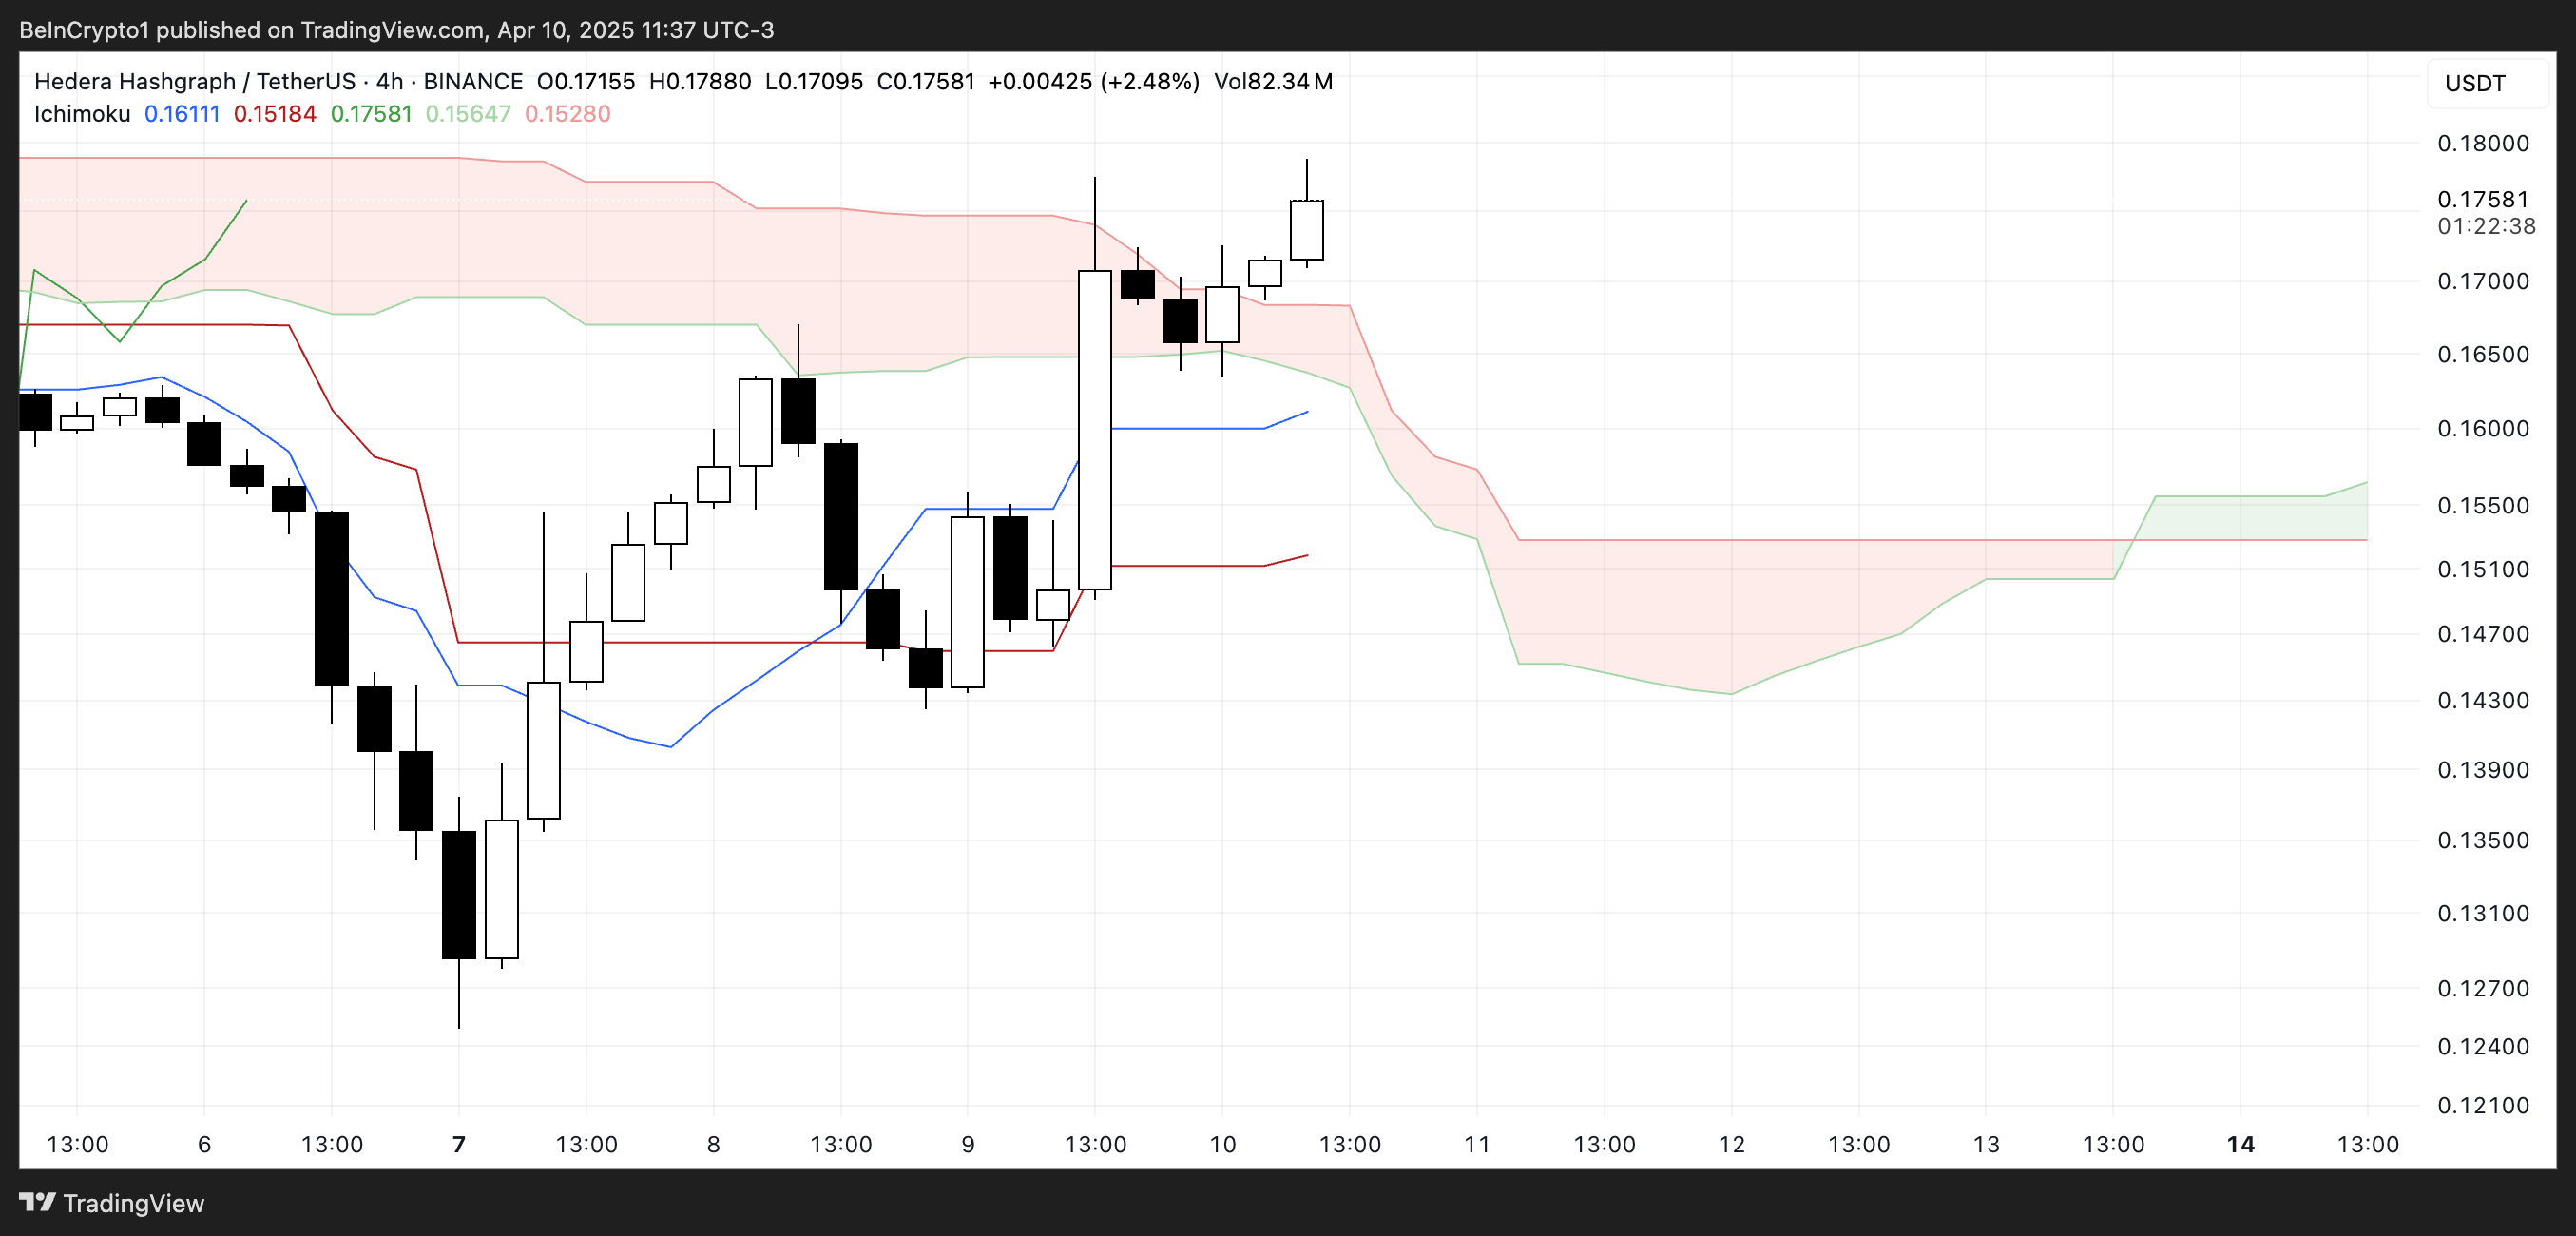
The Chikou Span (lagging green line) is now positioned above the price candles and the cloud, reinforcing the bullish bias. However, with the cloud still showing a mostly flat and narrow structure, the current trend doesn’t yet show strong continuation signals.
If the price remains above the cloud and the Tenkan-sen continues to lead above the Kijun-sen, Hedera could sustain this upward trajectory.
But traders should watch closely for any signs of a reversal back into or below the cloud, which would weaken the bullish setup.
Hedera Could Surge Soon If The Golden Cross Emerges
Hedera’s EMA lines are tightening, signaling a potential breakout. A golden cross—where short-term EMAs move above long-term ones—appears to be forming, which would typically indicate a bullish trend reversal.
If confirmed, this setup could push Hedera price toward resistance levels at $0.18 and $0.20, and if the momentum holds, even higher targets like $0.21 and $0.258 may come into play.
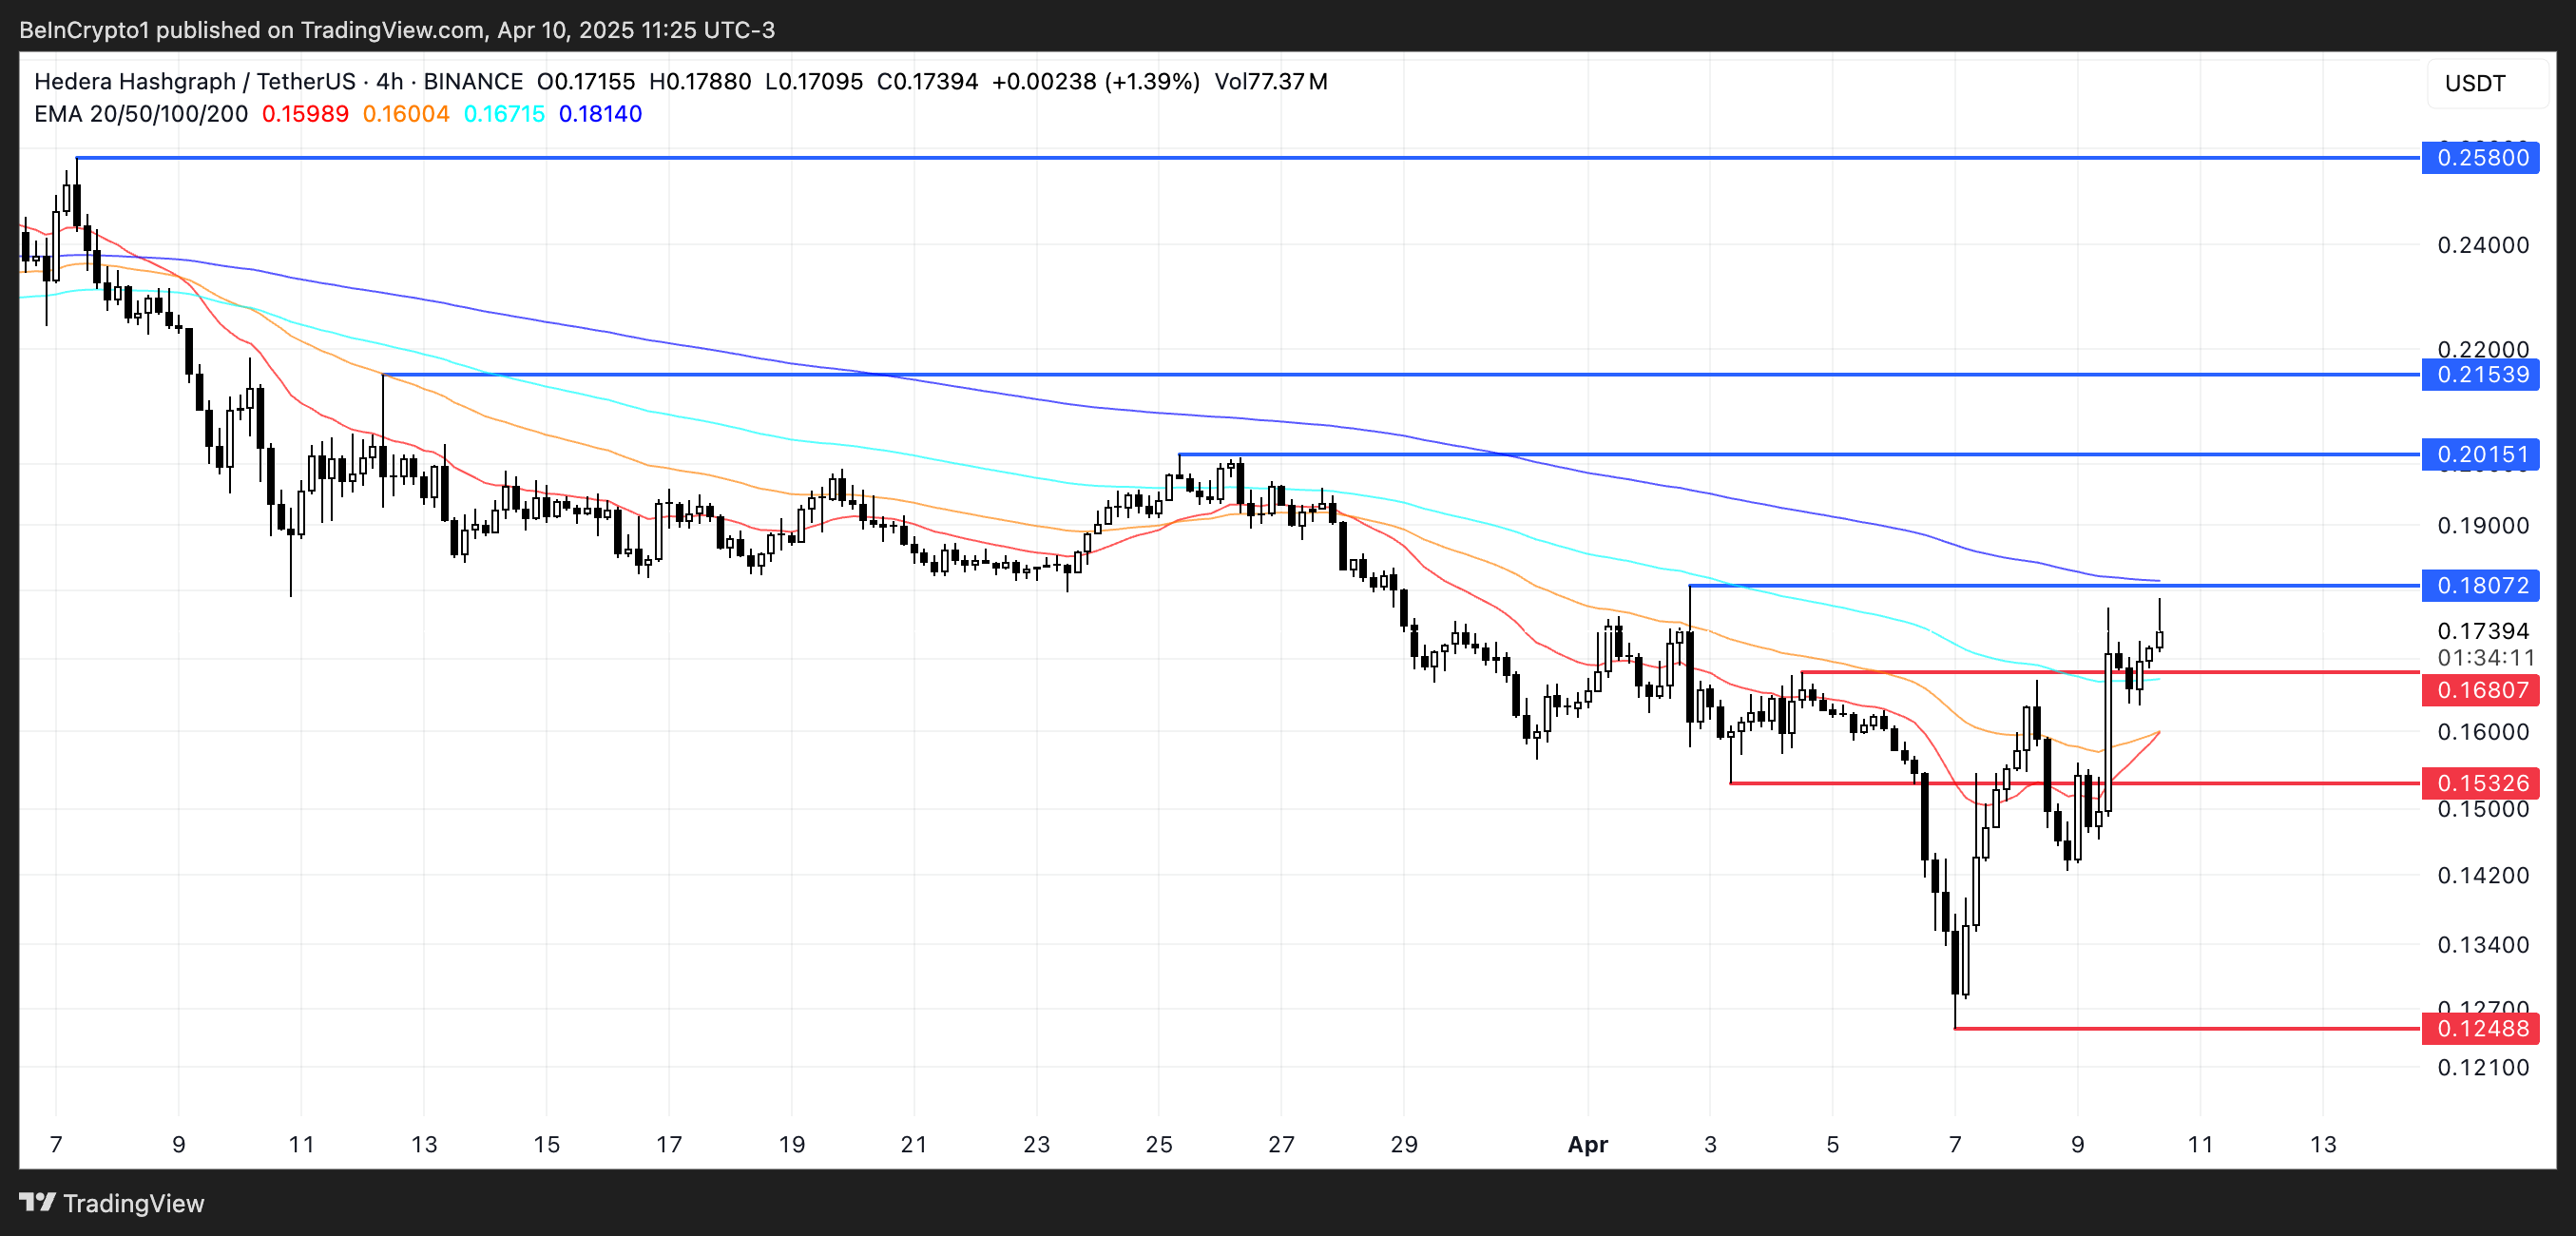
However, this bullish scenario hinges on a successful break above the immediate resistance. If $HBAR fails to clear the $0.18 level, it could trigger a pullback toward the support at $0.168.
Losing that support would likely expose Hedera to further downside. The next key levels are $0.153 and possibly below $0.13 if selling pressure intensifies.
