


 24
24
- $ARB tests key support near $0.39, signaling a potential rebound, but the overall trend remains bearish within a descending channel.
- Breakout potential emerges as $ARB trades within a falling wedge; a move above resistance could trigger a recovery toward $1.
- Accumulation zone strengthens between $0.30–$0.40; a breakout with strong volume may shift sentiment and fuel bullish momentum.
Arbitrum ($ARB) is testing the lower boundary of its descending parallel channel, suggesting a possible rebound toward $0.63. The $ARB/$USDT perpetual contract on Binance indicates a downward trend within well-defined trendlines. The price remains constrained within the channel, with multiple resistance rejections and support bounces.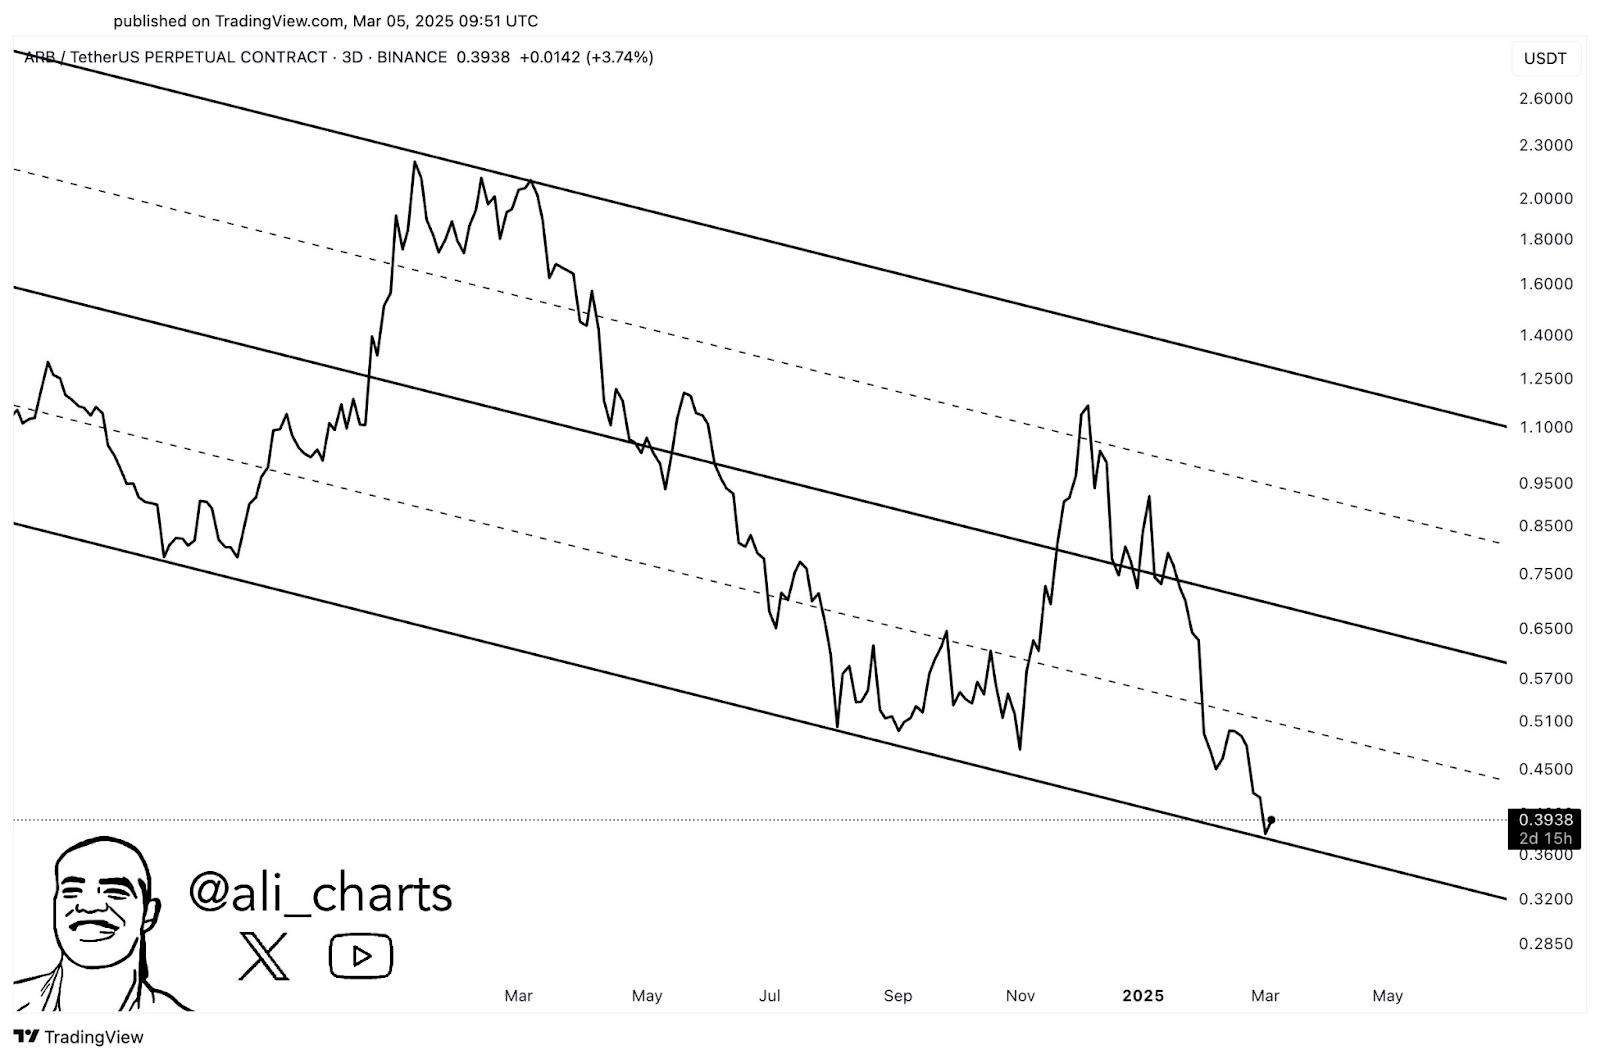
Source: Ali
The price peaked near $2.60 before sharply declining. A retracement followed, forming a lower high around $1.25. The trend persisted downward, with brief rallies failing to break resistance. Recently, $ARB reached approximately $1.10 but faced another sharp decline. The price structure confirms a pattern of lower highs and lower lows, reinforcing the bearish trend.
$ARB Maintains Structure Despite Downtrend
Currently, $ARB trades near $0.3938, hovering around the channel’s lower boundary. A slight bounce off support suggests short-term buying activity. However, overall momentum remains bearish, and no breakout attempts are evident.
The descending channel remains intact, respecting its trendlines. A minor rebound from support is visible, yet the broader trend remains downward. Unless a strong bullish move breaks resistance, the downtrend is expected to continue. The market structure aligns with previous movements, highlighting repeated lower highs and lower lows.
Possible Breakout and Recovery Toward $1
After a long consolidation phase, $ARB has consistently tested resistance within its daily falling wedge pattern. A breakout could trigger a significant recovery toward $1 and beyond in the coming days.
The $ARB/$USDT chart on Binance highlights a downward trajectory since late 2024. The falling wedge pattern suggests possible trend exhaustion. A breakout above resistance may signal a shift in market sentiment.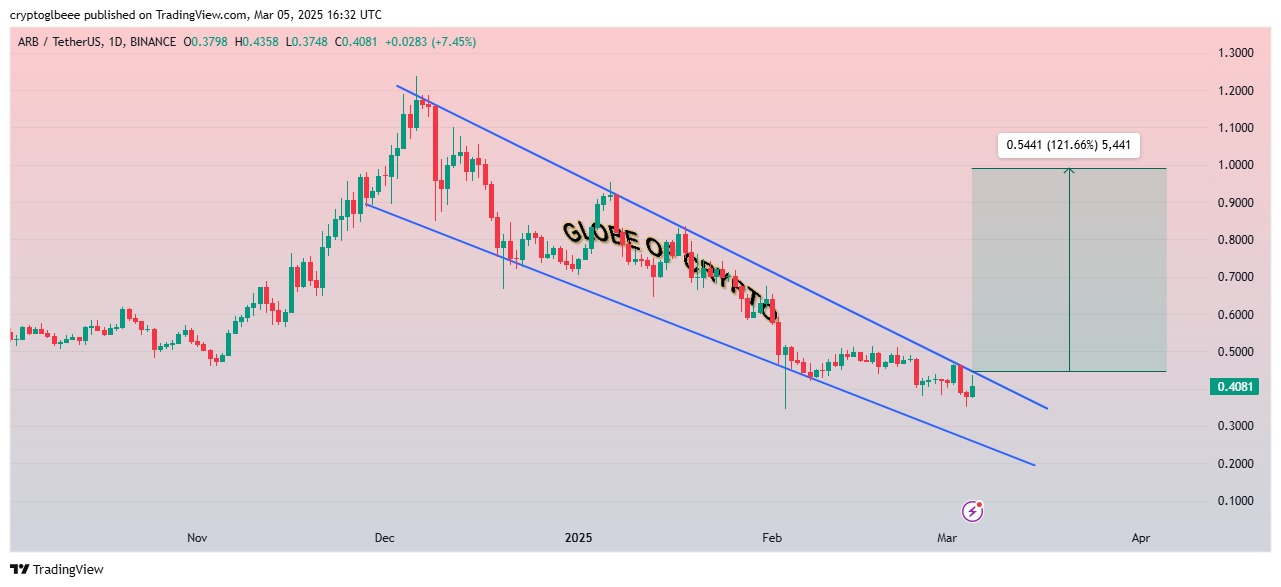
Source: X
At present, $ARB trades at $0.4081, reflecting a 7.45% increase in the latest session. A projected breakout target of $0.95 presents a potential 121.66% gain. This target aligns with prior resistance levels, making it crucial for traders. The lower boundary of the wedge has provided strong support, preventing further losses.
$ARB remains below key moving averages, confirming its bearish trend. However, the demand zone between $0.30 and $0.40 has seen accumulation. Market sentiment and liquidity will influence the next major move. If sustained volume accompanies a breakout, bullish momentum could drive prices higher.

