

 14
14
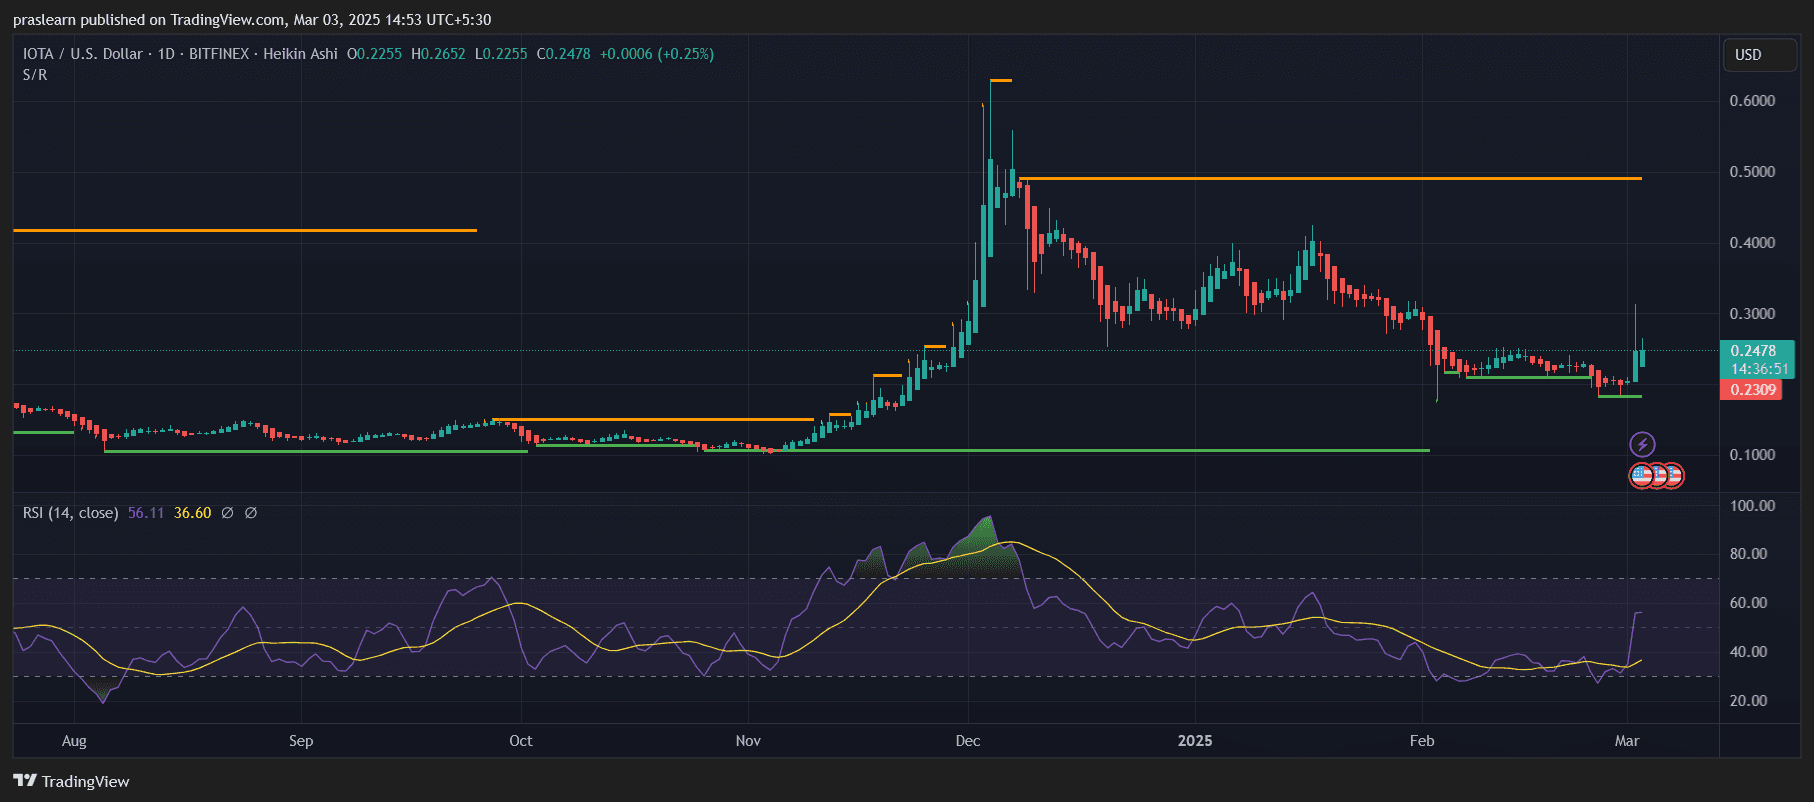
$IOTA has been a fascinating cryptocurrency in the market, known for its unique Tangle technology, which sets it apart from traditional blockchain-based assets. However, its price performance has been volatile, with massive swings over the past few months. After reaching a high near $0.60 in December 2024, $IOTA underwent a steep correction, leaving investors wondering whether it can recover.
The latest price action suggests that $IOTA is attempting a strong rebound from key support levels. With a noticeable price surge above $0.24, traders and investors are questioning whether this marks the beginning of a sustained uptrend or just a temporary relief rally. In this analysis, we will examine the critical support and resistance levels, indicators, and potential price targets for $IOTA in the coming weeks.
$IOTA Price Prediction: What Is the Current Trend in $IOTA’s Price Movement?
 $IOTA Price Prediction">
The $IOTA daily chart shows a strong shift in price action after a prolonged downtrend. Recently, the price tested and bounced off a critical support level around $0.12-$0.13, suggesting that buyers are stepping in aggressively. This level had previously acted as a strong base during past corrections, reinforcing its importance.
Since the bounce, $IOTA has climbed above $0.24, signaling renewed bullish momentum. A key observation is that the price has broken above previous consolidation ranges, hinting at the possibility of further gains if buyers maintain control.
Has $IOTA Formed a Reliable Support Zone?
Yes, the $0.12-$0.13 range has been an essential demand zone for $IOTA price, where price reversals have occurred multiple times. This zone serves as a psychological level where buyers find value, making it a crucial reference point for traders.
Currently, a new potential support zone is forming around $0.20-$0.22. If $IOTA holds above this area, it will provide a strong foundation for further bullish movement. However, if price action dips below this level, another retest of the lower support levels could be in play.
--> Click here to easily trade $IOTA today <--
What Do the Indicators Reveal About $IOTA’s Strength?
The Relative Strength Index (RSI) is currently at 56, reflecting increased buying pressure. Previously, RSI was in the oversold zone, but the latest breakout suggests a shift in momentum. If RSI moves above 70, it would indicate overbought conditions, potentially leading to a short-term correction.
Additionally, the Heikin Ashi candlesticks show a clear bullish trend, with multiple consecutive green candles forming. This further confirms the positive momentum in $IOTA’s price action. The trend structure suggests that if buyers maintain pressure, $IOTA could extend its rally toward the next resistance zones.
Where Is $IOTA Headed in the Short Term?
If the current momentum continues, $IOTA’s first major resistance zone lies between $0.30 and $0.35. Breaking this level could open the door for a further rise toward $0.40-$0.45 in the coming weeks.
However, if $IOTA struggles to sustain above $0.24-$0.25, it might face a pullback toward $0.20-$0.22. If this support holds, it would serve as a potential re-entry zone for traders. But if bears regain control and price falls below $0.20, it could trigger another retest of $0.12-$0.13, which would be a key decision point for the asset.
$IOTA Price Prediction: Will $IOTA Retest Its Previous Highs?
For $IOTA to revisit its $0.50-$0.60 peak, it must overcome multiple resistance levels. A sustained breakout above $0.35 would be the first confirmation of a larger rally. However, macroeconomic conditions and overall market sentiment will play a crucial role in determining whether $IOTA can achieve this.
If Bitcoin continues its bullish trajectory, altcoins like $IOTA could benefit from increased investor confidence. However, if broader market weakness persists, $IOTA might experience sideways consolidation before another breakout attempt.
Key Entry and Exit Points for Traders
Entry Zones (Buy Opportunities):
- $0.20 - $0.22: Ideal re-entry zone if price pulls back and holds this support.
- Breakout Above $0.30: A successful breakout could confirm a bullish continuation toward higher targets.
Exit Zones (Take Profit Levels):
- $0.30 - $0.35: Strong resistance zone, where partial profit-taking could be considered.
- $0.40 - $0.45: A higher resistance area that could act as a near-term target.
- $0.50 - $0.60: A major resistance zone, where strong selling pressure could emerge.
Is Now a Good Time to Buy $IOTA?
The recent breakout from support and bullish RSI movement suggest that $IOTA could be entering a new uptrend. However, traders should watch key resistance levels before expecting a full recovery to previous highs.
For long-term investors, accumulating near $0.20-$0.22 could be a strong opportunity, given that $IOTA has historically rebounded from these levels. On the other hand, short-term traders should focus on breakouts above $0.30 for confirmation of further bullish momentum.


