
- APT is currently trading at $6.20, down 4.85% in 24 hours.
- Above $6.24 could push APT to $6.30, while below $6.18 risks a drop to $6.10.
Aptos (APT) is currently priced at $6.20, reflecting a 4.85% decline in the last 24 hours. The market capitalization stands at $3.65 billion, down 4.83% from the previous day. The 24-hour trading volume has dropped significantly by 43.89%, reaching $144.1 million. The market cap ratio is 3.95%, indicating lower trading activity compared to previous days.
Technical Indicators and Price Levels
APT’s price action shows a consolidation phase with low volatility. The support level is near $6.18, while the resistance level stands at $6.24. If APT breaks above $6.24, it may test the next resistance around $6.30. However, a drop below $6.18 could lead to a further downside towards $6.10.
The Relative Strength Index (RSI) is at 40.54, signaling mild bearish momentum. The RSI average stands at 40.59, indicating that APT is not yet in oversold territory. A move above 50 could suggest a potential reversal in trend. If the RSI drops below 30, it will indicate oversold conditions, increasing the chances of a rebound.
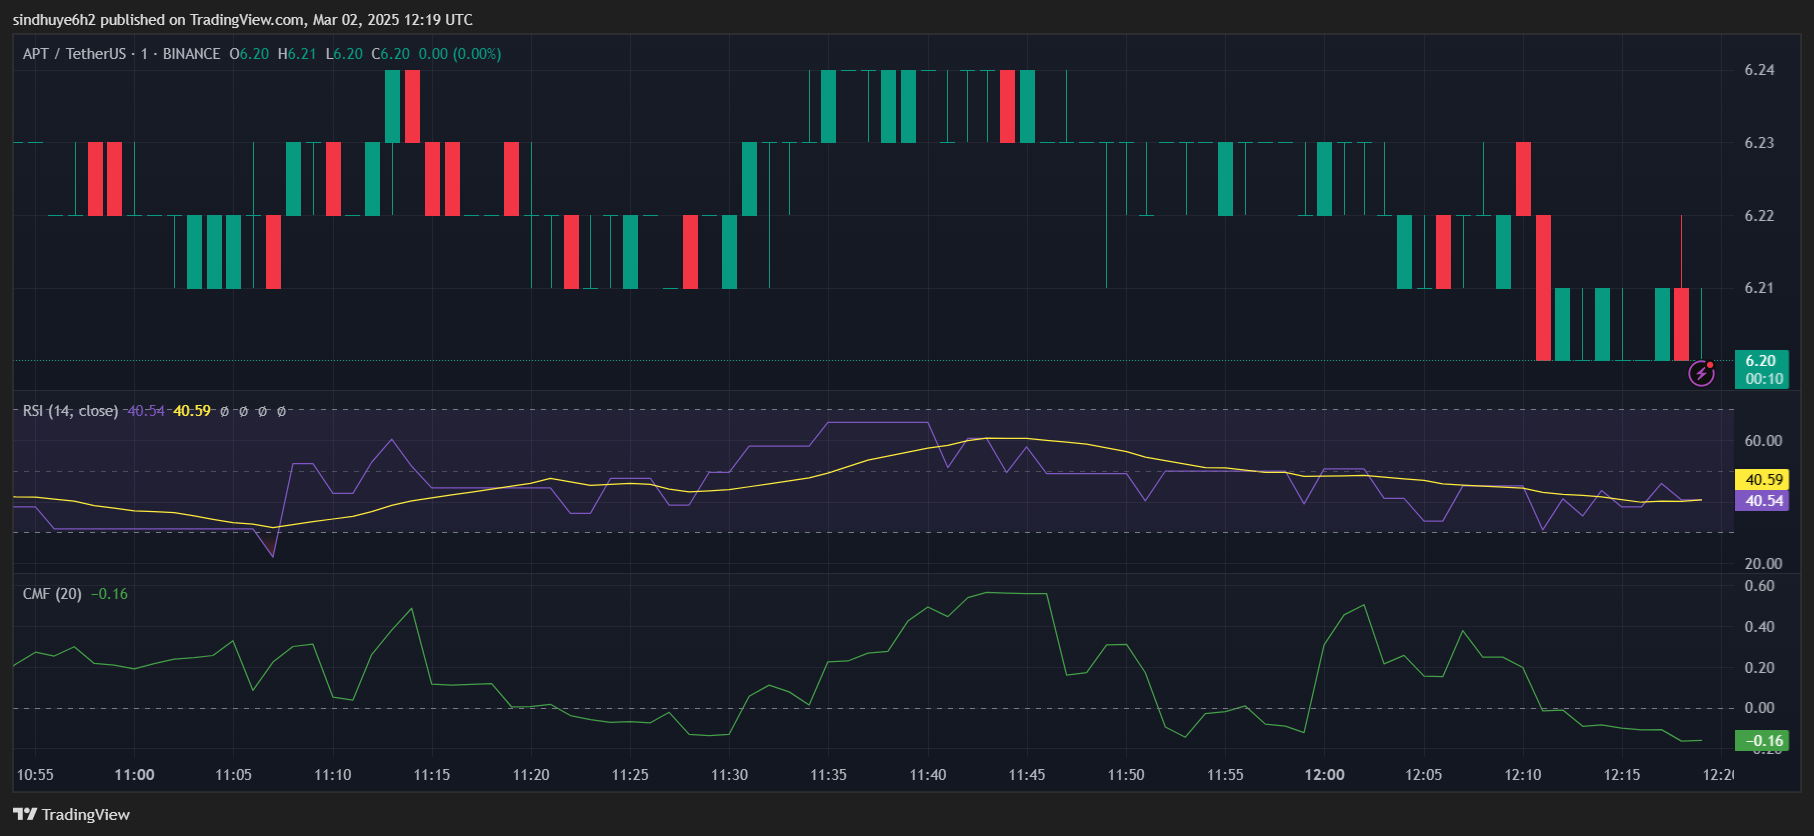
The Chaikin Money Flow (CMF) indicator is at -0.16, reflecting weak buying pressure. This suggests capital outflows from APT, which may limit upward movement unless demand increases. If CMF turns positive, it would indicate growing accumulation, possibly pushing prices higher.
APT is currently trading close to its short-term moving average. A bullish crossover, where the short-term moving average crosses above the long-term moving average, could signal a shift toward an uptrend.
Aptos (APT) is struggling to regain momentum as market sentiment remains weak. The key levels to watch are $6.24 for an upward breakout and $6.18 for potential downside risk. RSI and CMF indicate weak demand, while moving averages show no clear trend shift. If buying pressure increases, APT may retest $6.30, but failure to hold support could push it lower.