

 13
13
Injective’s recent community vote to reduce $INJ’s supply has sparked a rally in the altcoin’s value. Trading at $26.29 at press time, its price has surged 33% over the past week.
Despite this rally, $INJ futures traders have placed short bets against its price. However, with the token poised to extend its gains, these short traders risk facing a potential short squeeze.
Injective’s Transition Boosts Market Interest
On January 5, a governance proposal to transition from Injective 2.0 to Injective 3.0 was approved, with 99.99% of community members voting in favor. This upgrade will reduce the supply of $INJ tokens, making it “one of the most deflationary assets over time.”
The positive hype around this upgrade is currently driving the $INJ price rally, whose value has risen by 18% in the past two days. Interestingly, despite this, the token’s futures traders remain unimpressed and have continued to demand more short positions. This is reflected by $INJ’s Long/Short Ratio, which is 0.99 at press time.
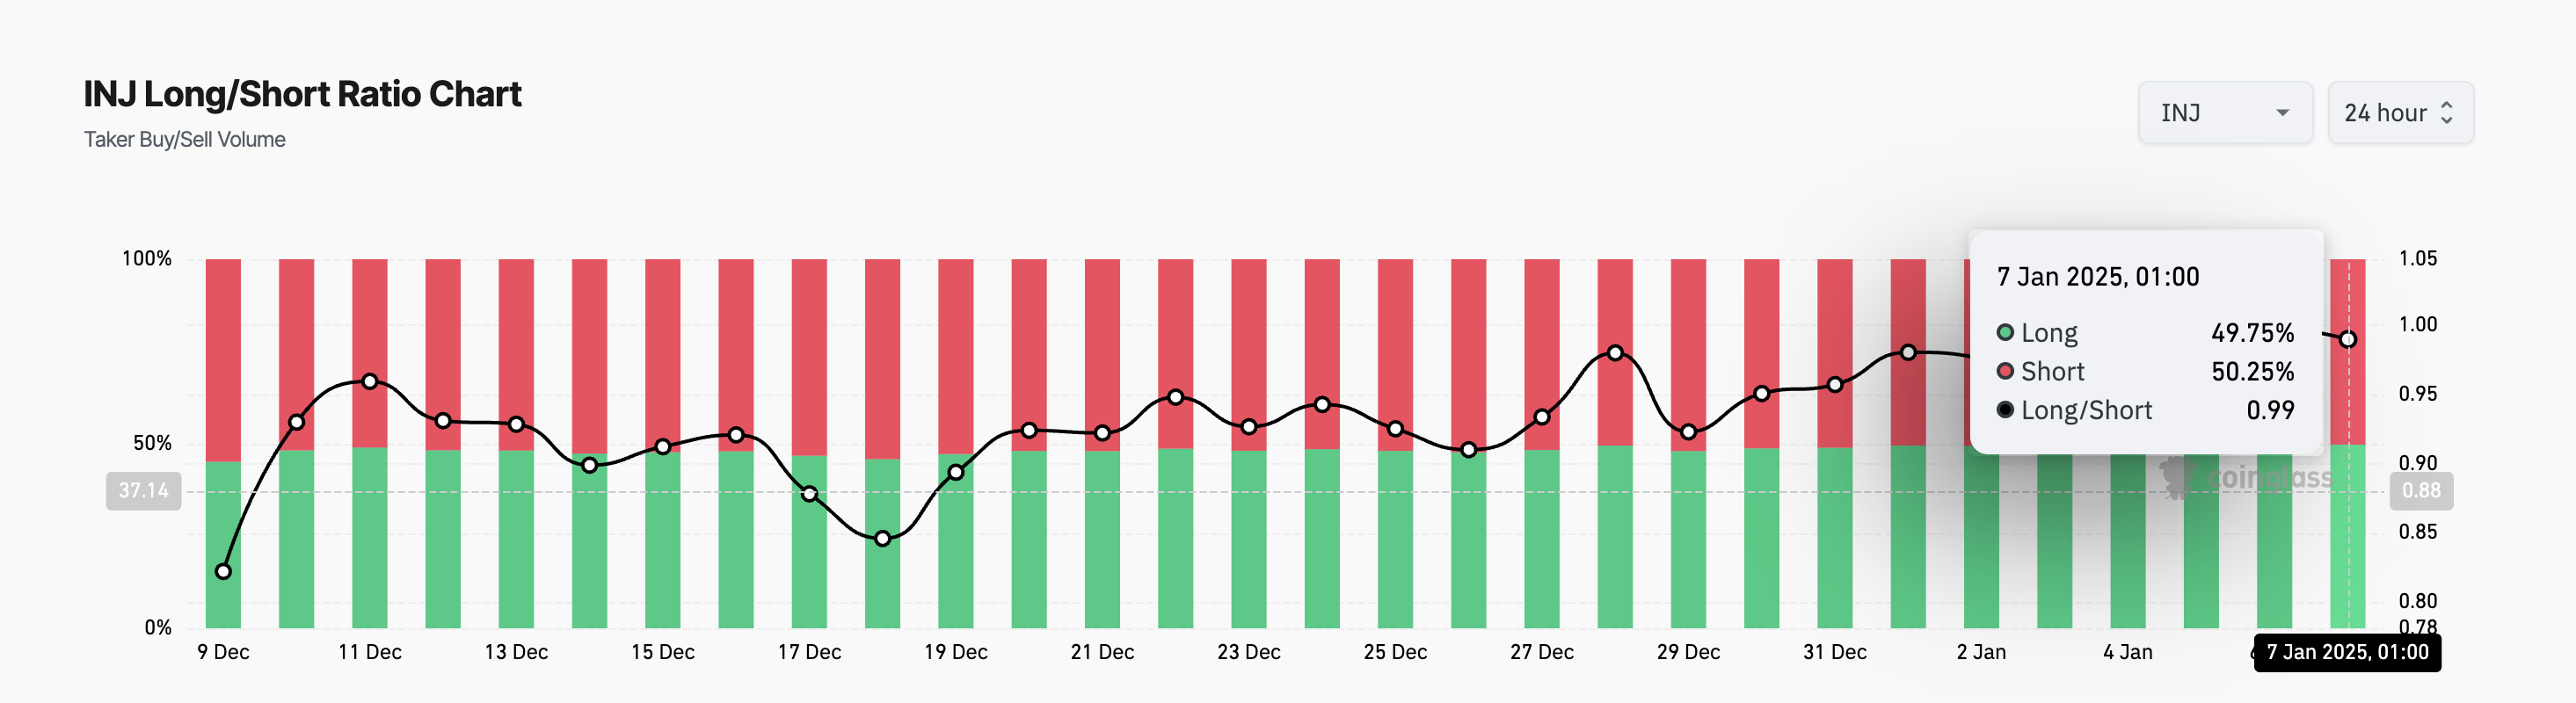
This ratio compares the number of long positions (bets that the price will rise) to short positions (bets that the price will fall) in a market. When the ratio is below 1, it indicates that there are more short positions than long positions, suggesting a bearish sentiment among traders.
Rising Demand for $INJ Puts Short Traders at Risk
However, with growing demand for $INJ, these traders are at risk of a potential short squeeze. A short squeeze occurs when a shorted asset experiences a price increase, forcing short sellers to buy back their positions to limit losses. This buying pressure can drive the price even higher, creating a feedback loop that accelerates the upward trend.
$INJ’s rising Relative Strength Index (RSI) is worthy of note here. At press time, this momentum indicator is in an uptrend at 58.88.
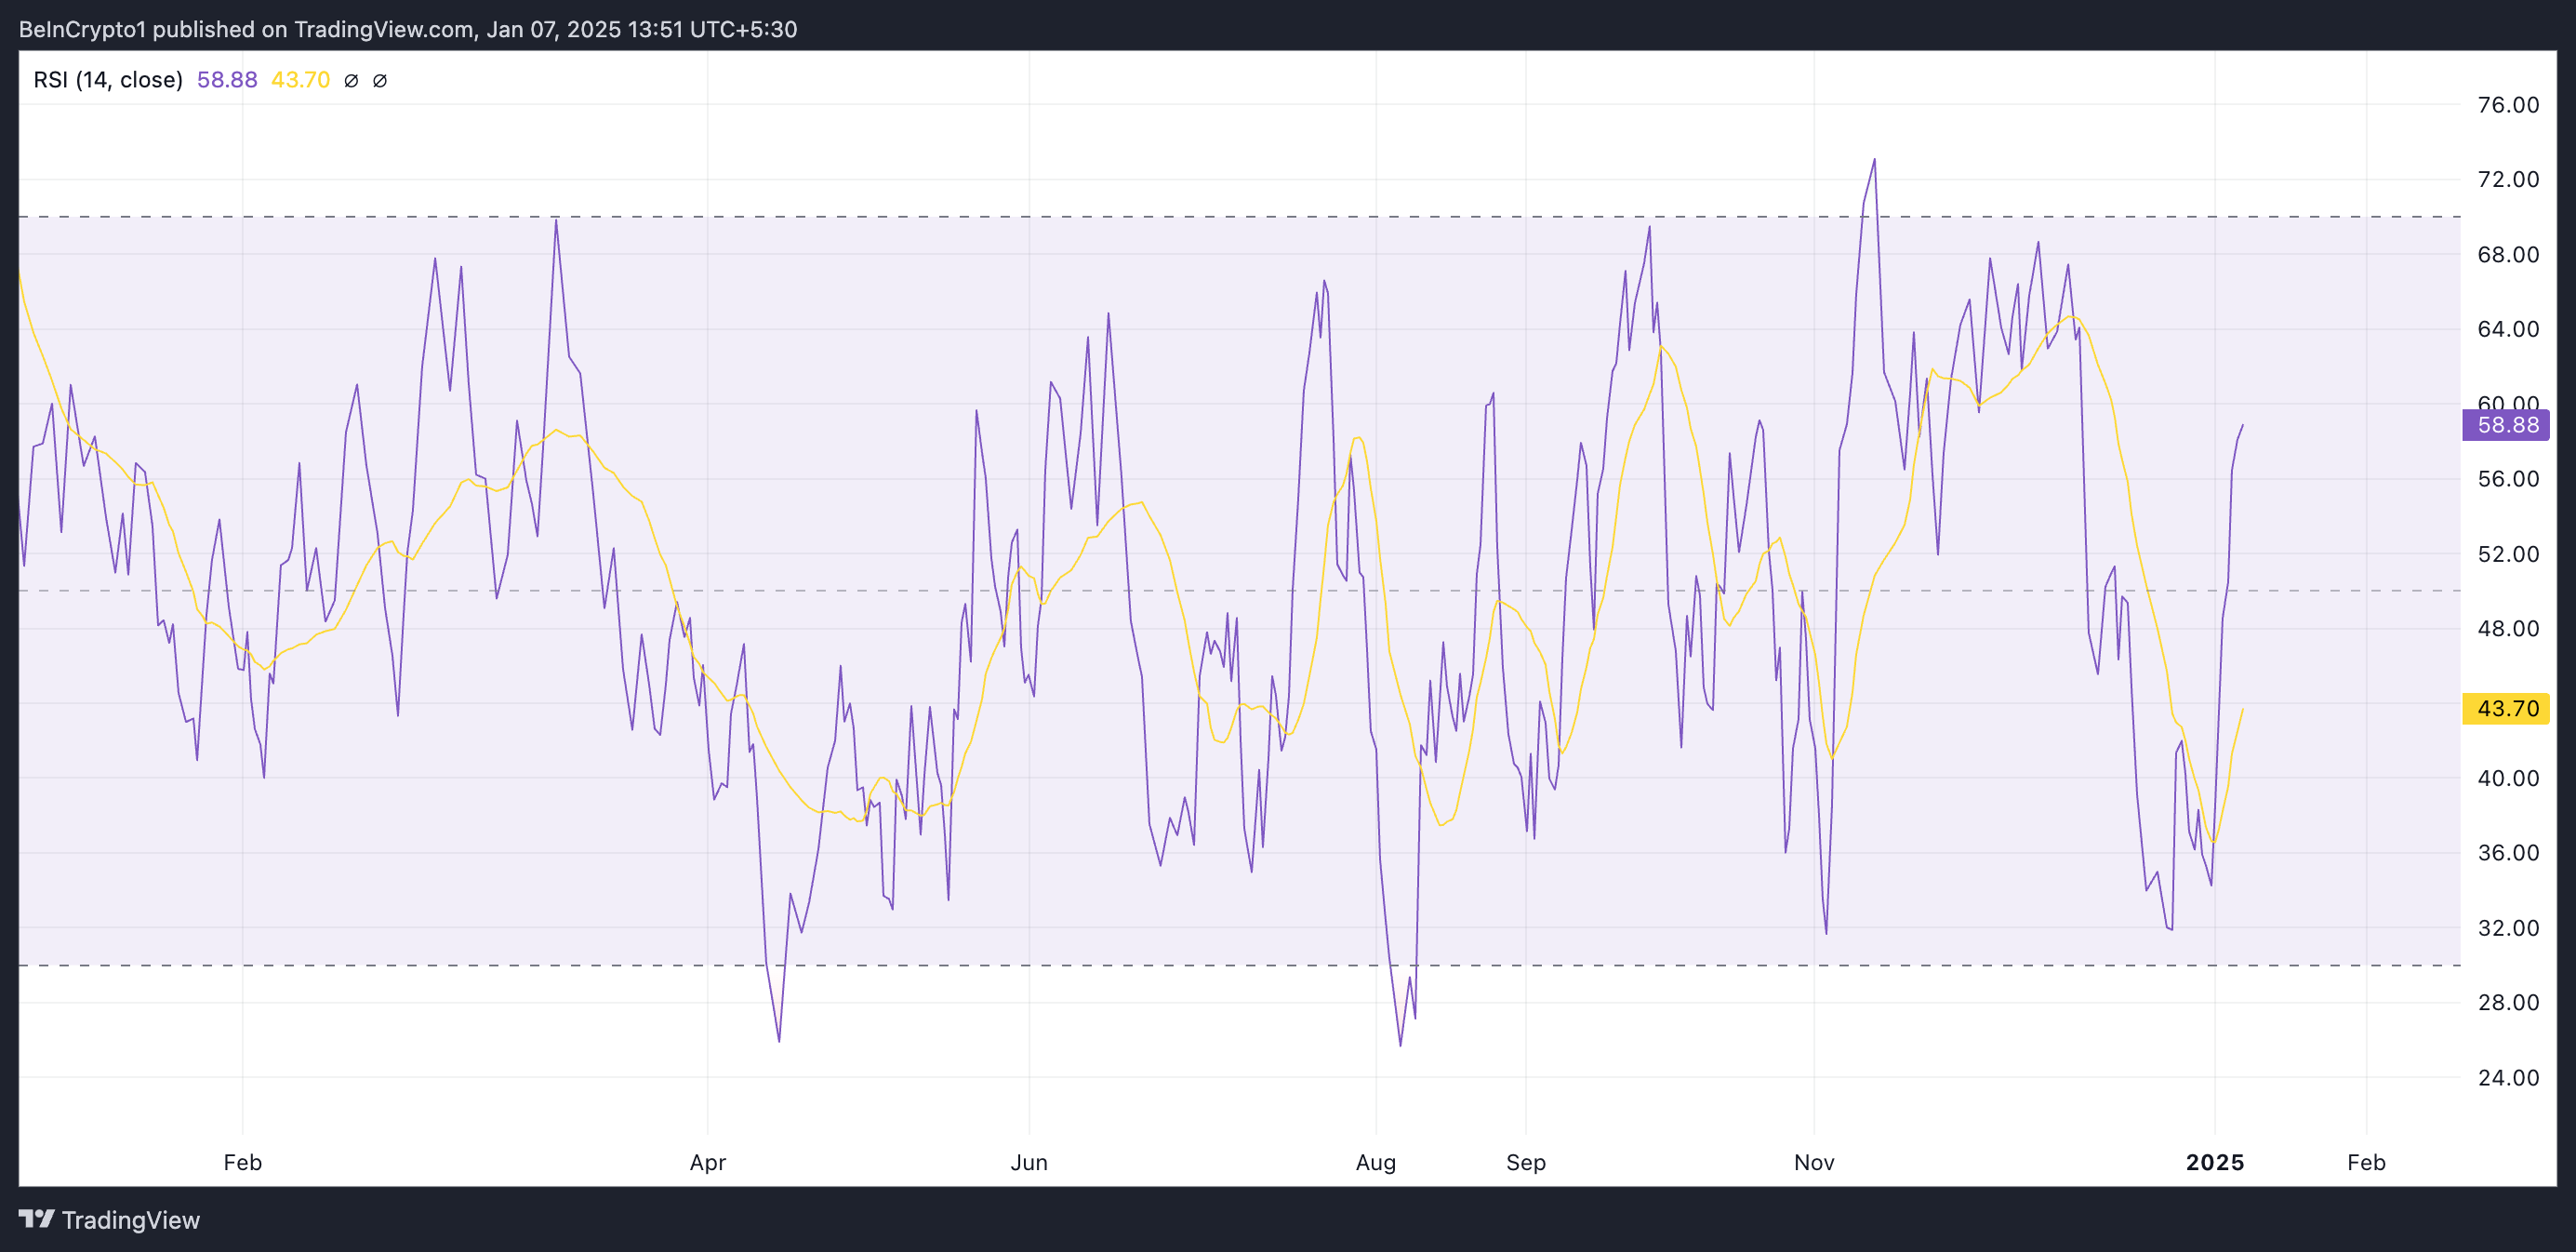
The RSI indicator measures an asset’s oversold and overbought market conditions. It ranges between 0 and 100, with values above 70 indicating that the asset is overbought and due for a correction. On the other hand, values under 30 indicate that the asset is oversold and may witness a rebound.
At 58.88, $INJ’s RSI indicates that the asset is in a neutral to slightly bullish zone. Price momentum shows more buying than selling pressure but is not yet overbought.
Further, readings from $INJ’s Moving Average Convergence Divergence (MACD) indicator support this bullish outlook. At press time, the token’s MACD line (blue) rests above its signal line (orange).
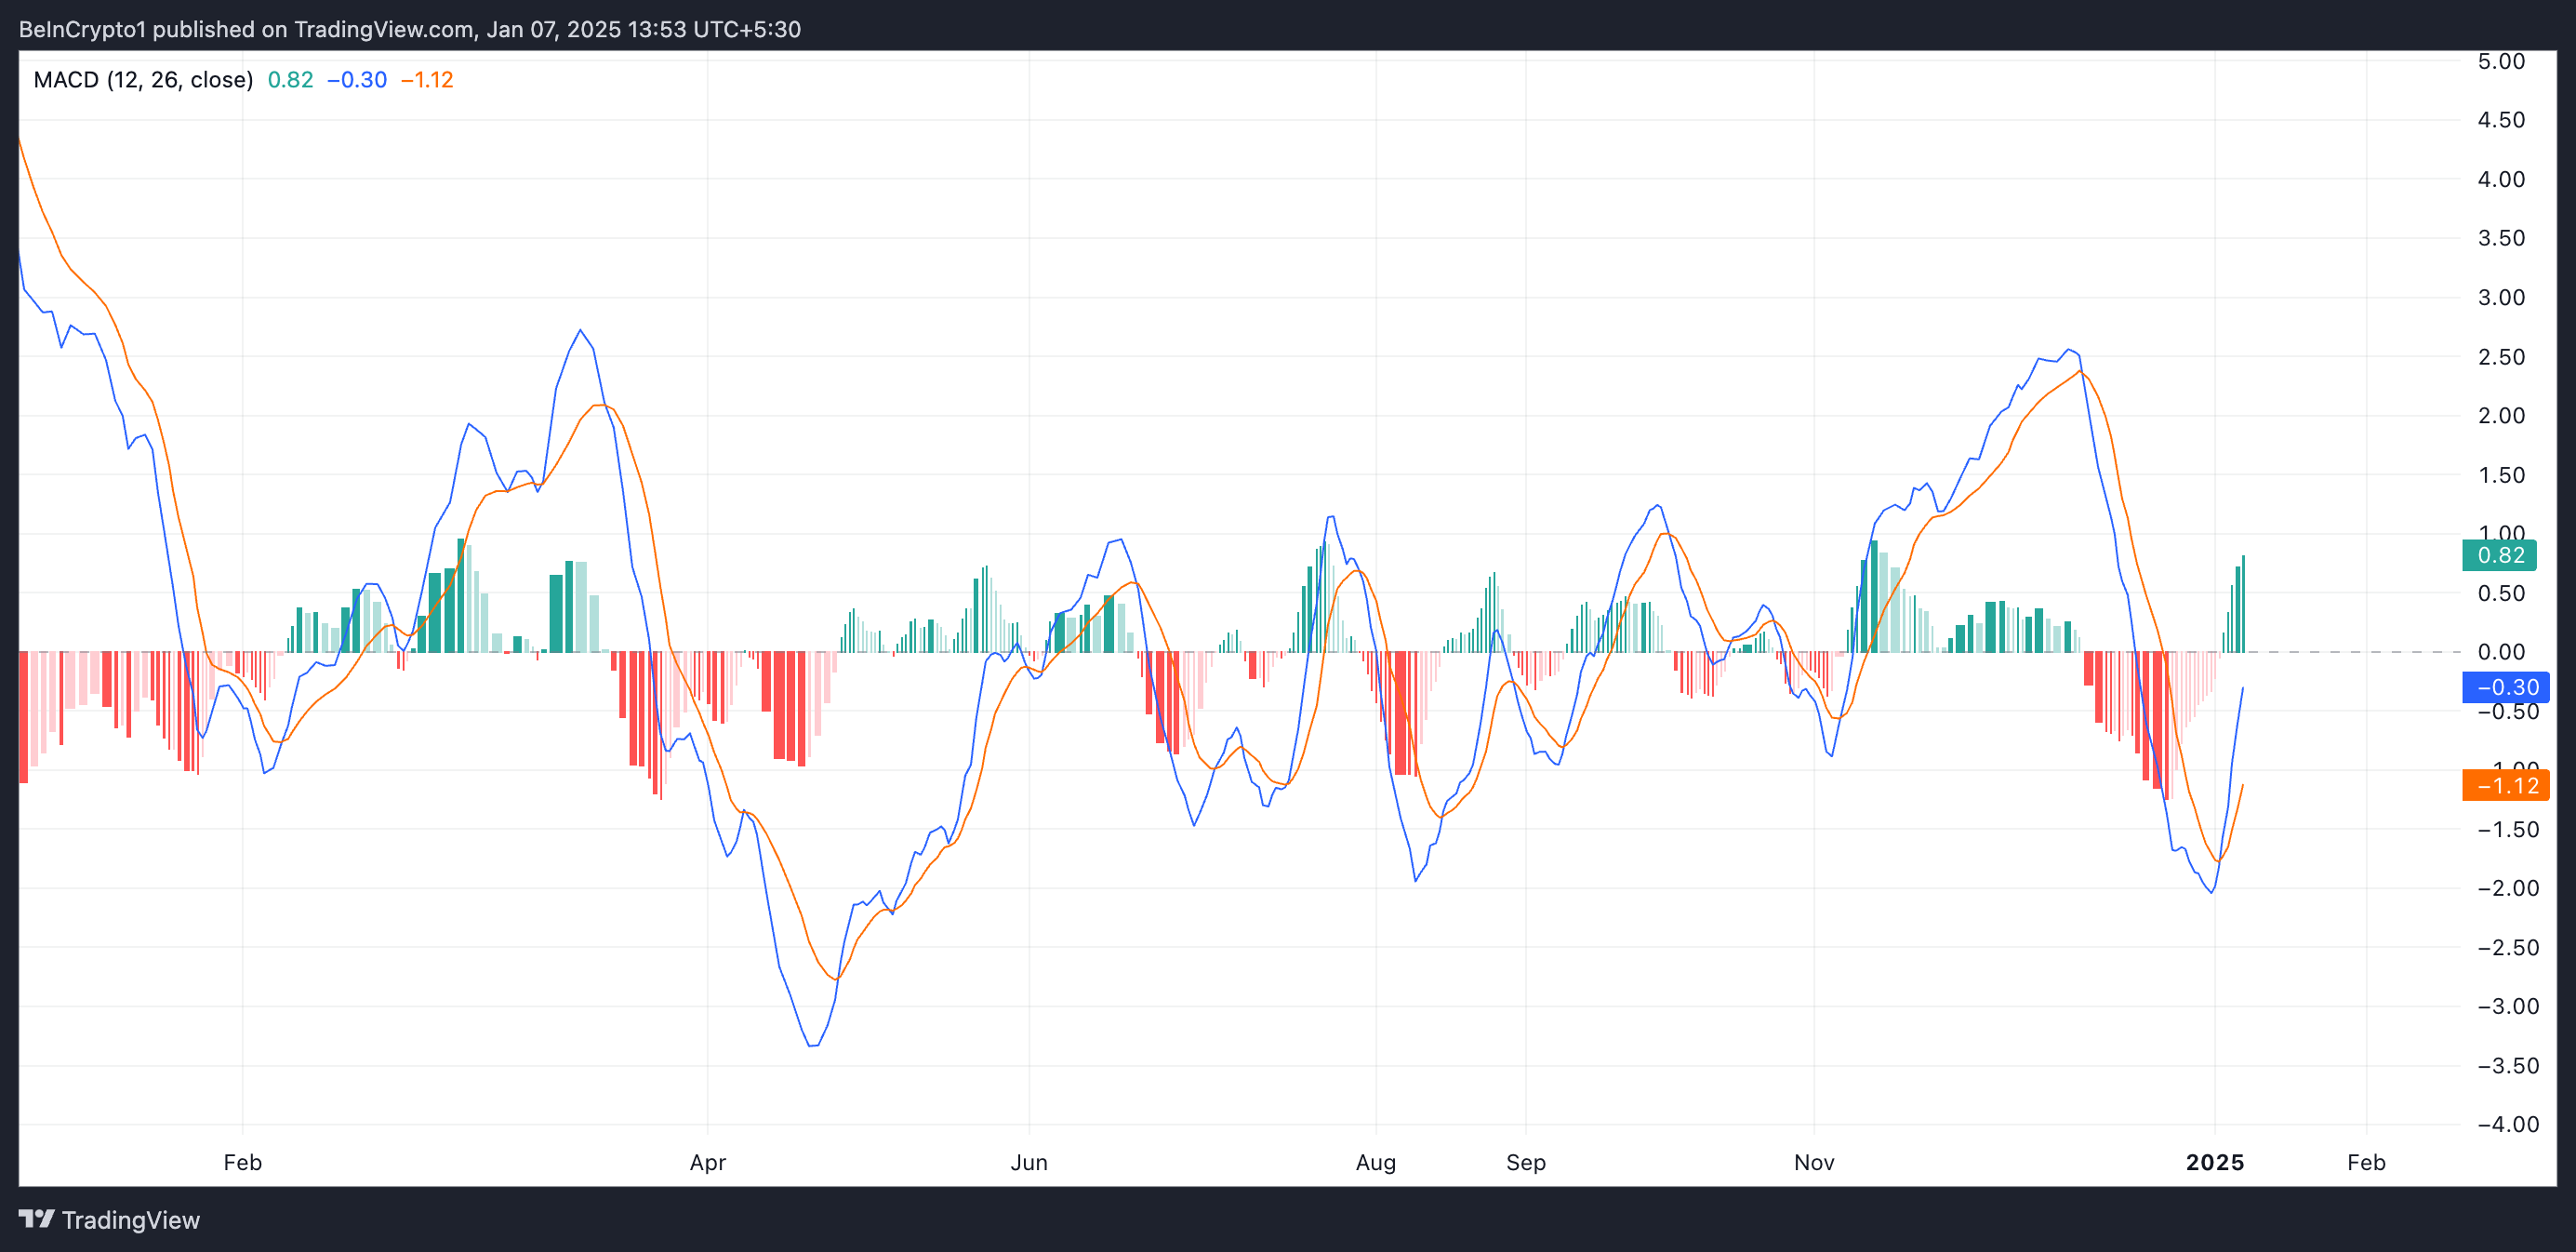
When this indicator is set up this way, it indicates bullish momentum. This means that if the trend persists, the Injective token price may continue to rise.
$INJ Price Prediction: Can Momentum Push the Price Above $30?
As buying pressure climbs, $INJ’s price could breach the resistance formed at $28.72. If the bulls can sustain this momentum, $INJ could rally back above $30 and revisit its multi-month high of $35.26.
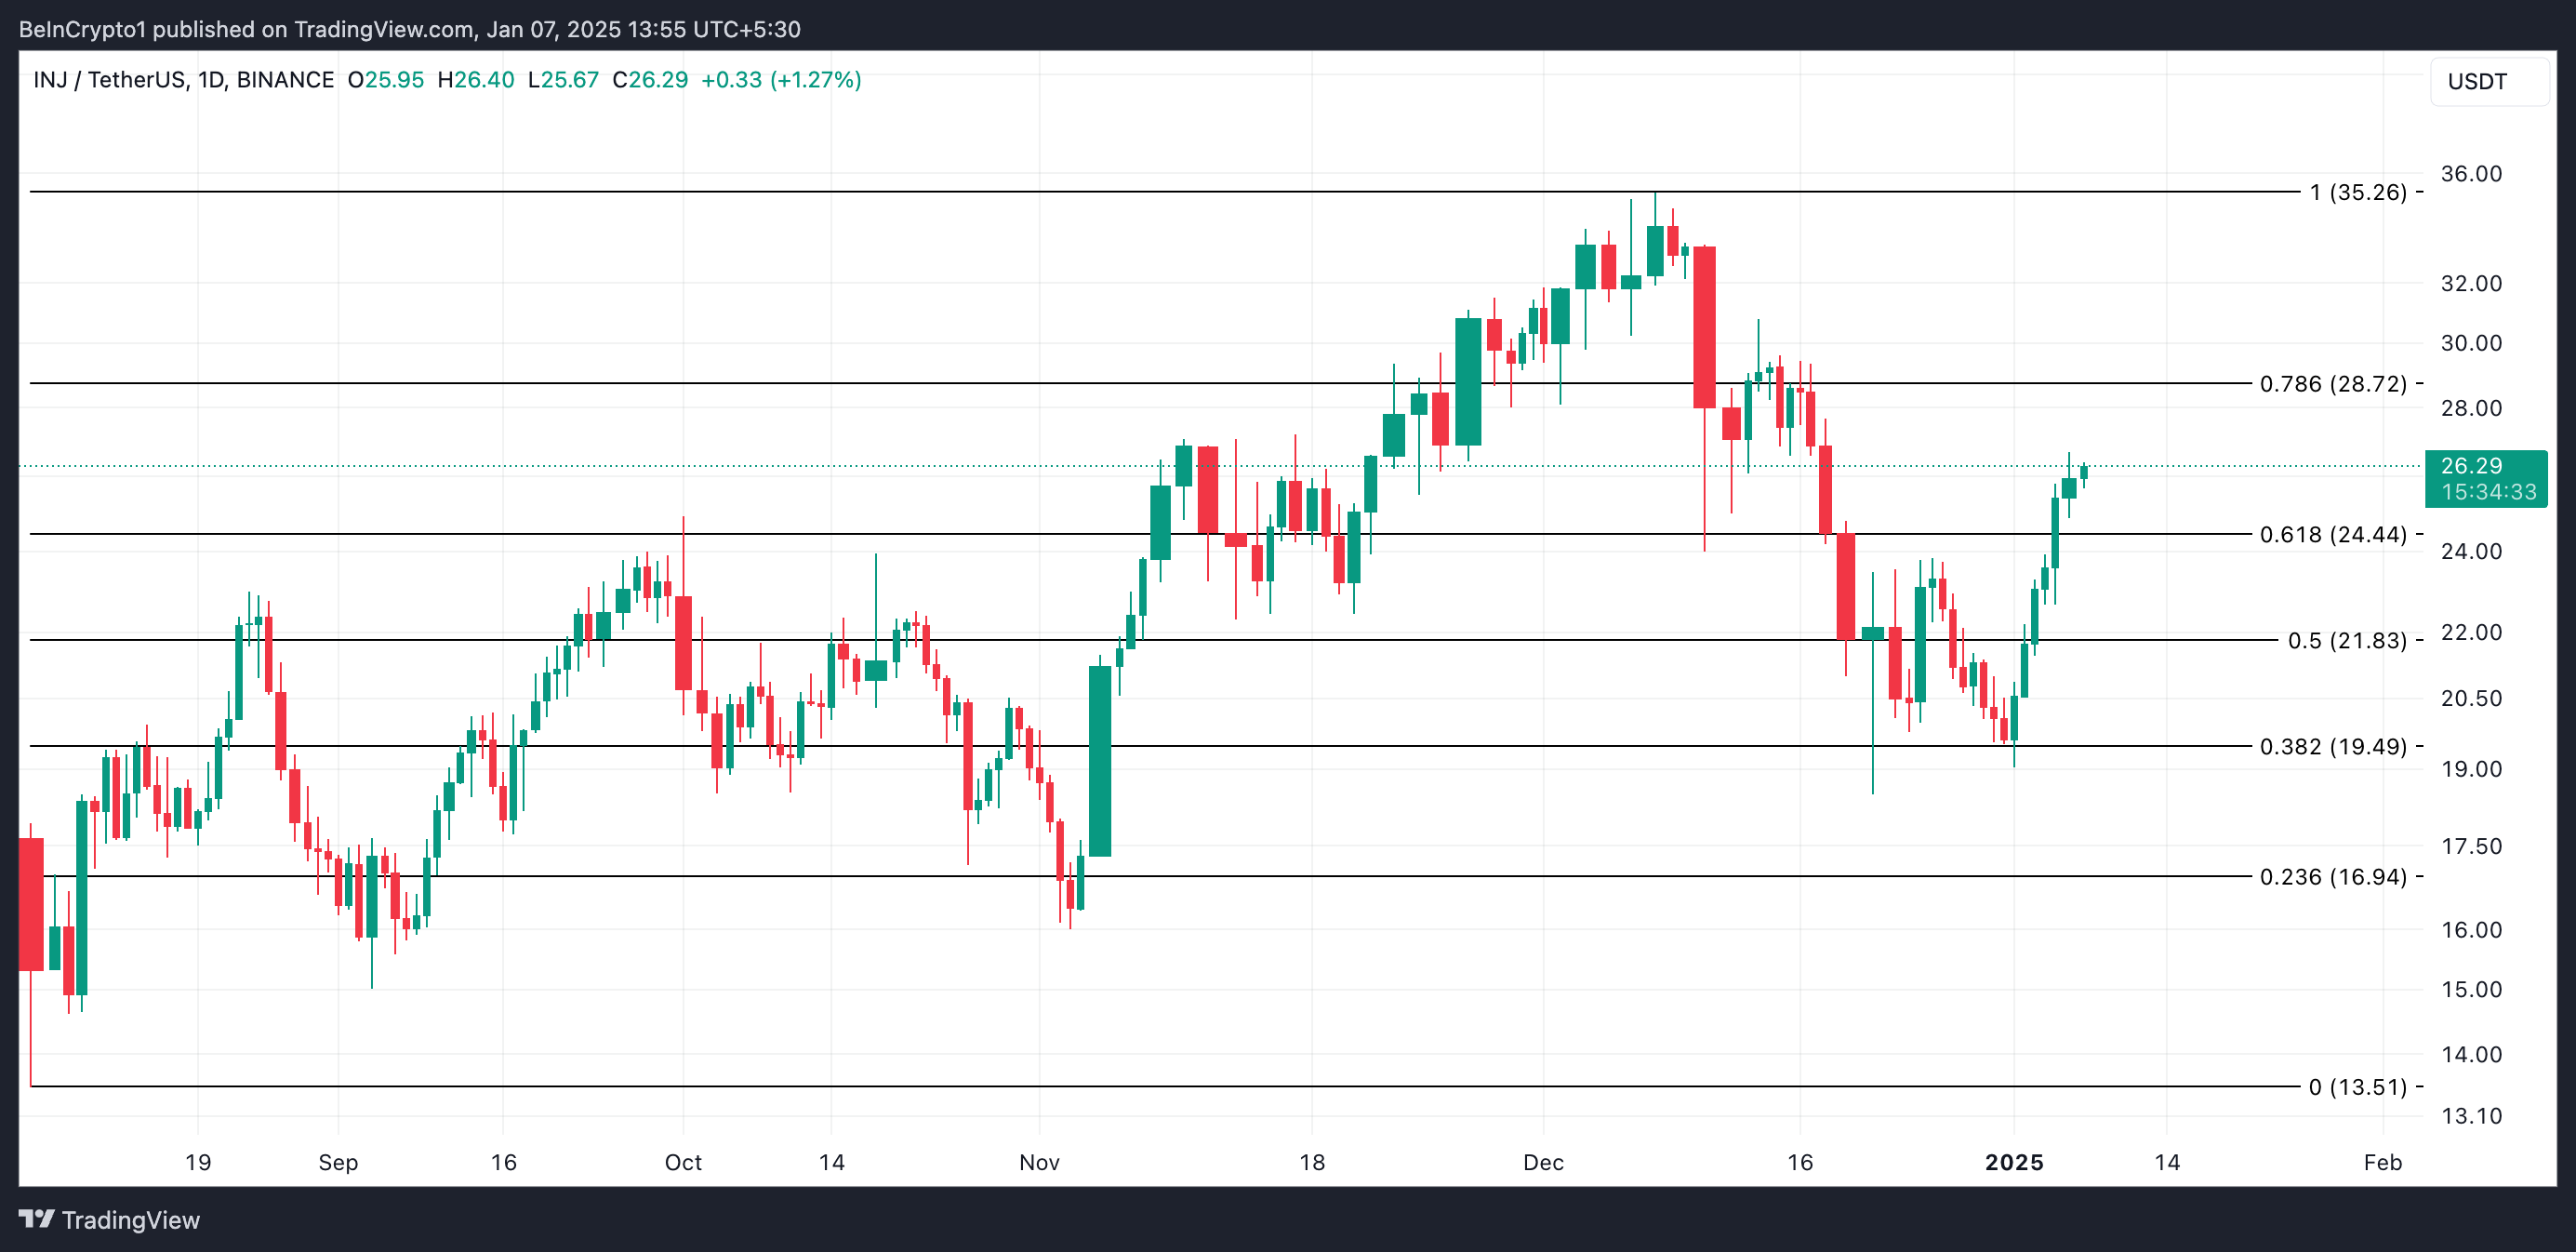
On the other hand, if the short bets win and the Injective token price reverses its current trend, it could plummet to $24.44.


