


 7
7
Injective ($INJ) price has been on a tear, up 30% over the past seven days and surging 14% in the last 24 hours. Its trading volume has skyrocketed by over 250% in the same period, reaching $274 million.
This strong price performance is supported by bullish technical indicators, including an overbought RSI at 80.6 and a BBTrend at its highest levels since November 2024. If the golden cross materializes, $INJ could see further gains, targeting $26.5, $29.4, and potentially $35.2, but downside risks remain if support levels fail to hold.
$INJ RSI Is Currently In The Overbought Zone
Injective Relative Strength Index (RSI) has seen a sharp increase, now sitting at 80.6, up from 61 just one day ago and 36 a week ago when its price began its recent surge. The RSI is a momentum indicator that measures the speed and magnitude of price movements on a scale from 0 to 100, providing insight into whether an asset is overbought or oversold.
Readings above 70 typically signal overbought conditions, suggesting that a pullback or consolidation might be imminent, while readings below 30 indicate oversold conditions, often hinting at a potential price rebound.
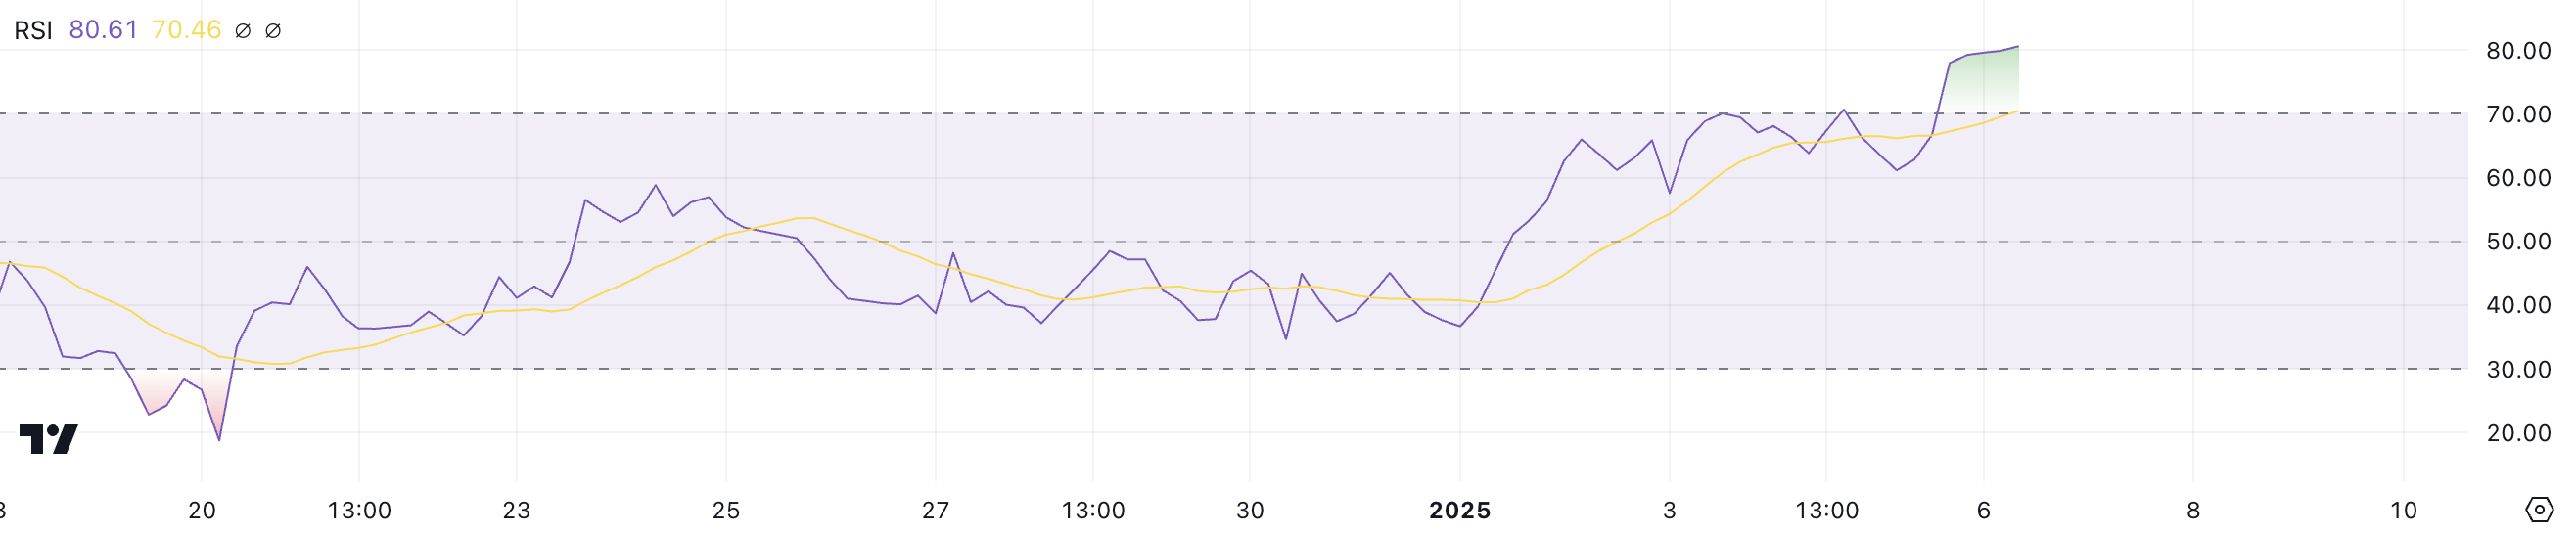
At its current level of 80.6, $INJ RSI suggests that the asset is deep in overbought territory, reflecting strong bullish momentum driven by aggressive buying.
While this indicates high market enthusiasm and potential for short-term gains, it also raises caution for a possible cooldown.
Injective BBTrend Reached Highest Levels Since November 2024
Injective was launched with the promise of being a layer-1 blockchain to revolutionize finance. Its BBTrend currently stands at 11.05, just shy of its recent peak of 11.36, reached a few hours ago. This marks its highest level since late November 2024, reflecting a significant recovery from -4.58 just two days ago on January 4.
BBTrend, derived from Bollinger Bands, measures the strength and direction of a price trend. Positive values indicate upward momentum, and negative values suggest bearish conditions.
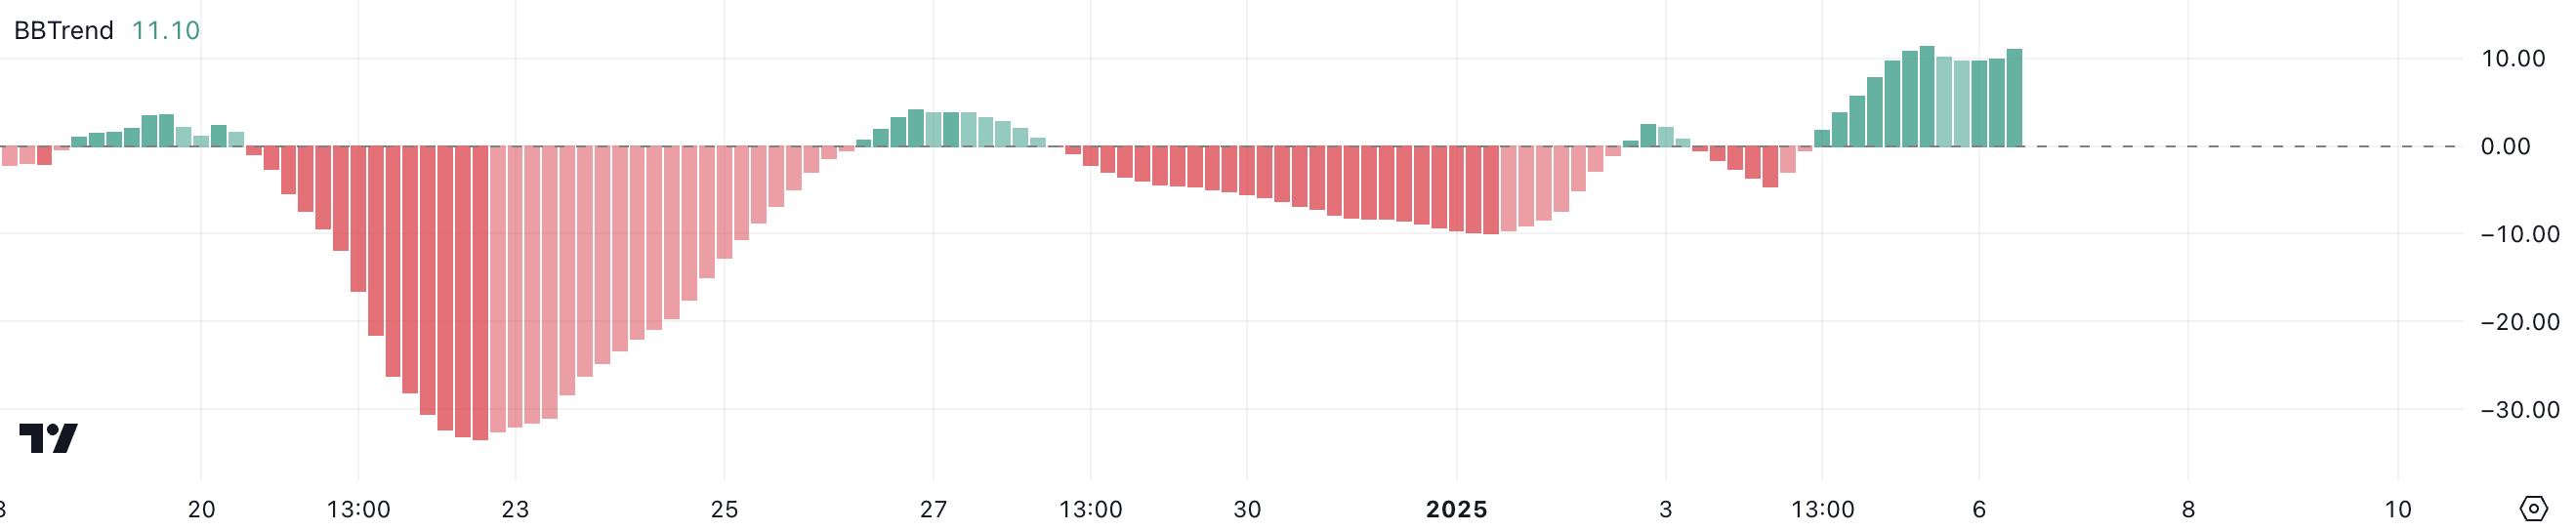
At its current level, $INJ’s BBTrend highlights strong bullish momentum, suggesting that buyers are firmly in control and driving the price higher. The sharp recovery from negative territory shows a shift in market sentiment, favoring a continued uptrend.
However, with BBTrend near its recent highs, a stabilization or mild pullback could occur if buying pressure cools, though the overall trend remains positive. Traders should monitor whether $INJ price can sustain this momentum or if a consolidation phase emerges in the short term.
$INJ Price Prediction: A New 36.4% Surge Ahead?
The EMA lines for $INJ price indicate that the price is on the verge of forming a golden cross. That happens when a short-term EMA crosses above a long-term EMA. If this occurs, it could reignite buying momentum and propel $INJ to test the resistance at $26.5, as the narrative around crypto trying to revolutionize TradFi gains grows.
A breakout above this level might pave the way for further gains, with $29.4 as the next key target. If momentum remains strong, $INJ could even test $35.2, a level not seen since early December 2024.
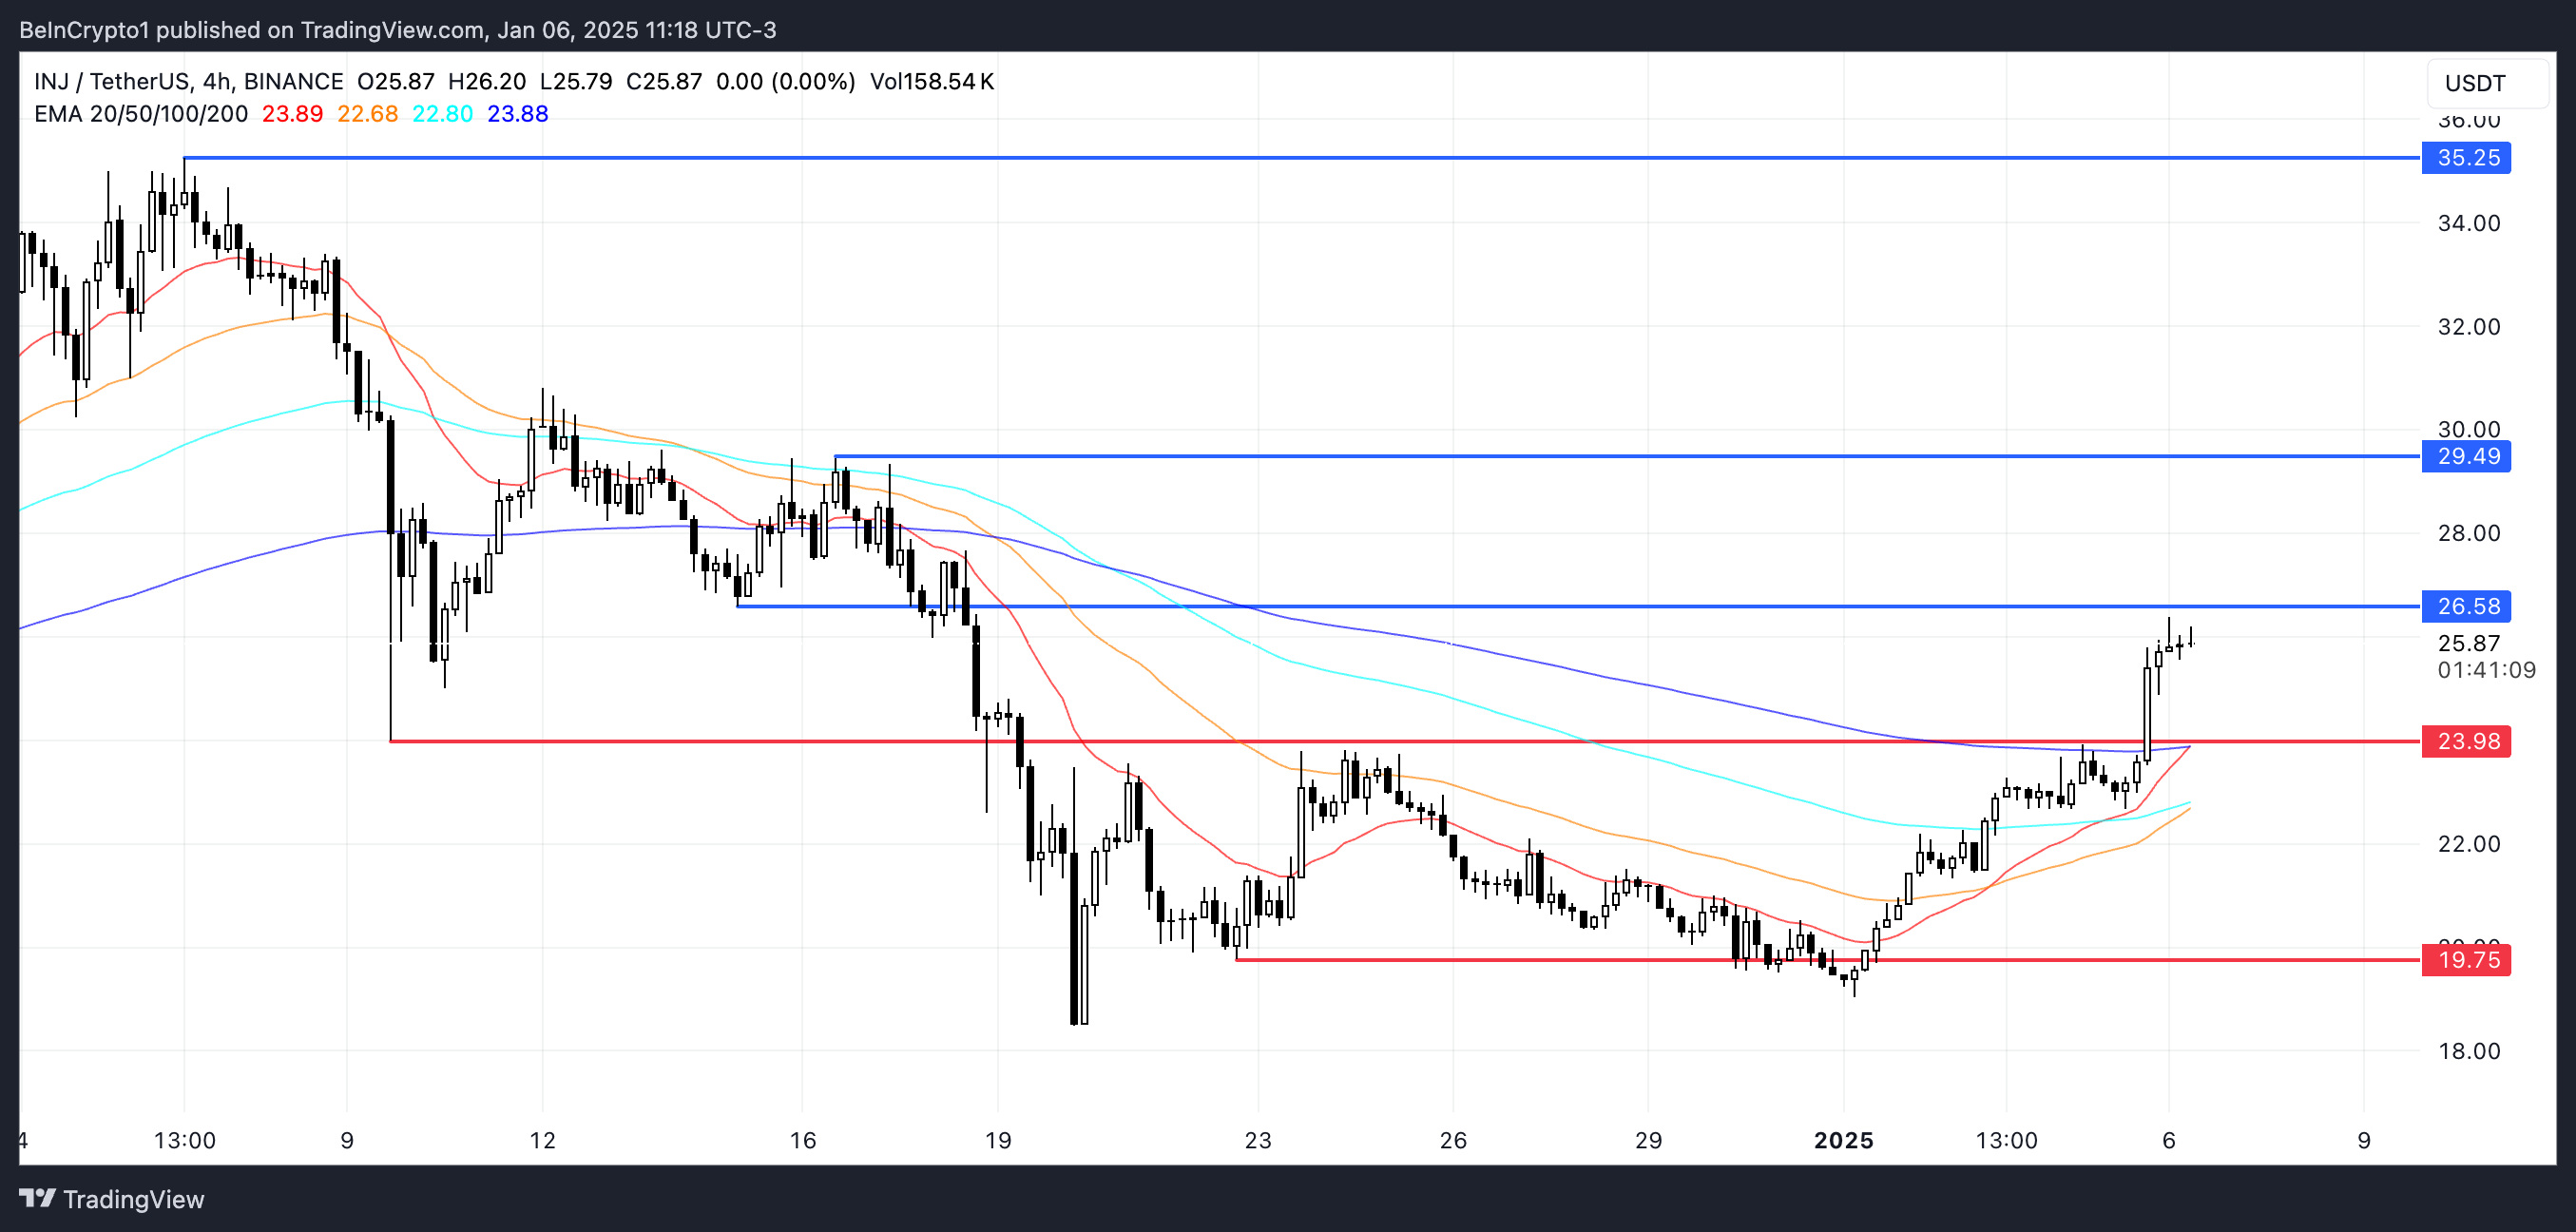
Conversely, if the trend reverses and the golden cross fails to materialize, $INJ price could face downside pressure. The first critical support lies at $23.98, and a break below this level could lead to further declines. In a more bearish scenario, the price could fall to $19.7.

