


 10
10
Hedera ($HBAR) price has dropped more than 16% over the past seven days, reflecting a prolonged downtrend. However, technical indicators show weakening bearish momentum, with the ADX falling to 11.46, signaling reduced trend strength.
The altcoin faces a critical decision point, with support at $0.233 and resistance at $0.274, which will likely determine whether the price can stabilize or continue its decline.
$HBAR ADX Shows the Downtrend Is Weakening
$HBAR ADX is currently at 11.46, significantly lower than the 23 recorded three days ago, signaling a sharp decline in trend strength. The drop in ADX reflects a weakening downtrend, even as $HBAR remains under selling pressure.
This low ADX value suggests that the bearish momentum is losing intensity, potentially leading to reduced price volatility or a consolidation phase in the short term.
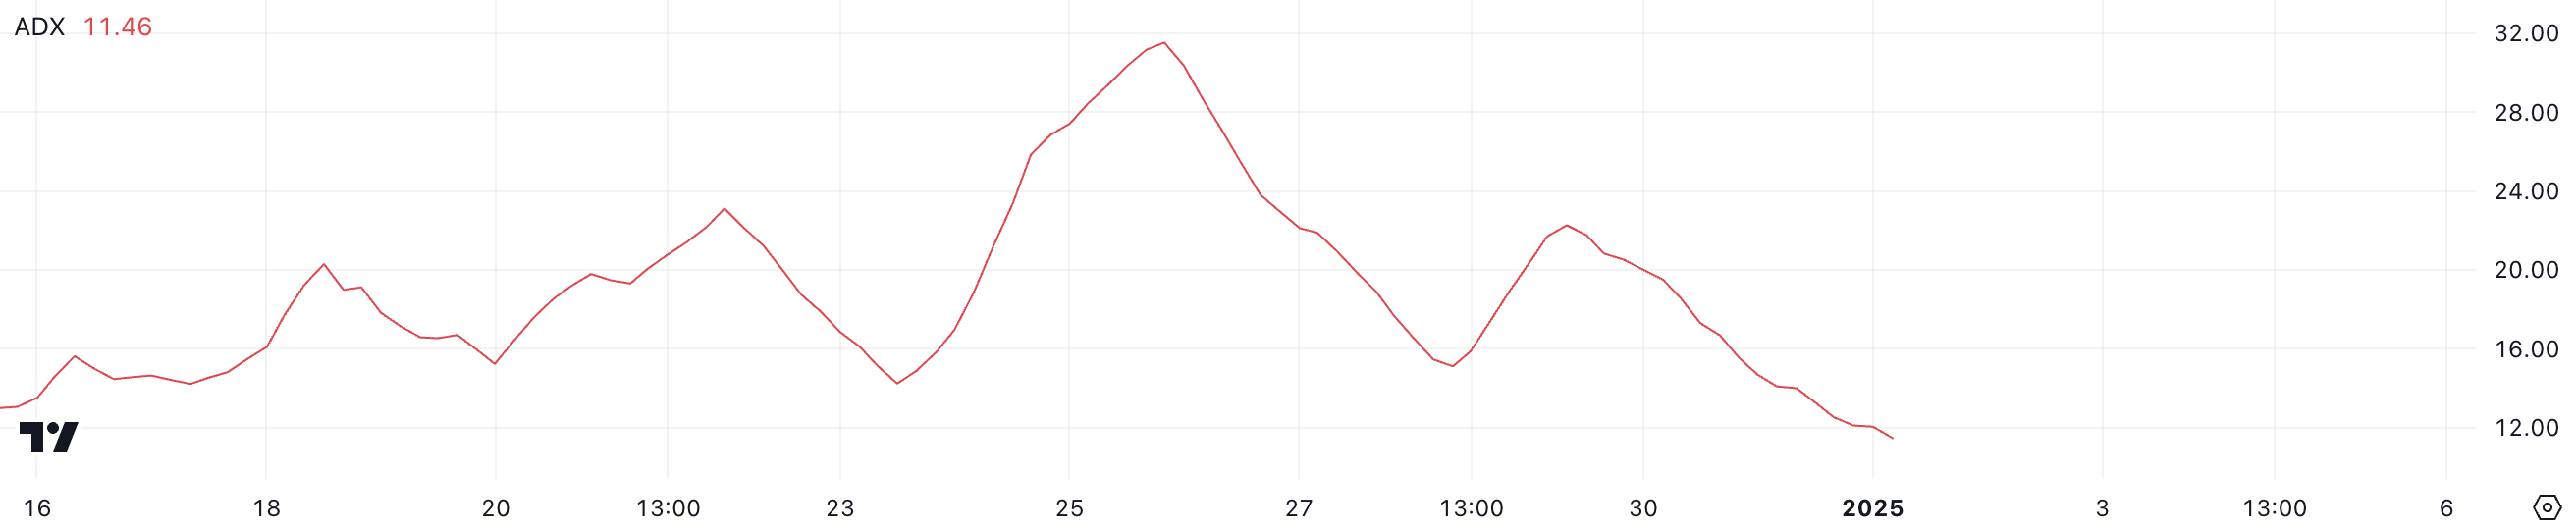
The Average Directional Index (ADX) measures the strength of a trend, whether bullish or bearish, on a scale from 0 to 100. Readings above 25 indicate a strong trend, while values below 20, like Hedera’s current 11.46, suggest a weak or absent trend.
With $HBAR price down more than 16% in the last seven days and in a downtrend, the low ADX indicates that the selling pressure may not have enough momentum to sustain further sharp declines. However, unless the ADX rises to confirm stronger trend dynamics, $HBAR’s price may remain range-bound or see limited movement.
Hedera Ichimoku Cloud Reflects a Bearish Setup
$HBAR’s Ichimoku Cloud chart reveals a bearish setup, with the price below the red cloud, signaling downward momentum. The cloud, formed by Senkou Span A and Senkou Span B, strengthens bearish sentiment as Senkou Span A remains below Senkou Span B.
This configuration suggests that selling pressure is dominant and that Hedera has struggled to find support for a potential reversal.
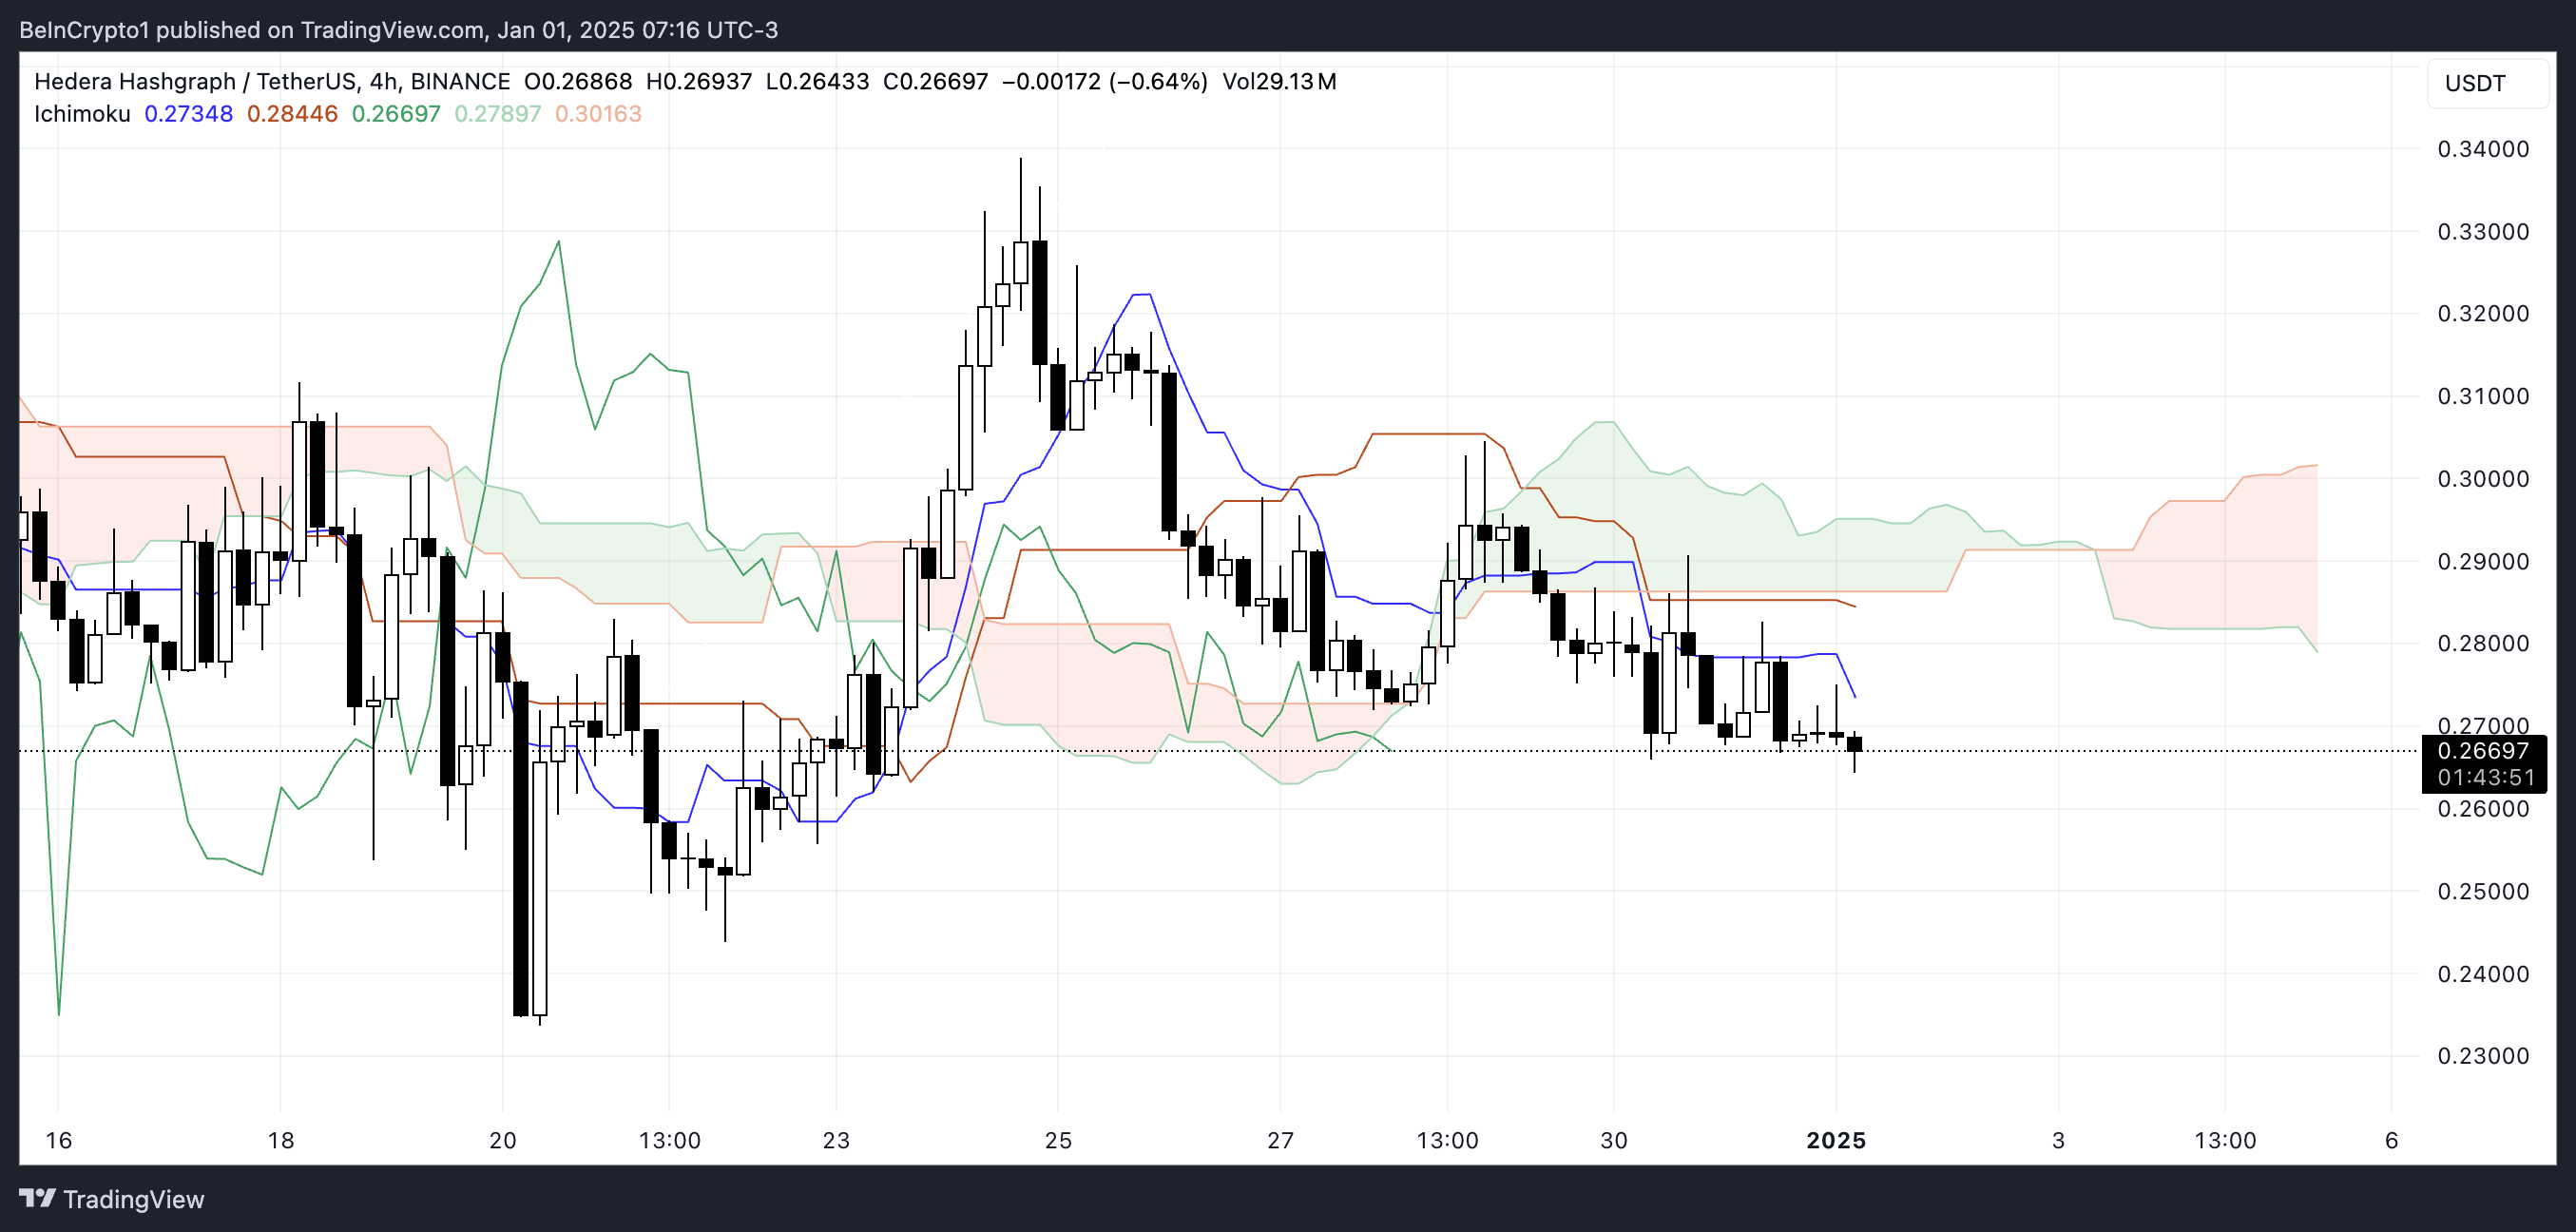
The blue Tenkan-sen (conversion line) remains below the orange Kijun-sen (baseline), confirming the bearish trend as short-term momentum lags behind the longer-term average. Additionally, the green lagging span (Chikou Span) is positioned below the price action and the cloud, further reinforcing consistent bearish momentum.
For $HBAR to signal a bullish reversal, the price would need to break above the cloud and hold those levels, which currently seems unlikely given the prevailing indicators.
$HBAR Price Prediction: A Further 12.7% Correction?
$HBAR price closest strong support lies around $0.233, indicating that its price could fall by another 12.7% if the current downtrend persists.
However, as suggested by the declining ADX, the downtrend is losing momentum, which could provide relief and limit further declines. If the support at $0.233 holds, $HBAR may consolidate or attempt to recover in the short term.
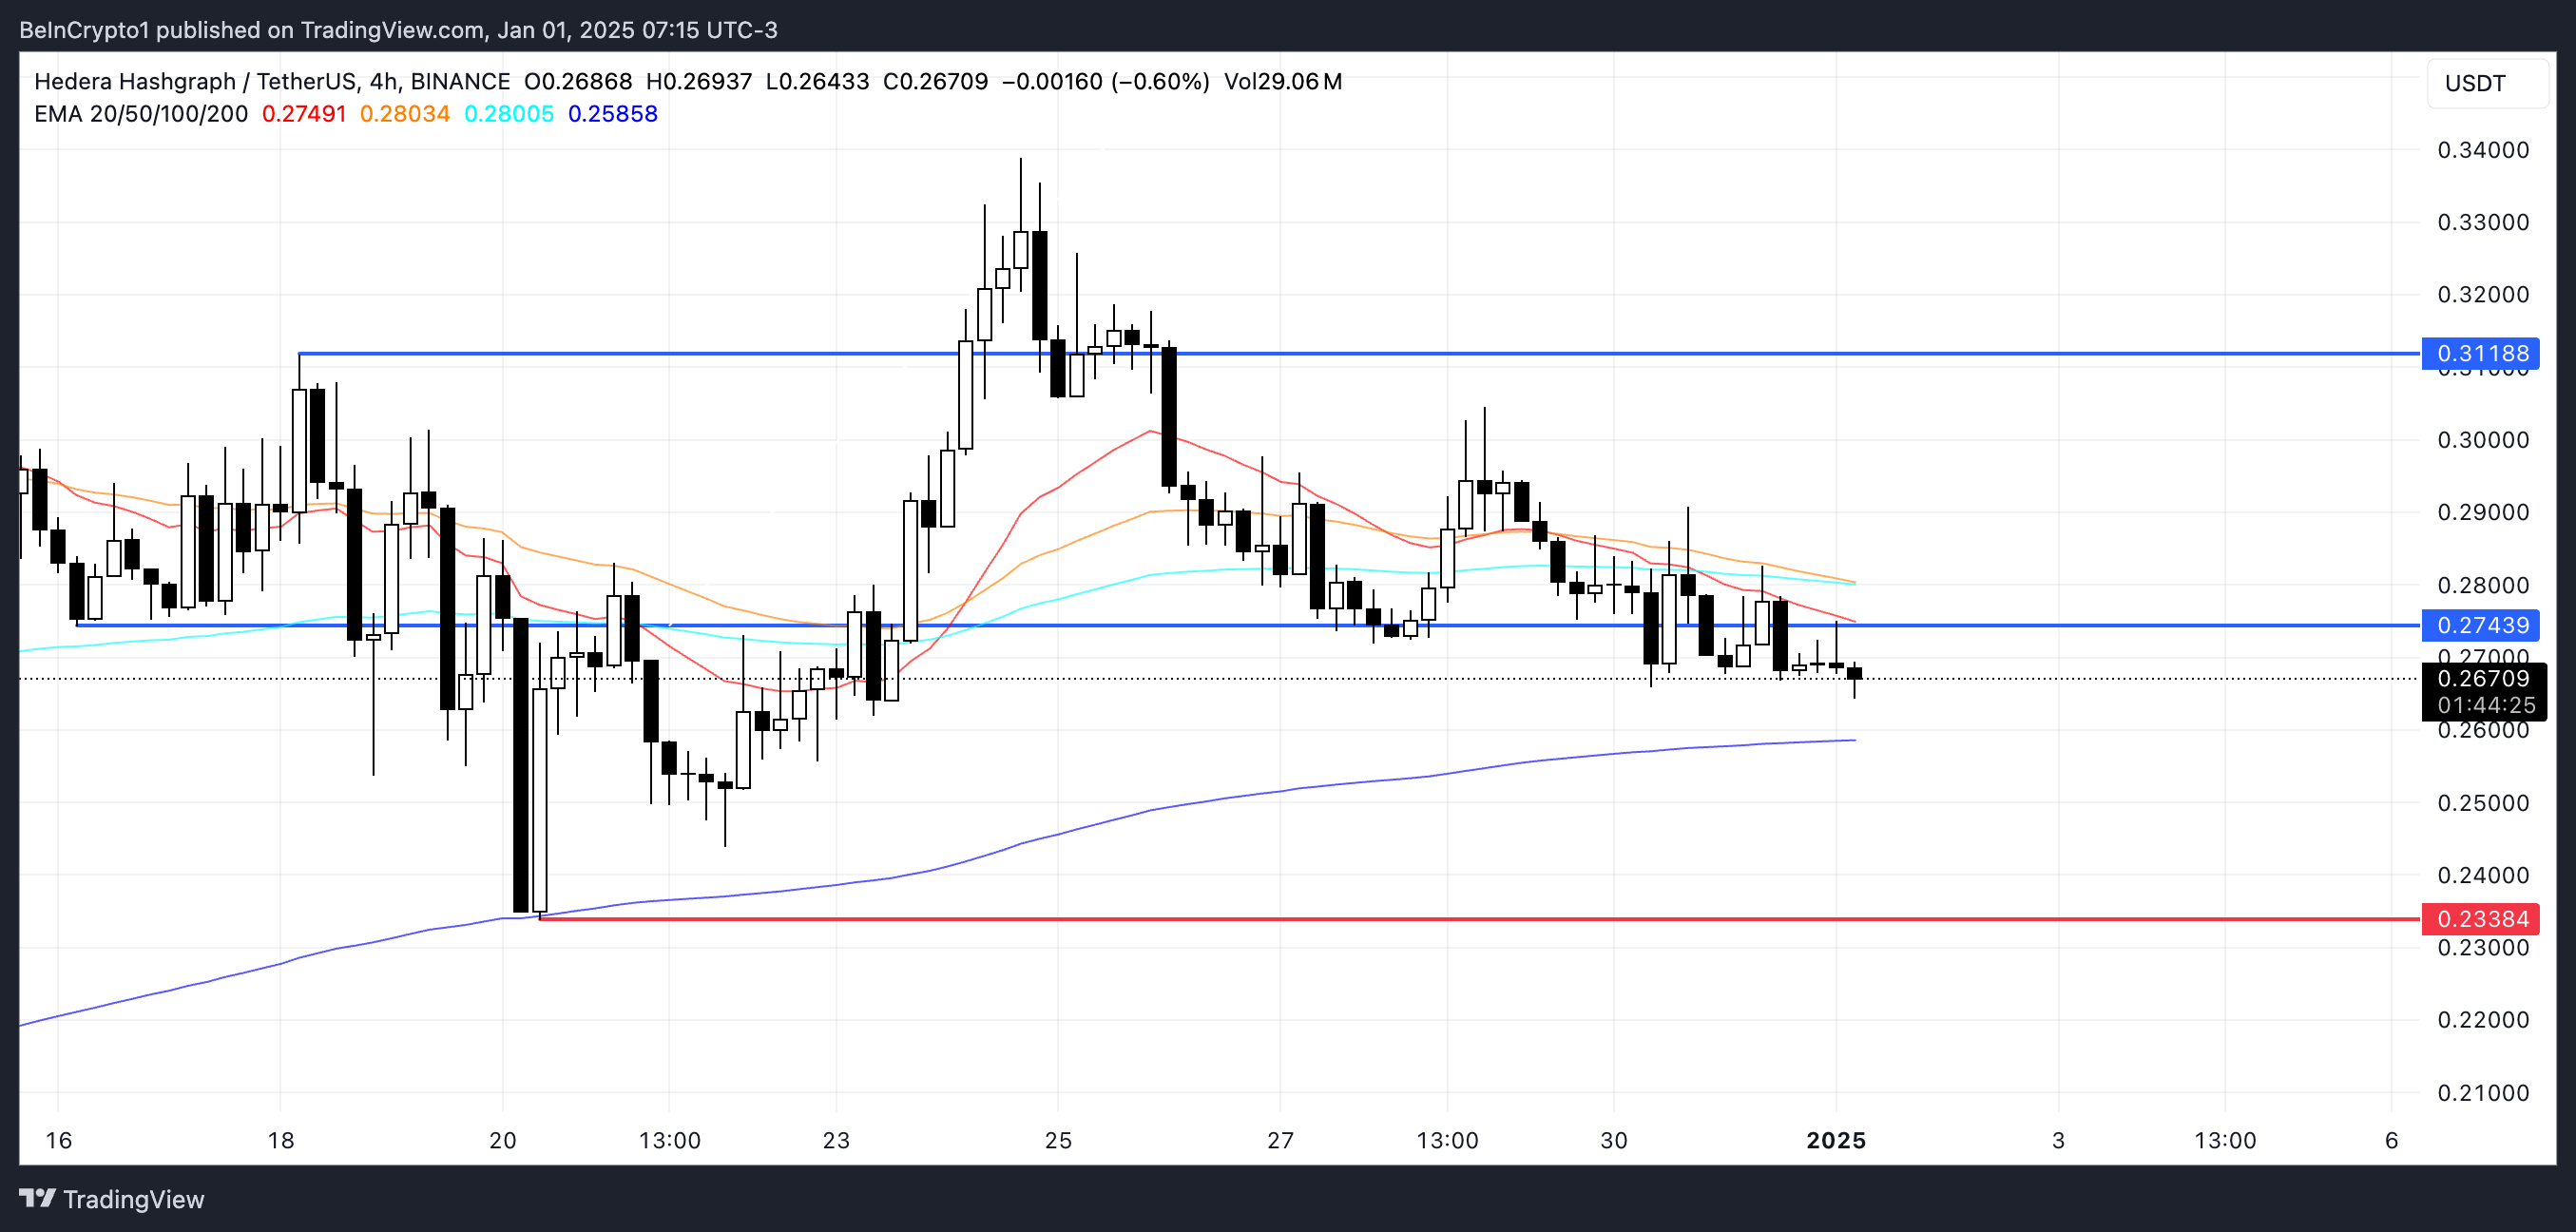
If the trend reverses, $HBAR price could first test the resistance at $0.274. Breaking through this level would signal increased bullish momentum, potentially driving the price toward the next resistance at $0.311.
These levels will determine whether Hedera price can break free from its bearish trajectory or continue to face selling pressure in the coming days.
