


 12
12
Hedera ($HBAR) price reached multiple highs in December but has now fallen more than 4% in the last 24 hours.
Although several indicators suggest the correction may end soon, a looming death cross threatens to deepen the decline.
$HBAR Is Still In a Downtrend
Hedera DMI chart reveals that its ADX is currently at 18.2, indicating weak trend strength. The +DI (Directional Indicator) stands at 18.8, while the -DI is slightly higher at 19.3, showing that bearish momentum remains slightly dominant.
This setup shows that $HBAR is still in a downtrend, but the lack of a strong ADX suggests the trend is not firmly established, leaving room for potential shifts in market direction.
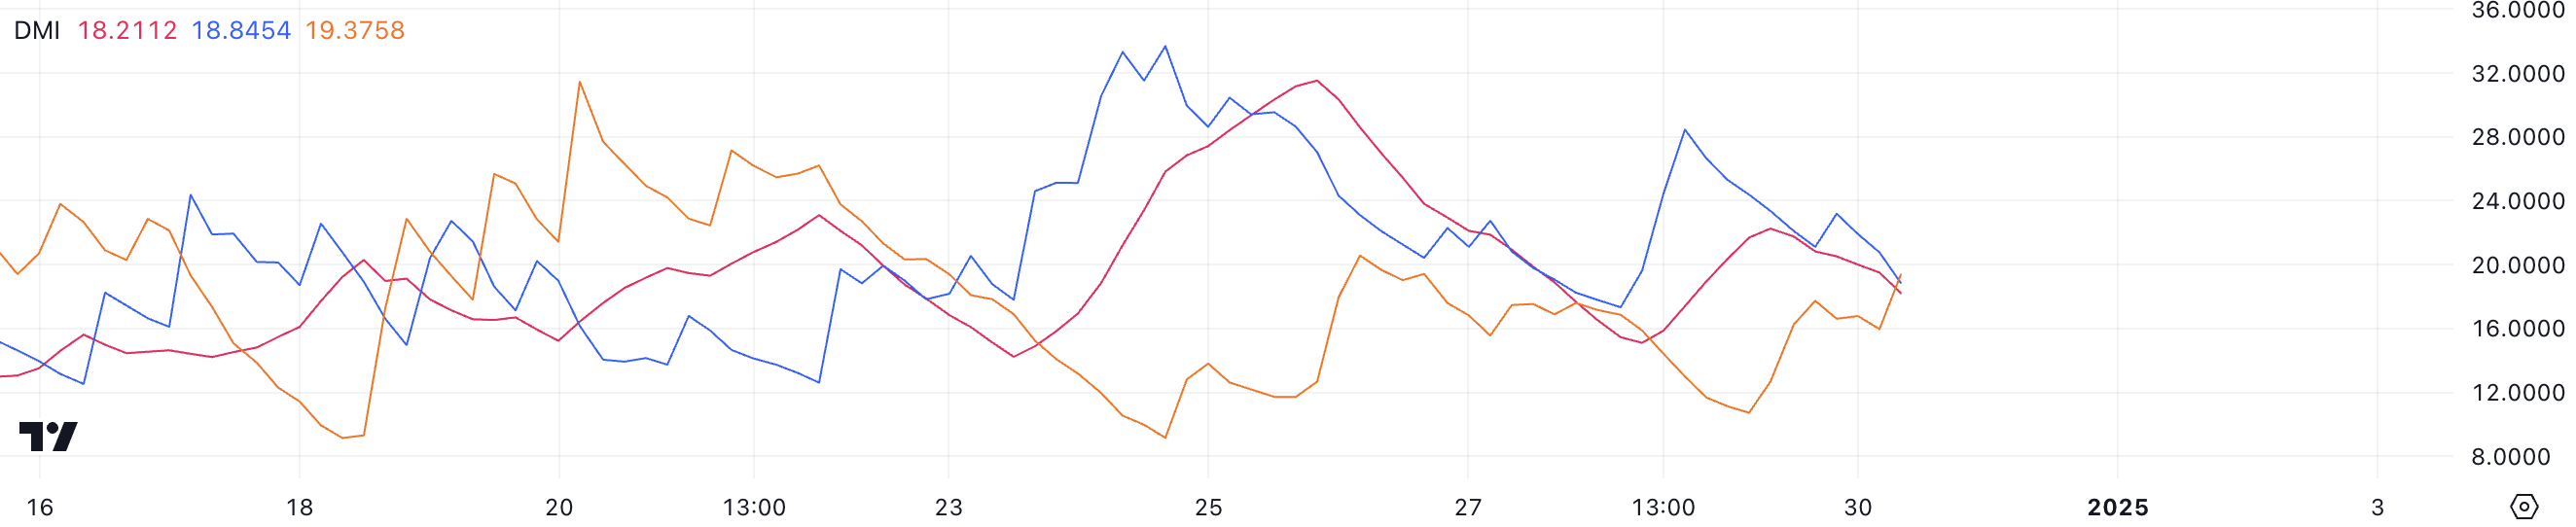
The Average Directional Index (ADX) measures the strength of a trend on a scale of 0 to 100, regardless of its direction. Values above 25 indicate a strong trend, while readings below 20, like $HBAR current 18.2, suggest weak or absent trend strength. The close proximity of +DI and -DI indicates that neither buyers nor sellers are exerting significant control.
For the short term, $HBAR price may remain range-bound or show limited movement unless one side gains a clear advantage, accompanied by a rising ADX to confirm stronger trend momentum.
Ichimoku Cloud Hints at Further Decline
The Ichimoku Cloud chart for Hedera indicates a bearish setup, with the price positioned below the red cloud. The red color of the cloud, formed by Senkou Span A and Senkou Span B, reflects bearish momentum as Senkou Span A remains below Senkou Span B. This configuration suggests that downward pressure persists in the market, keeping $HBAR under a bearish influence.
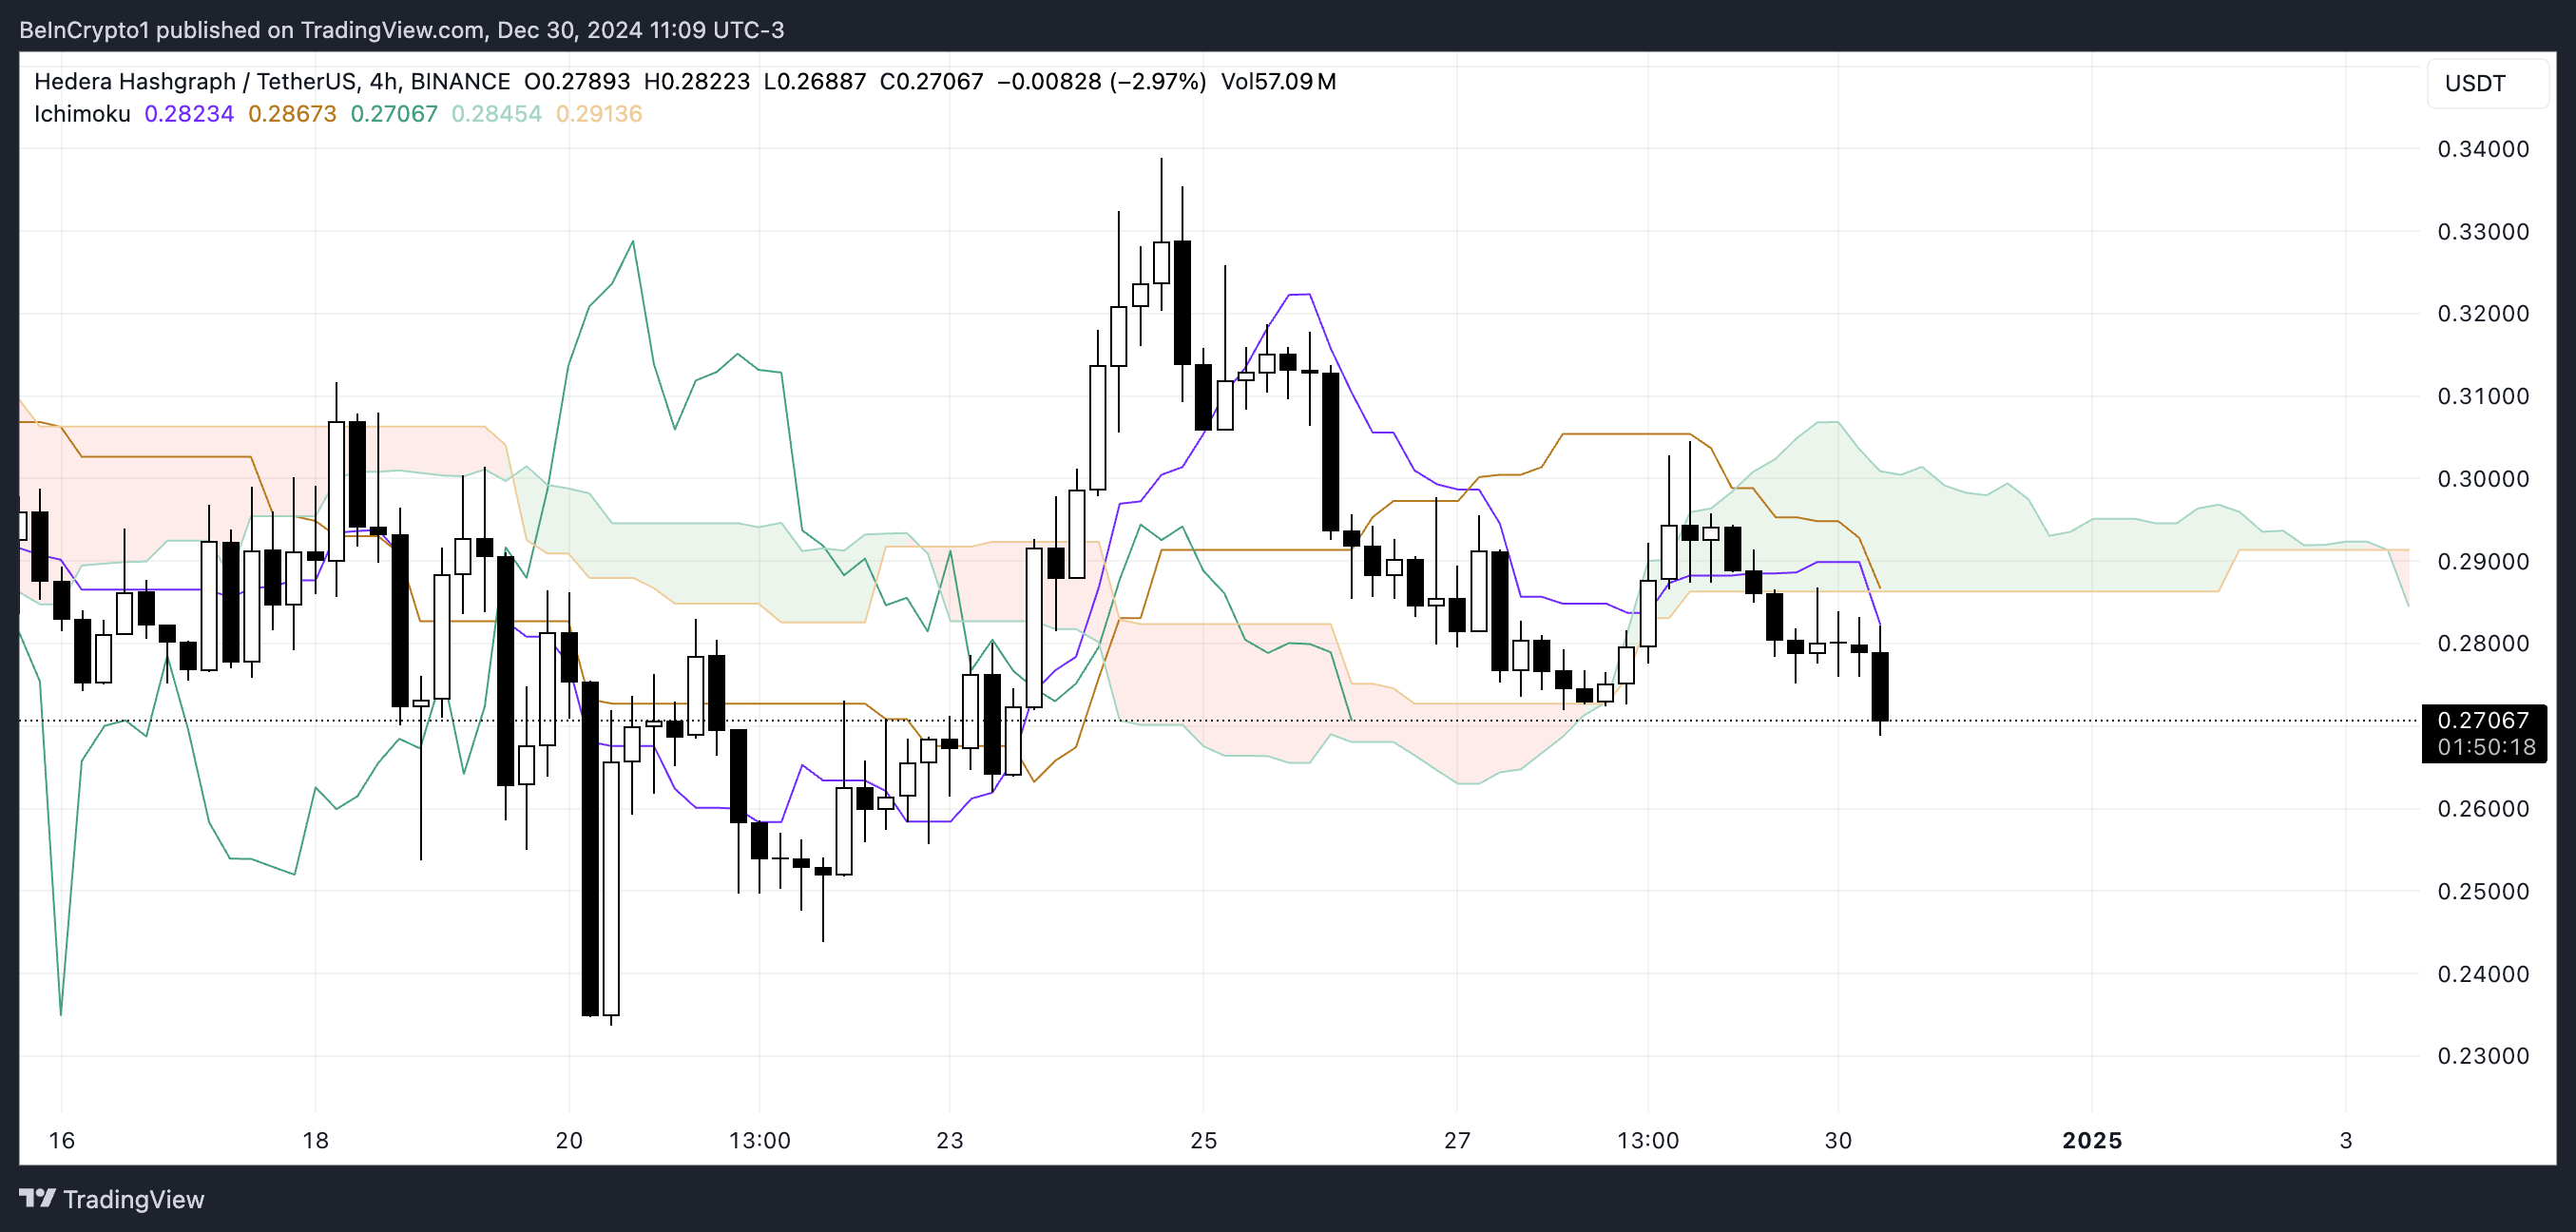
Additionally, the purple Tenkan-sen (conversion line) is below the orange Kijun-sen (baseline), reinforcing the bearish sentiment as short-term momentum trails behind the longer-term trend.
The green lagging span (Chikou Span) is also below the price action and the cloud, further confirming the dominance of bearish conditions. Overall, the Ichimoku setup indicates that $HBAR is likely to remain in a downtrend unless it can break above the cloud, signaling a potential reversal.
$HBAR Price Prediction: Will Hedera Fall 13.7% Next?
If the current downtrend in $HBAR price persists and strengthens, the price could fall further to test the support level at $0.233. That could happen if the short-term line (red line) crossed below the long-term one (light blue line), forming a death cross. A failure to hold this support could signal increased bearish momentum, potentially driving the price lower.
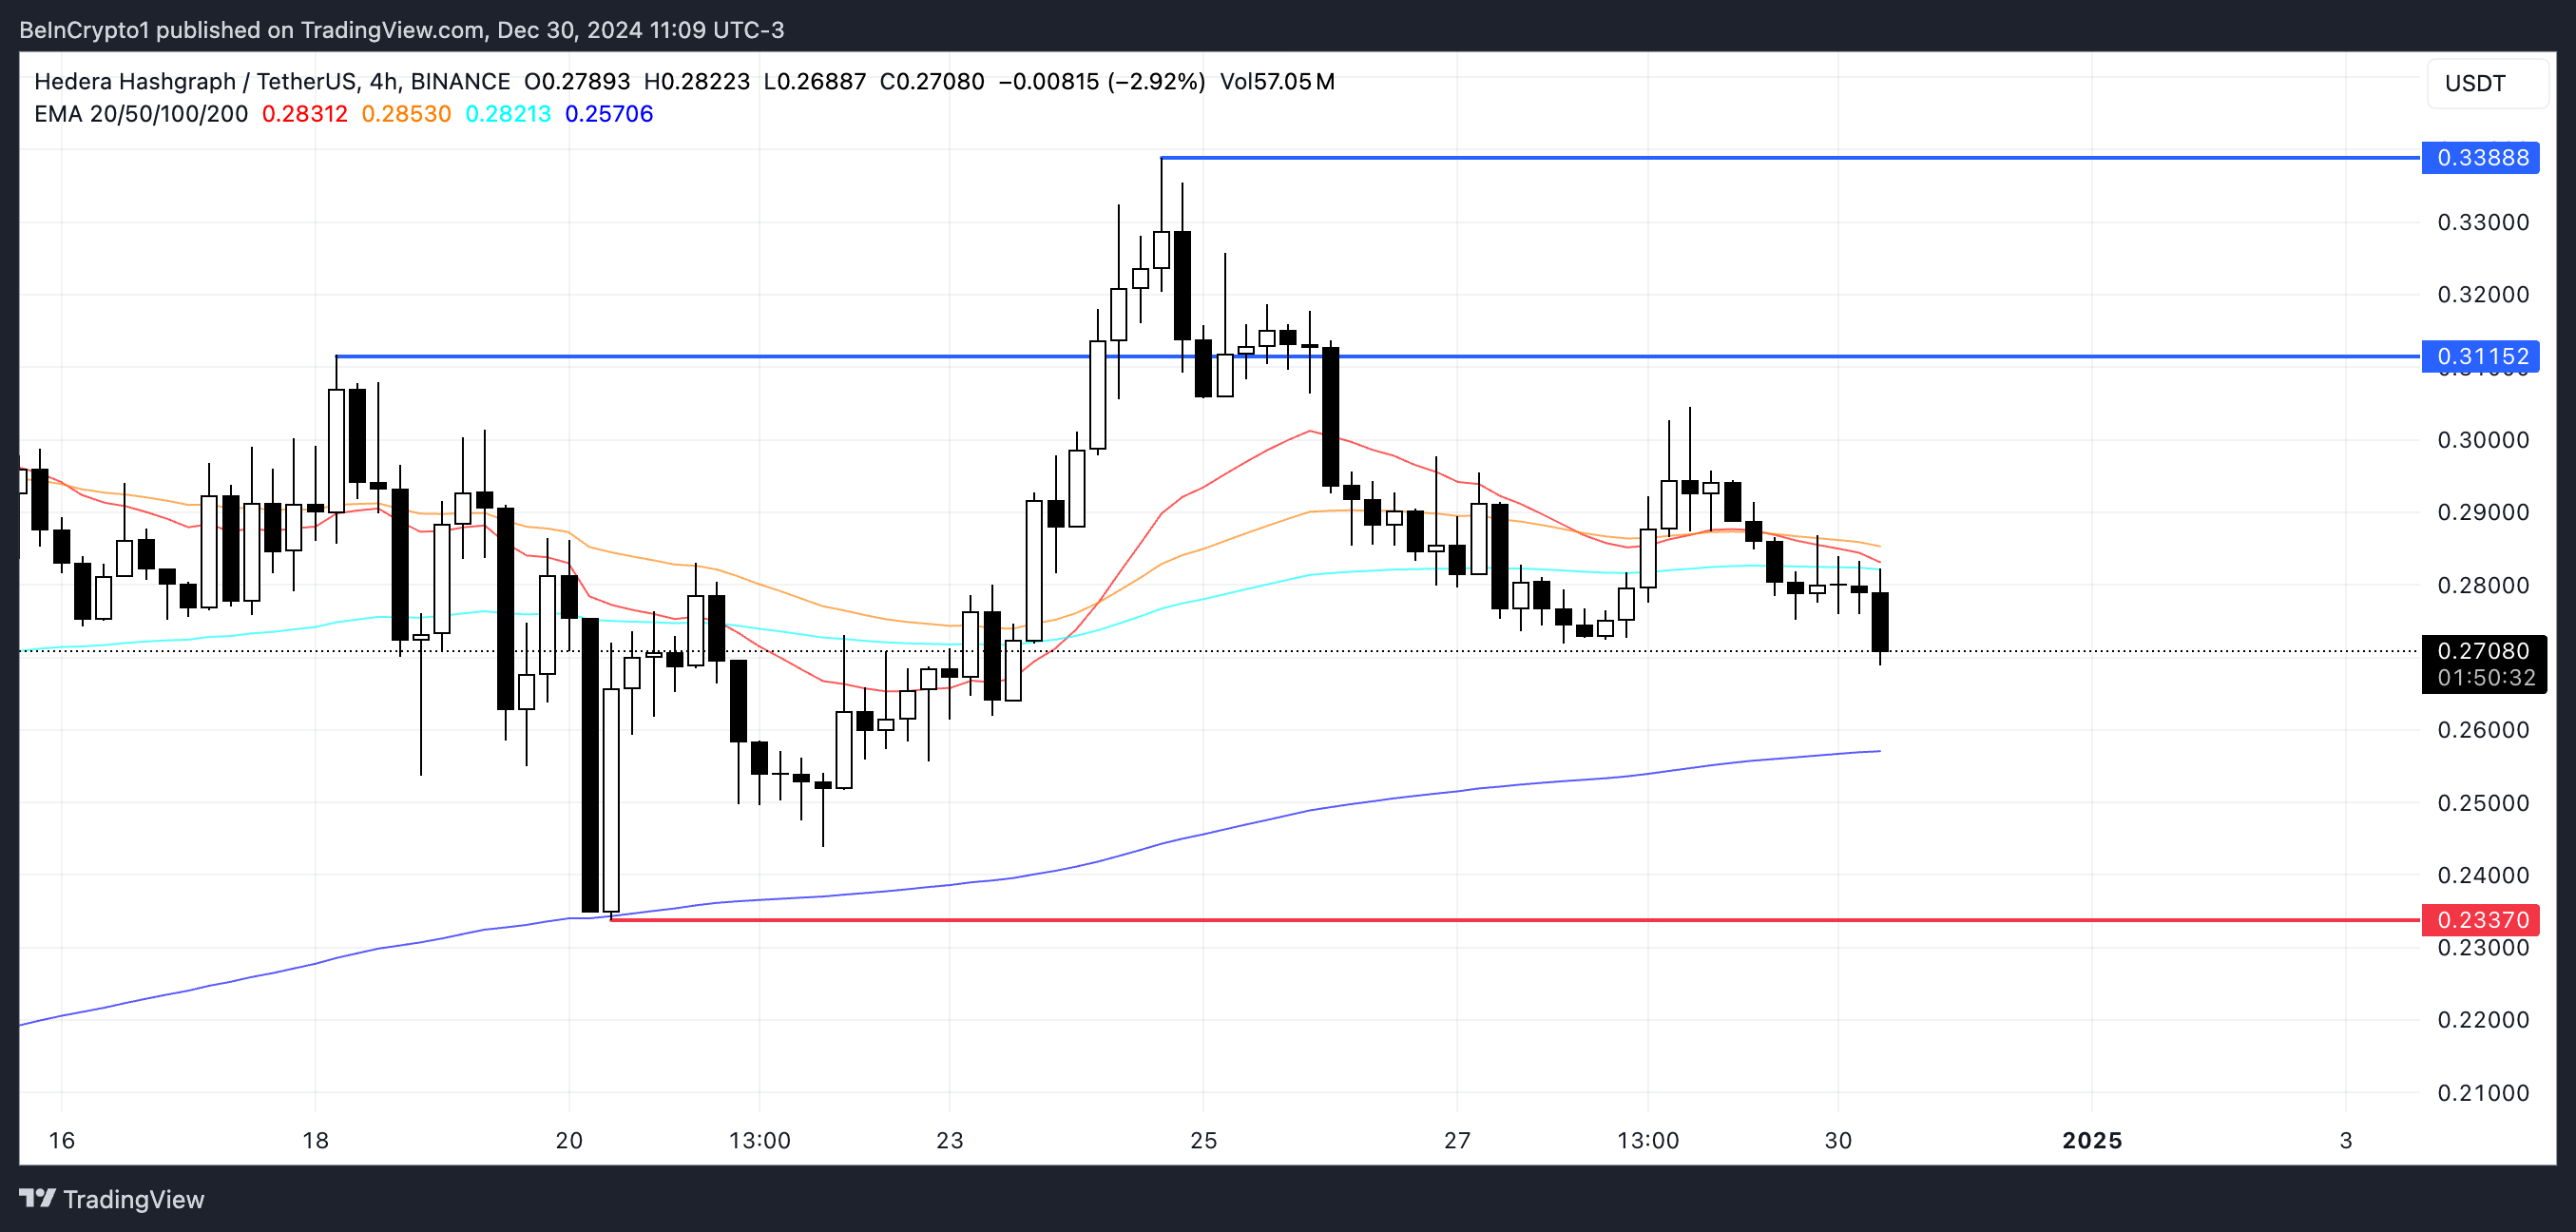
On the other hand, if the trend reverses and short-term lines crossed above long-term ones, $HBAR price could attempt a recovery.
In such a case, the price might test the resistance at $0.31, and a successful breakout above this level could pave the way for a move toward $0.33. A bullish reversal of this nature would signal renewed buying interest and potential momentum for further upside.
