


 5
5
The price of Hedera ($HBAR) has skyrocketed, climbing roughly 30% in the last 24 hours and over 115% in the past seven days. This explosive growth is backed by strong technical indicators, with the ADX signaling a strengthening trend and the Ichimoku Cloud chart confirming bullish momentum.
$HBAR’s price action suggests it could be gearing up for further gains, with resistance levels at $0.14 and $0.182 in sight. However, if the uptrend loses strength, support zones at $0.098 and $0.068 will play a crucial role in determining the next direction for $HBAR.
$HBAR Current Uptrend Is Strong
$HBAR’s ADX has surged to 42.47 from around 17 in just one day, signaling a rapid strengthening of the ongoing trend. This sharp rise indicates that $HBAR is transitioning from a weak or uncertain trend into a strong, clearly defined uptrend after the recent price surge.
Such a high ADX value reflects significant momentum behind the price movement, suggesting that the current uptrend is likely to continue in the near term.
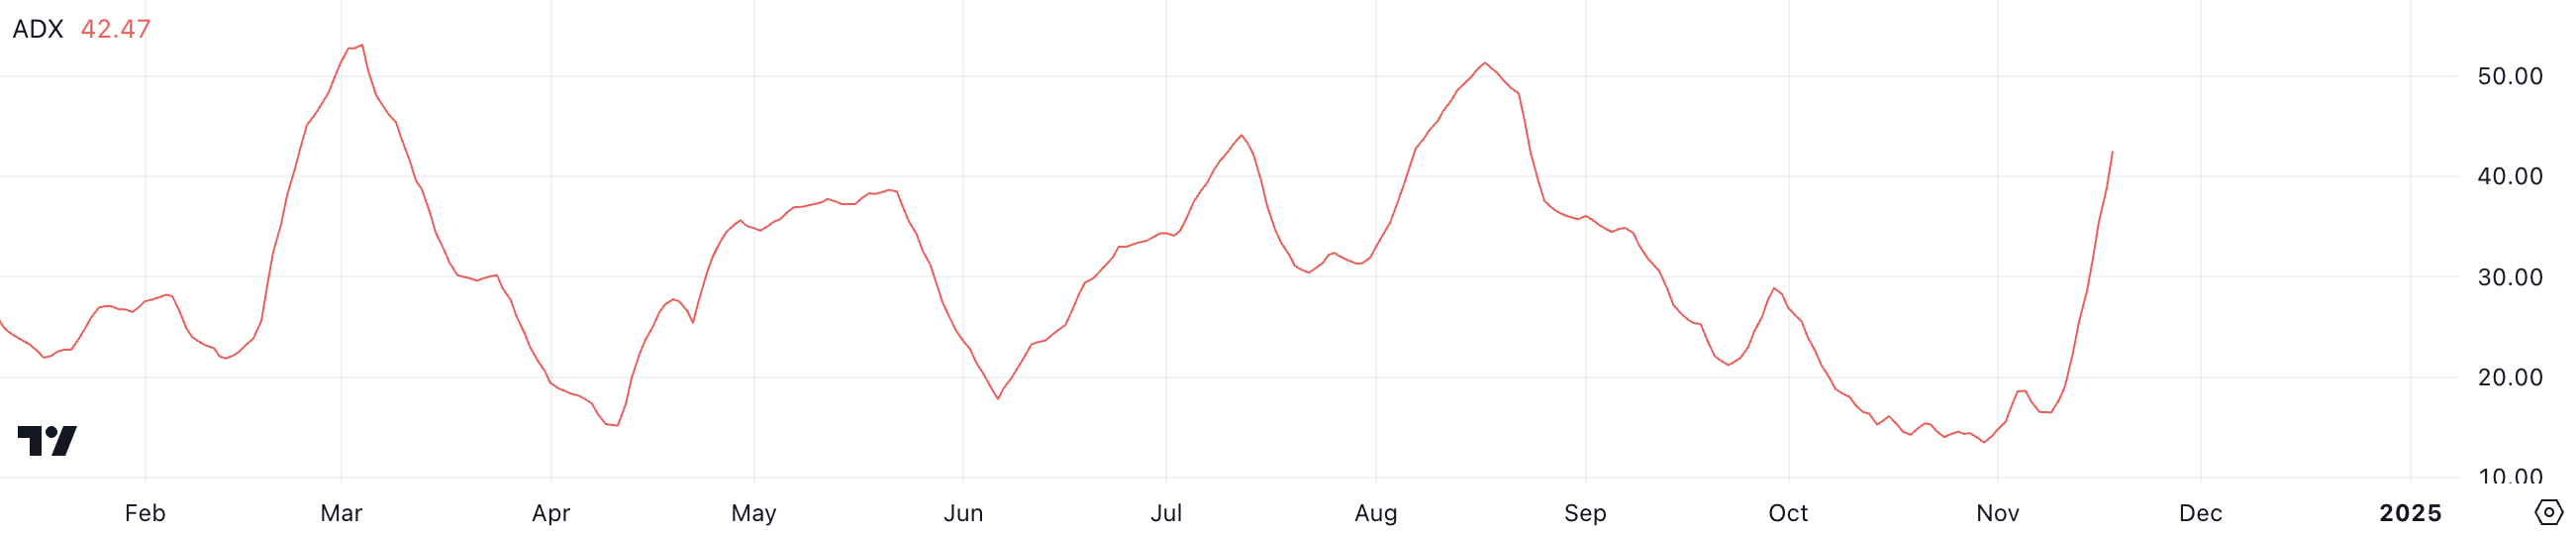
The ADX, or Average Directional Index, measures the strength of a trend on a scale from 0 to 100 without indicating the trend’s direction.
Values below 20 signify weak trends, while values above 25 suggest a strong trend. Hedera ADX at 42.47 clearly indicates a strong uptrend, implying that buying momentum is accelerating.
Ichimoku Cloud Shows a Bullish Setup for Hedera
The Ichimoku Cloud chart for $HBAR shows a sustainable uptrend, with the price breaking well above the cloud (Kumo), confirming the start of a bullish trend. The green cloud ahead suggests solid support, reinforcing the likelihood of continued upward momentum.
The current price action suggests that $HBAR is maintaining its strength above critical levels, with the cloud providing a safety net for potential pullbacks.
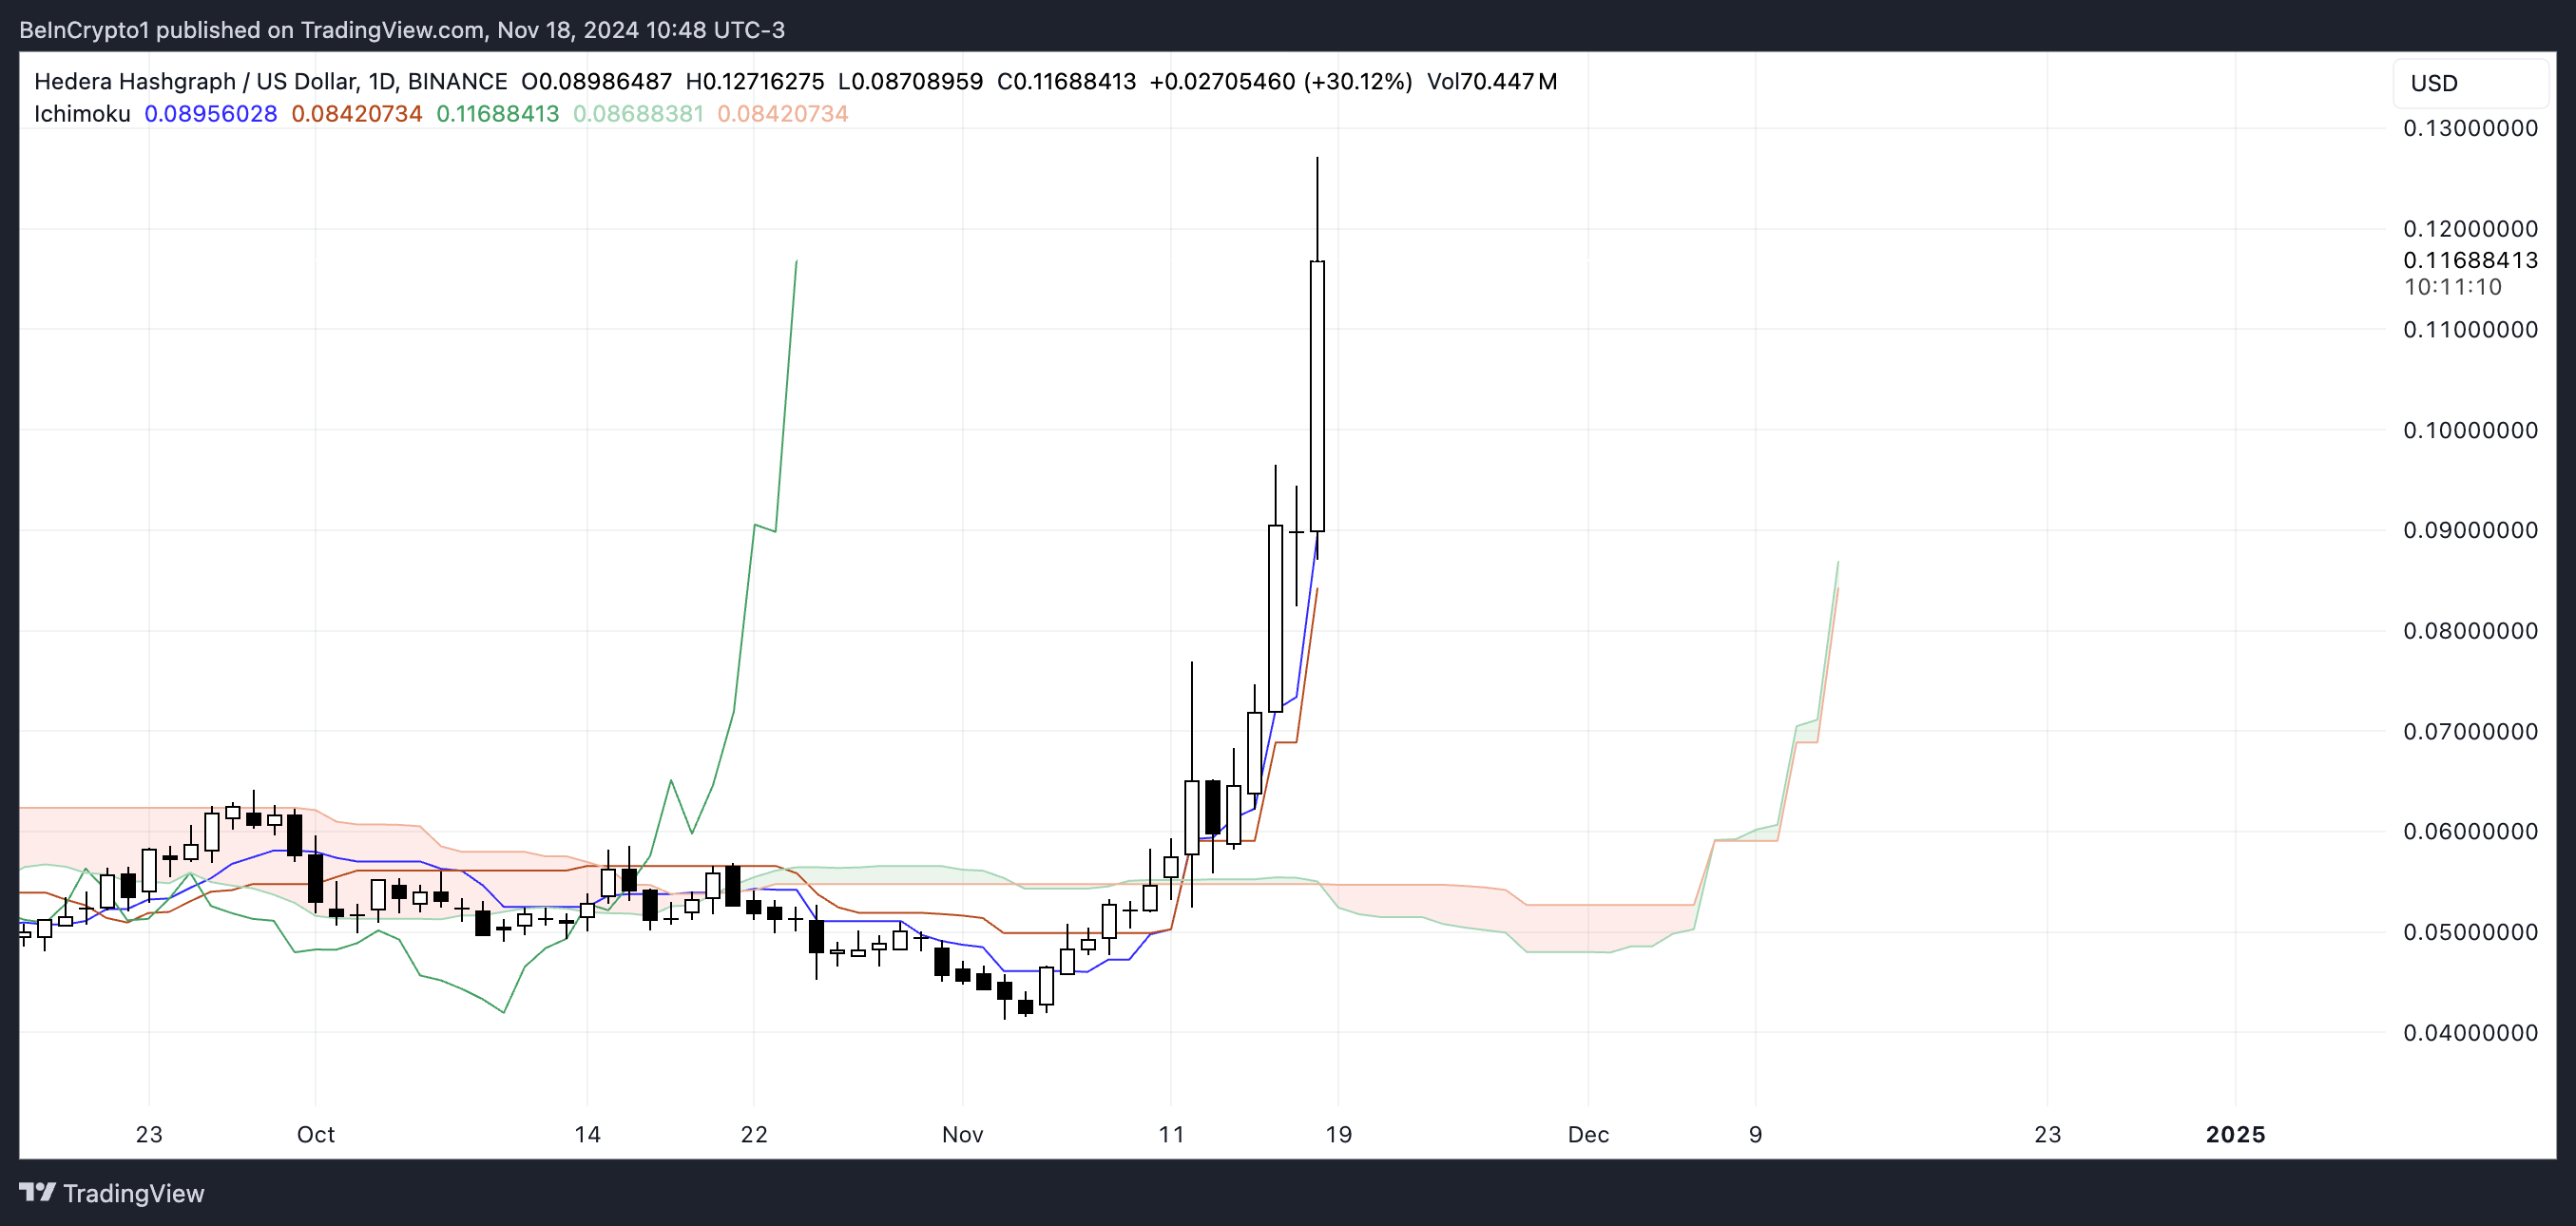
The Tenkan-sen (conversion line) is above the Kijun-sen (baseline), another positive signal reflecting strong short-term momentum. The Chikou Span (lagging line) is also positioned well above the price, further validating the strength of this trend.
Together, these elements align to suggest that $HBAR’s momentum is strong, with the potential for continued price gains if the current trend holds.
$HBAR Price Prediction: A New 53% Price Surge?
If the current uptrend continues, $HBAR price could test its nearest strong resistance at $0.14, which would be its highest price since March. A successful breakout above this level could pave the way for further gains, potentially reaching $0.182, representing a substantial 54% increase from current levels.
This bullish scenario aligns with the strong momentum indicated by recent technical signals.
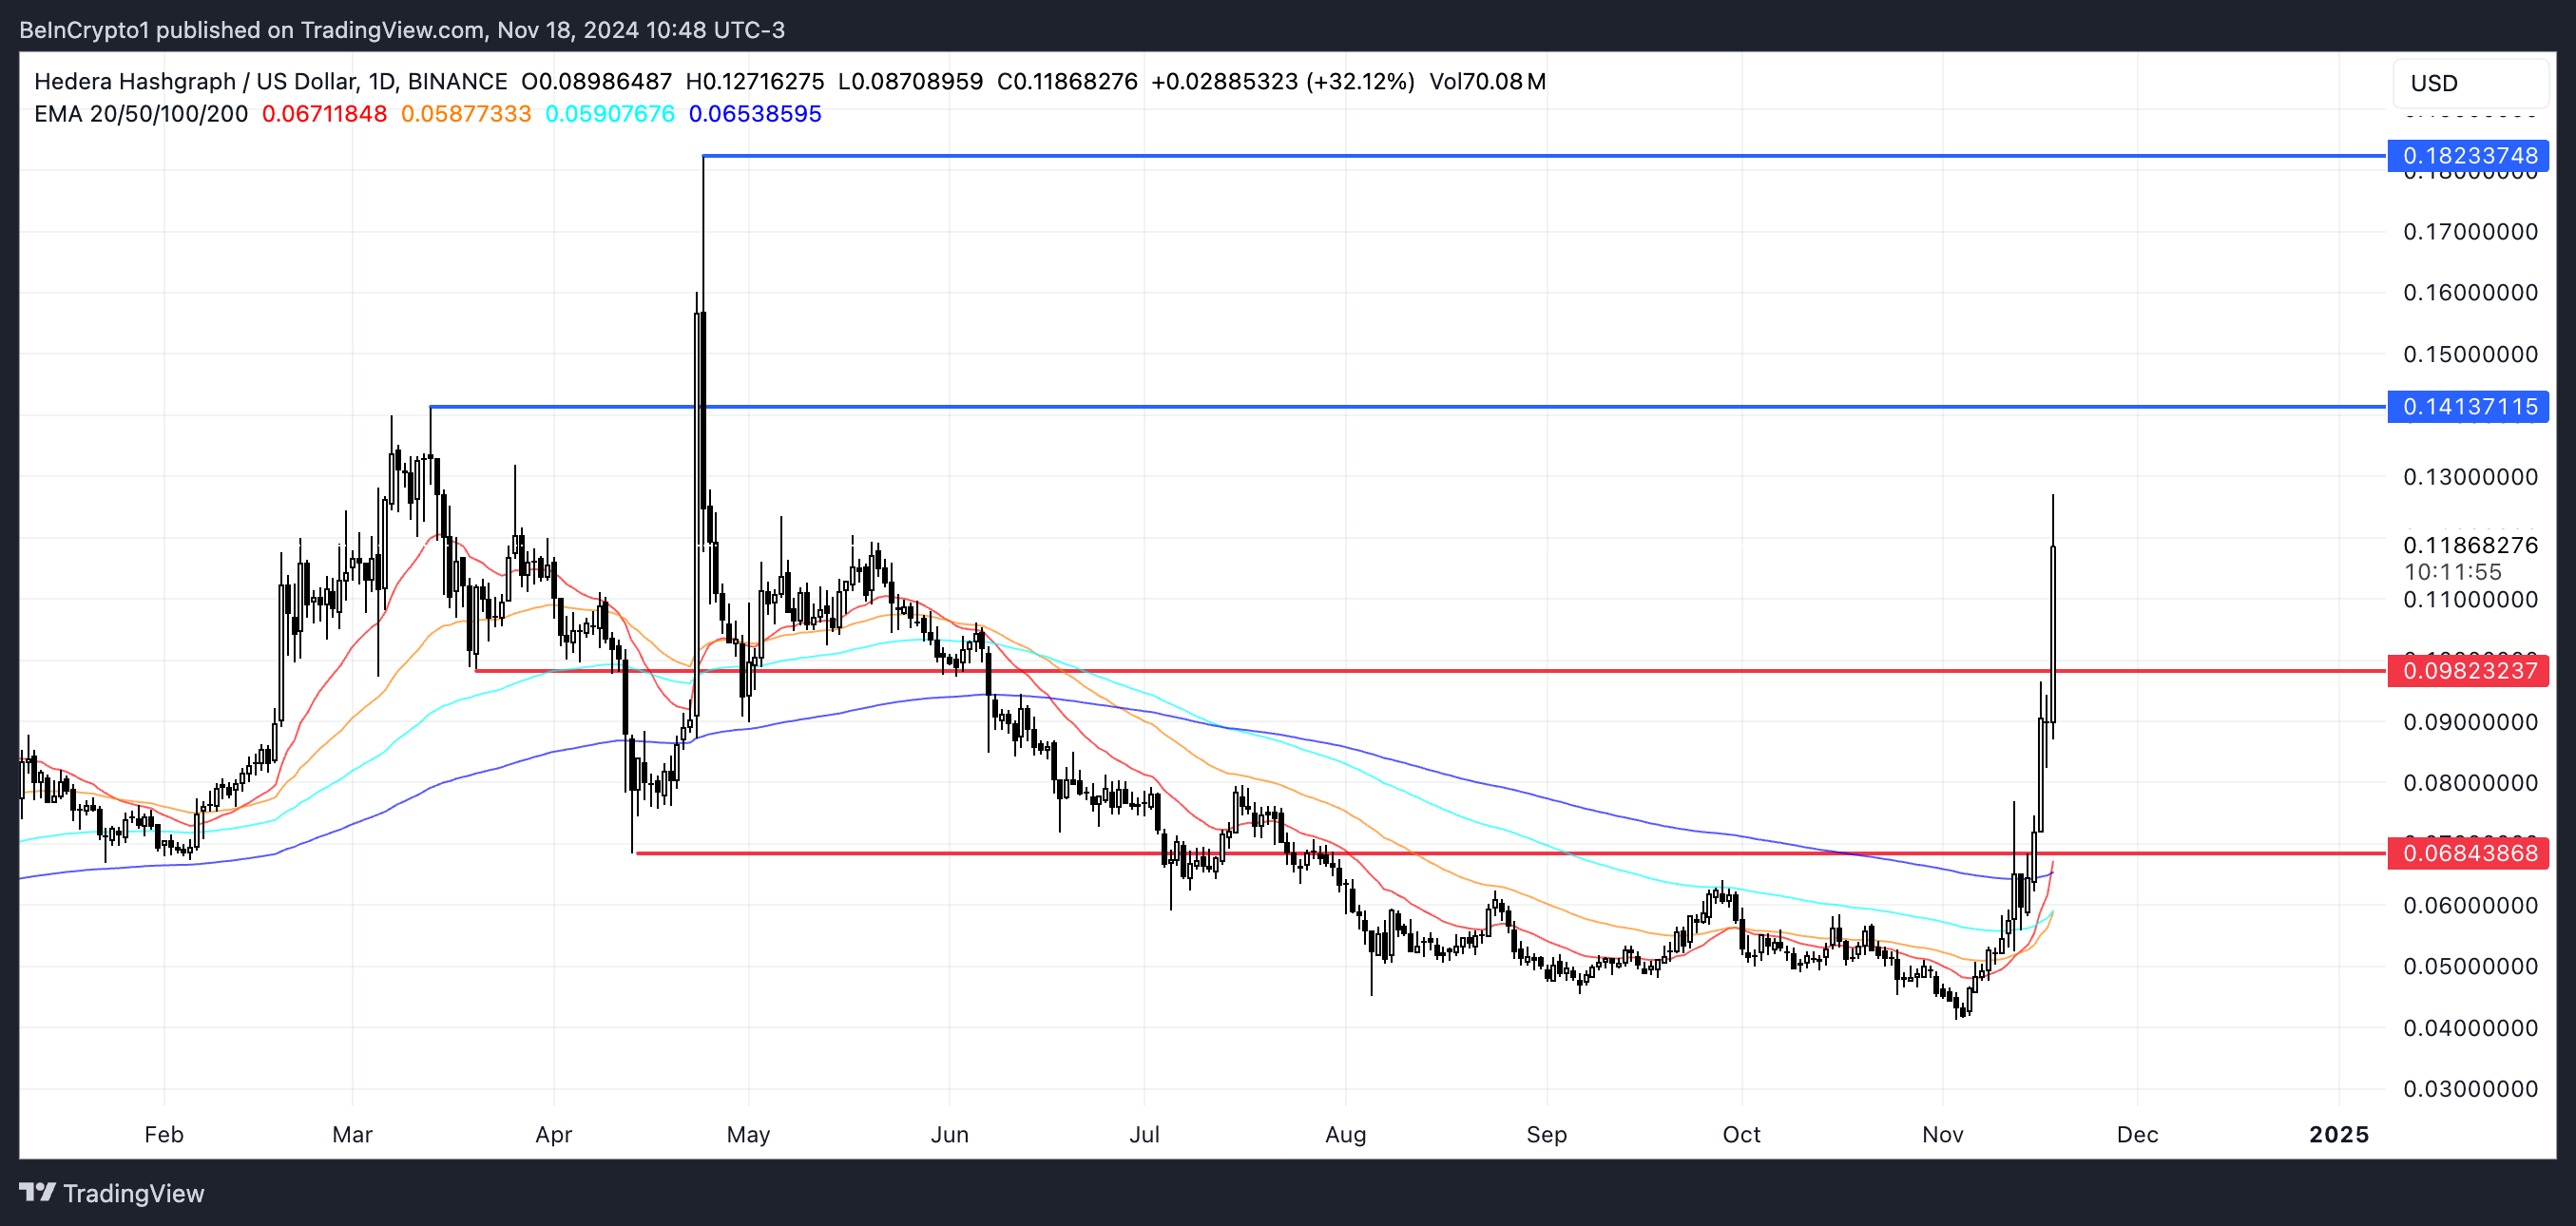
On the other hand, if the trend reverses, $HBAR could face a pullback toward its first support at $0.098. If this level fails to hold, the price could drop further to $0.068.

