

 4
4
Hedera Hashgraph ($HBAR) is trading at $0.0492, with a slight gain of 0.82%. Analysts consider $0.0450 to be important support and $0.0550-$0.0600 as a resistance level that $HBAR must break to confirm an uptrend.
According to Analyst best_analyst, if the price is to hold above $0.035 a bullish reversal pattern with a target price of $0.098 may occur.
Technical Indicators Highlight Weak Bullish Signals
The Relative Strength Index (RSI) for $HBAR is 42.75 which still shows weak momentum just below the neutral 50 mark.
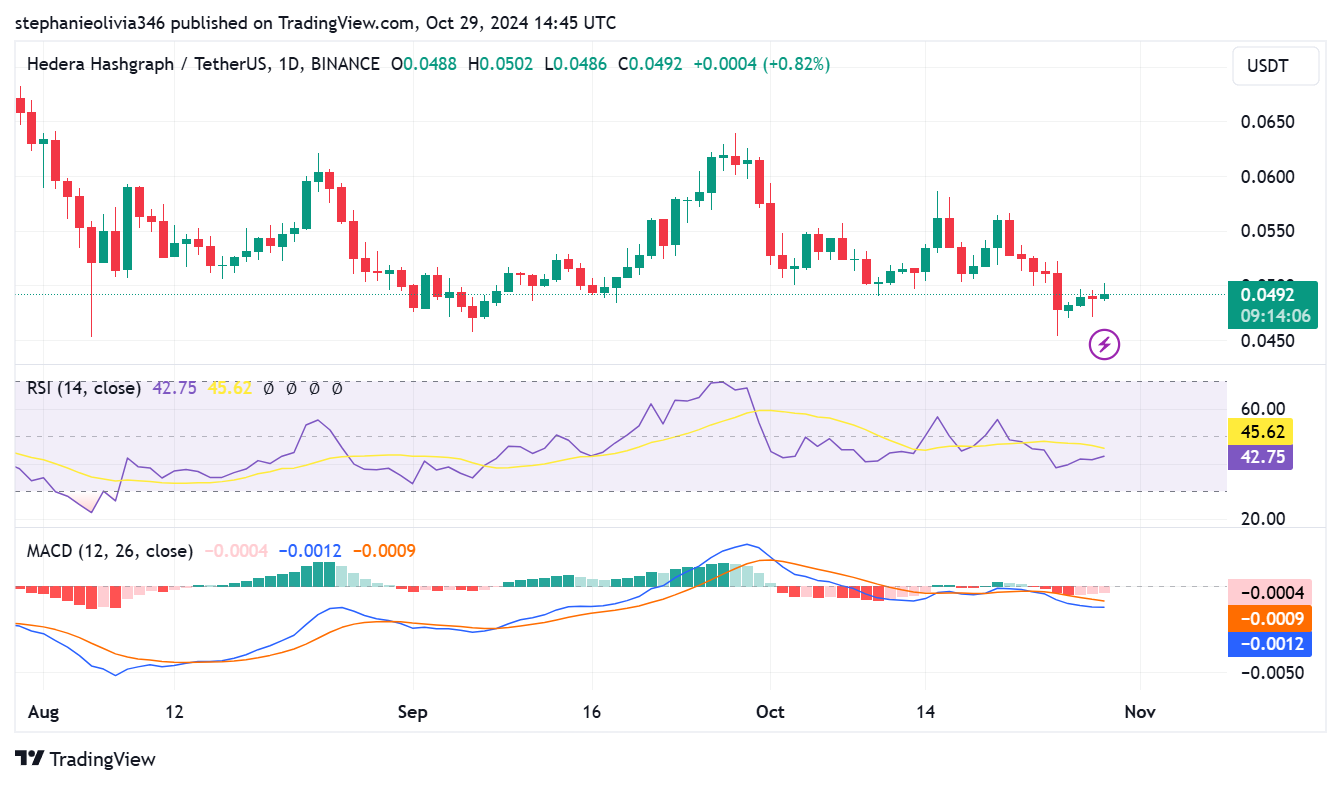
This level suggests that sellers remain in control but a rise above 50 indicates a possible bullish breakout.
The MACD indicator has the MACD line below the signal line, with the MACD line at -0.0009 and the signal line at -0.004. Furthermore, if the MACD line overlaps and crosses the signal line, it may affirm the beginning of a trend reversal to the advantage of the bulls.
The oscillation between $0.0450 and $0.0550 shows that there is a lack of substantial movement beyond the range, a break above resistance is necessary to affirm a bullish trend.
This consolidation phase reflects a mixed outlook as both RSI and MACD show no clear buying or selling pressure. Analysts stressed that it is crucial for $HBAR to sustain a price above $0.0450 to avoid further losses.
Analyst’s View on Long-Term Price Potential and Risks
As per best_analysts, $HBAR’s future depends on sustaining at $0.035, further weakness may lead to a deeper downfall.
“$HBAR is expected to stay above $0.035,” the best _analyst noted, hinting that if the price drops below the $0.035 mark, it may take long for the bear market to reverse.
On the other hand, $HBAR needs to have a bullish reversal above this level of support, which would indicate a strong bounce to $0.098.
However, best_analyst points out that the achievement of this target has to be backed by clear confirmation signals from price action and other technical indicators.
The social media community echoes a similar sentiment, with discussions highlighting $HBAR’s circulating supply of over 37 billion and its unique hash graph technology.
The majority view $HBAR as more than just a cryptocurrency, with one X user commenting, “$HBAR is redefining blockchain with speed, security, and scalability.” However, issues of increased supply and market trends remain as potential barriers.
Elliott Wave Analysis and Bullish Scenarios
Best__analysts also use Elliott Wave Theory to determine potential $HBAR price formation.
The current wave structure given as corrective waves (w) (y) indicates that $HBAR might be in the final stage of a corrective cycle. Wave (C) could make a bearish pattern at the lowest with a target of about 0.035.
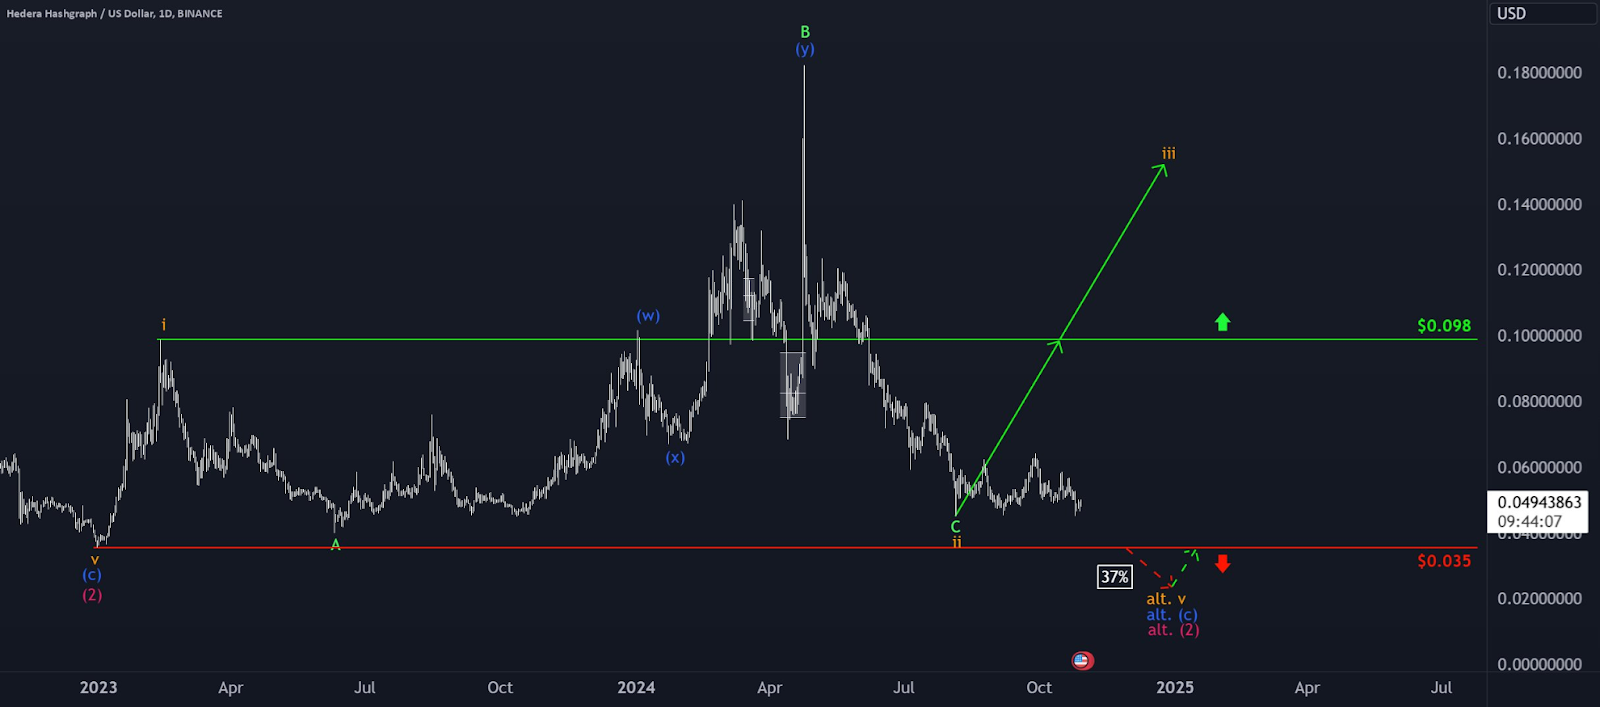
If this corrective phase comes to a successful end then $HBAR could jump into an impulsive Wave (iii) upwards that may reach $0.098.
The impulsive wave (iii) would be expected to follow next and correspond to the breakout above the resistance region from $0.0550 to $0.0600, which signifies an upward trend on the chart.
This indicated possible bullish wave depends on the continued movement of $HBAR with intermediate price levels helping in determining a change of trend. The Elliott Wave analysis clearly implies that although the upside is large, the support and resistance are key junctures for direction determination.

