

 2
2
Celestia’s ($TIA) price remains uncertain as both trend indicators and key levels fail to provide a clear direction. The ADX and Ichimoku Cloud show weak momentum, indicating a lack of decisive strength from either bulls or bears.
While the EMA lines and support/resistance levels hint at consolidation, a breakout in either direction is needed to determine the next significant move.
$TIA Next Direction Is Still Not Defined
The ADX (Average Directional Index) on the $TIA DMI chart (Yellow Line) stands at 16.5, indicating a weak trend. ADX is a momentum indicator used to assess the strength of a trend, regardless of its direction.
Typically, an ADX value below 20 suggests that the trend is not strong, while values above 25 indicate a more defined trend. With the current value at 16.5, $TIA lacks clear momentum, implying that any trend—bullish or bearish—does not have significant strength.

The +DI (Blue Line) is at 15.6, while the -DI (Red Line) is at 17.3. The +DI represents bullish pressure, and the -DI represents bearish pressure. Since the -DI is higher than the +DI, it indicates that bearish pressure is slightly dominant at the moment.
Given the weak ADX reading, this suggests that while the bears are in control, their grip on $TIA’s price movement is not firm. As a result, $TIA’s price is likely to remain range-bound or show minimal movement until stronger momentum develops.
Read more: 10 Best Altcoin Exchanges In 2024
Ichimoku Cloud Also Shows Mixed Signals for Celestia
The Ichimoku Cloud chart for $TIA reveals a mixed picture. Currently, the price is sitting close to the cloud, which is an area of uncertainty. When prices are within or near the cloud, it indicates a period of consolidation or indecisiveness in the market.
If the price manages to break above the cloud, it could signal a bullish trend, whereas a break below could indicate a bearish move. The thickness of the cloud ahead also plays a role; a thicker cloud implies stronger resistance or support.
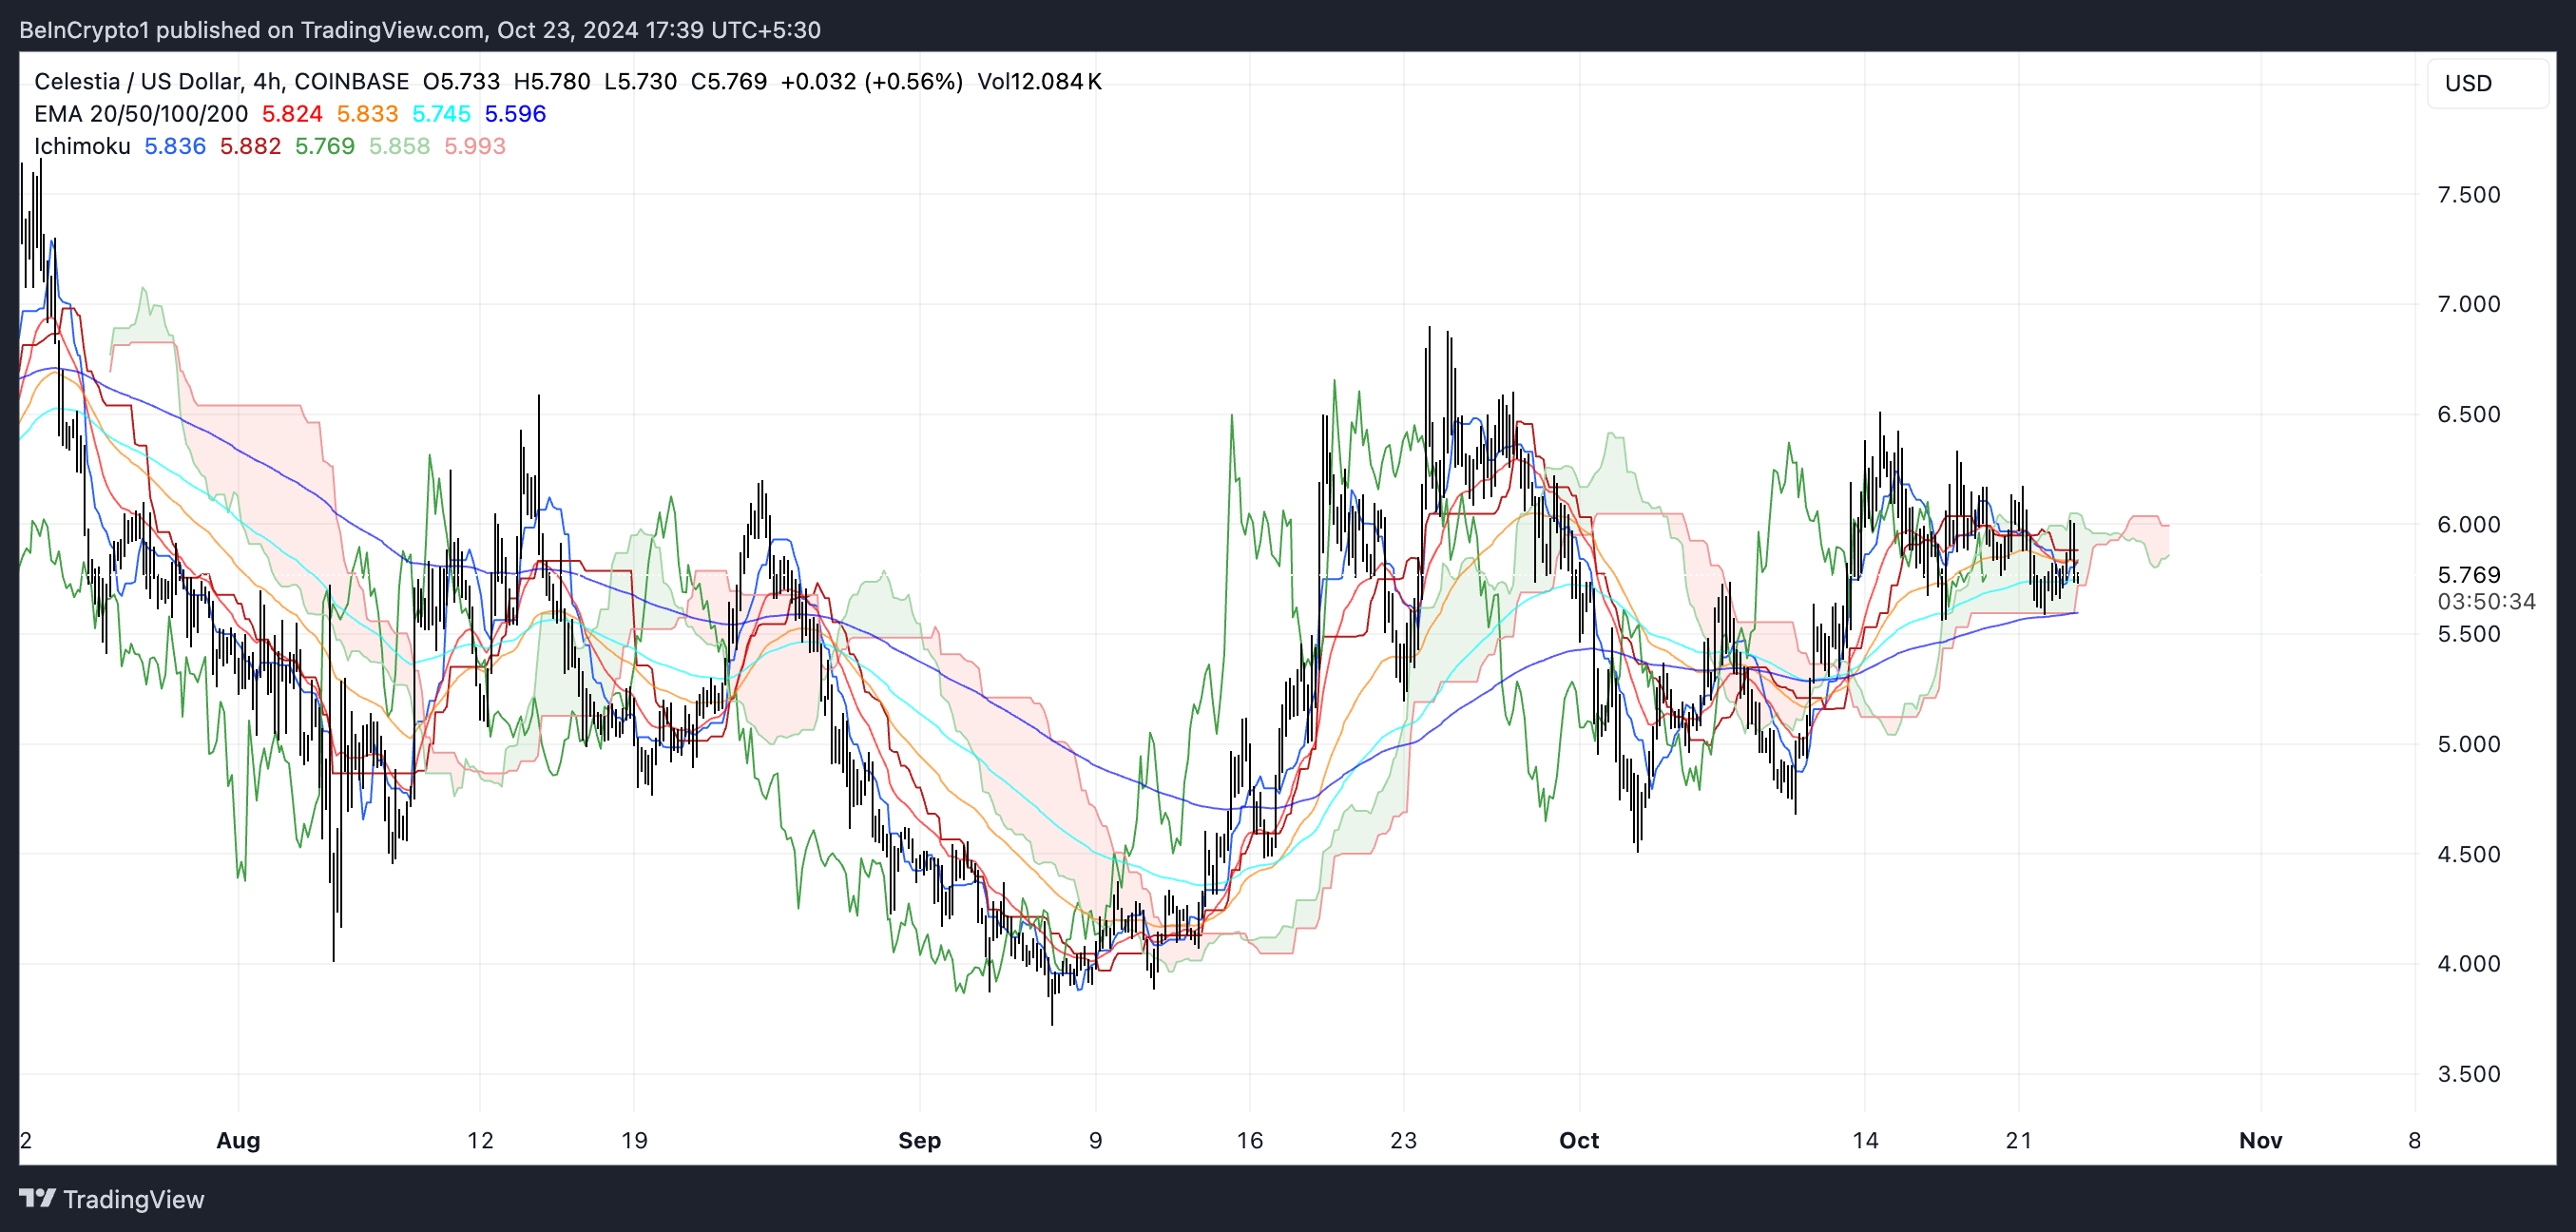
The Tenkan-sen (conversion line) and Kijun-sen (base line) are relatively close, suggesting that momentum is not clearly favoring either side. The future cloud is also mixed, which indicates a lack of a strong directional trend.
Given this, the next move for $TIA’s price might depend on its ability to either clear the resistance of the cloud or break support to the downside. Until then, traders should watch for a definitive breakout in either direction to assess the next significant move.
$TIA Price Prediction: Is It Possible to Get Back to $6 in October?
The EMA (Exponential Moving Average) lines on the $TIA chart indicate mixed momentum for the price. The EMAs are closely aligned, with the shorter EMAs hovering slightly above the longer-term EMAs.
This positioning suggests that $TIA is experiencing a phase of limited momentum, where there is neither strong bullish nor bearish dominance. The price staying close to all EMAs indicates consolidation, and it will need a clear move above or below these EMAs for a potential trend to emerge.
Read More: 3 Altcoins to Watch in the Fourth Week of October 2024
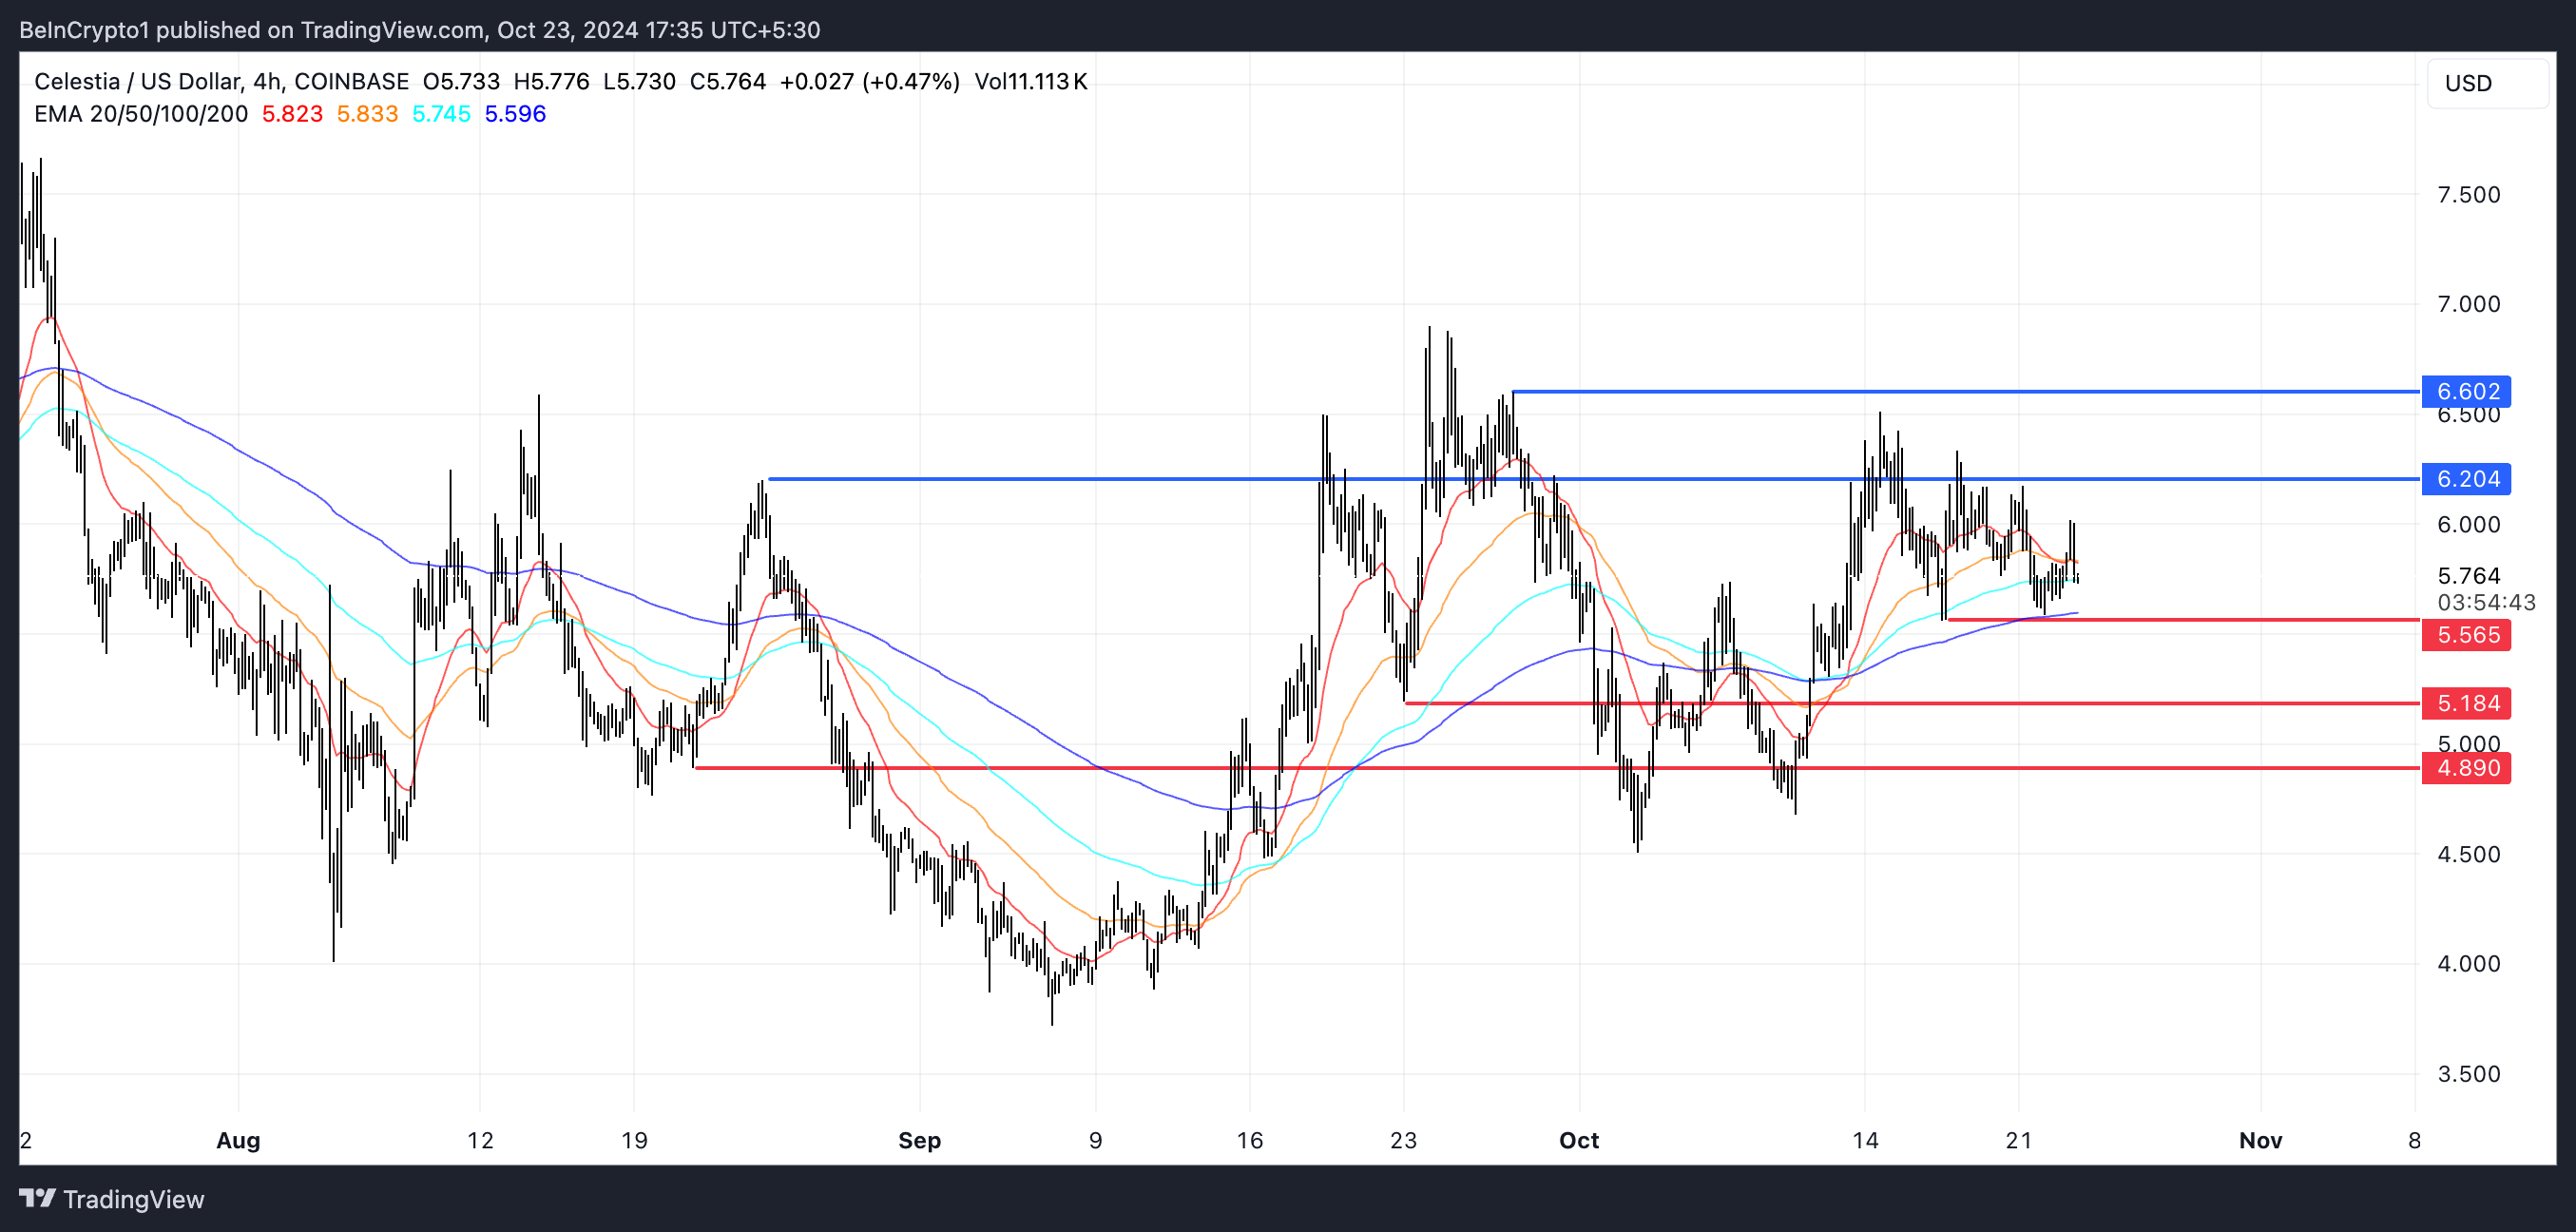
Regarding support and resistance zones, $TIA has strong resistance levels marked at $6.20 and $6.60. If $TIA’s price breaks above $6.20, it could attempt to challenge $6.60.
On the flip side, a break below $5.56 could expose the price to deeper pullbacks towards $5.18 or even $4.89, marking a potential 15% price correction. The current positioning of the price suggests a period of indecisiveness, where breaking key support or resistance will dictate the next movement direction.

