
 2
2
The Bitcoin price has remained bearish for the past few months and altcoins have displayed sharp selling. Despite this, the Helium ($HNT) price has performed positively and has risen by 120% since July. The $HNT price has been increasing by generating higher highs and higher lows.
However, the crypto asset price has dropped to the higher low zone and has formed a bullish candlestick. It has managed to defend the last swing low and exceeding the 20-day EMA may boost the momentum.
Could the $HNT Crypto Remain Green Ahead?
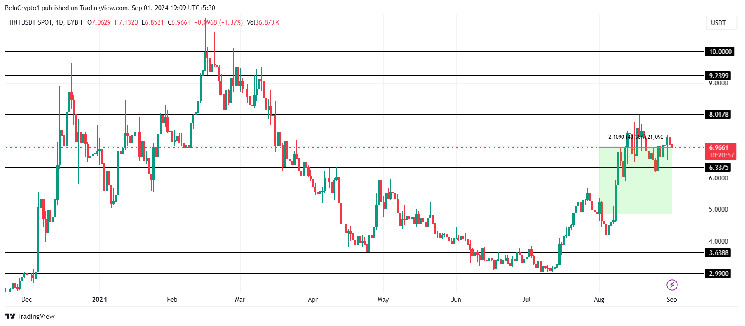
6.1.$APE (@LEAVERAGE_LABS) is a crypto expert who says that the $HNT crypto has the potential to gain 61.8% in the next few weeks.
$HNT ideally we want a pullback here to about 5.50 to run it up to the 61.8% on chart. https://t.co/FGG0cVUyCY pic.twitter.com/YMFqU1WECS
— 6•1•$APE (@LEVERAGED_LABS) September 15, 2024
Big players may show interest if the price melts slightly and liquidates the last swing low. Strong buying momentum can be anticipated if the $HNT price triggers pullback from this zone and may record a new $ATH.
Is $HNT Crypto Wandering in the Buying Zone?
PS trade (@PStrade2) is a cryptocurrency analyst, who has shared his opinion on X (formerly twitter). He claims that the Helium coin price has reached the purchase zone 2 and has generated bullish momentum.
$HNT
— PS trade (@PStrade2) September 15, 2024
The price of #Helium has reached the purchase zone 2, which we wrote about in our previous post on September 12. The #$HNT price has dynamically bounced from the 7.2$ liquid zone. We are waiting for the trade to be realized. https://t.co/RuQRRTV7QC pic.twitter.com/dYfhFKfzE2
The $HNT price has dynamically bounced from the liquid zone of $7.20. Bullish momentum from this zone could witness strong buying pressure in the long term. It may record a new all-time high ($ATH) in one go.
Could the $HNT Price Record a New $ATH Soon?
When writing, the Helium crypto was trading at $7.37 which has dropped by 1.38% over the past 24 hours. The 24-hour trading volume was $14.90 Million and the market capitalization was $1.18 Billion.
Based on the technical chart, the $HNT crypto price has been in a bullish trend for the past few months. At press time, the price was wandering in the pullback territory. Moreover, the price has dropped to the 20-day EMA which could create fear among the buyers.
Assuming the price surpasses the 20-day EMA and sustains then buyers may show interest in pullback. During this momentum, the price may surpass the last swing high and extend to the $10 mark. Helium price prediction suggests a bullish momentum after the pullback.
Suppose the digital asset price slips below the ascending trendline, it could be a bearish signal. If the price loses the 200-day EMA, profit booking can be seen which may lead to a bearish trend.
Turning to the technical indicators, the MACD has generated a bearish crossover with the Signal line and the histograms have flipped to red. The RSI has developed a death crossover with the RSI-based moving average which showcases the bearish forecast.
$HNT Crypto Price Analysis and Forecast
The $HNT price has been in a bullish trend and has risen by 120% since July. This coin has remained bullish despite the bearish cryptocurrency market. However, the price has reached the higher low zone and formed a bullish candlestick pattern.
At press time, the price was declined by a 20-day EMA which could be a bearish sign but exceeding this EMA might invite buyers. MACD and RSI are in favor of a bearish forecast and the price is expected to decline further.