

 5
5
Aptos ($APT) has seen a significant rise in demand over the past week, indicating a potential shift in market trends. This increase is reflected in the cryptocurrency’s attempt to trade above its 20-day exponential moving average (EMA) and 50-day simple moving average (SMA).
The bullish momentum suggests that $APT may soon break through these key levels.
Aptos Bulls Fight For Dominance
At press time, Aptos ($APT) is trading at $6, marking a 25% increase over the past seven days. The one-day chart shows $APT’s price movements aligning with a potential breakthrough of its 20-day EMA, while it also appears set to test its 50-day SMA.
An asset’s 20-day EMA measures its average price over the past 20 trading days. Its 50-day SMA, on the other hand, calculates its average closing price over the past 50 days.
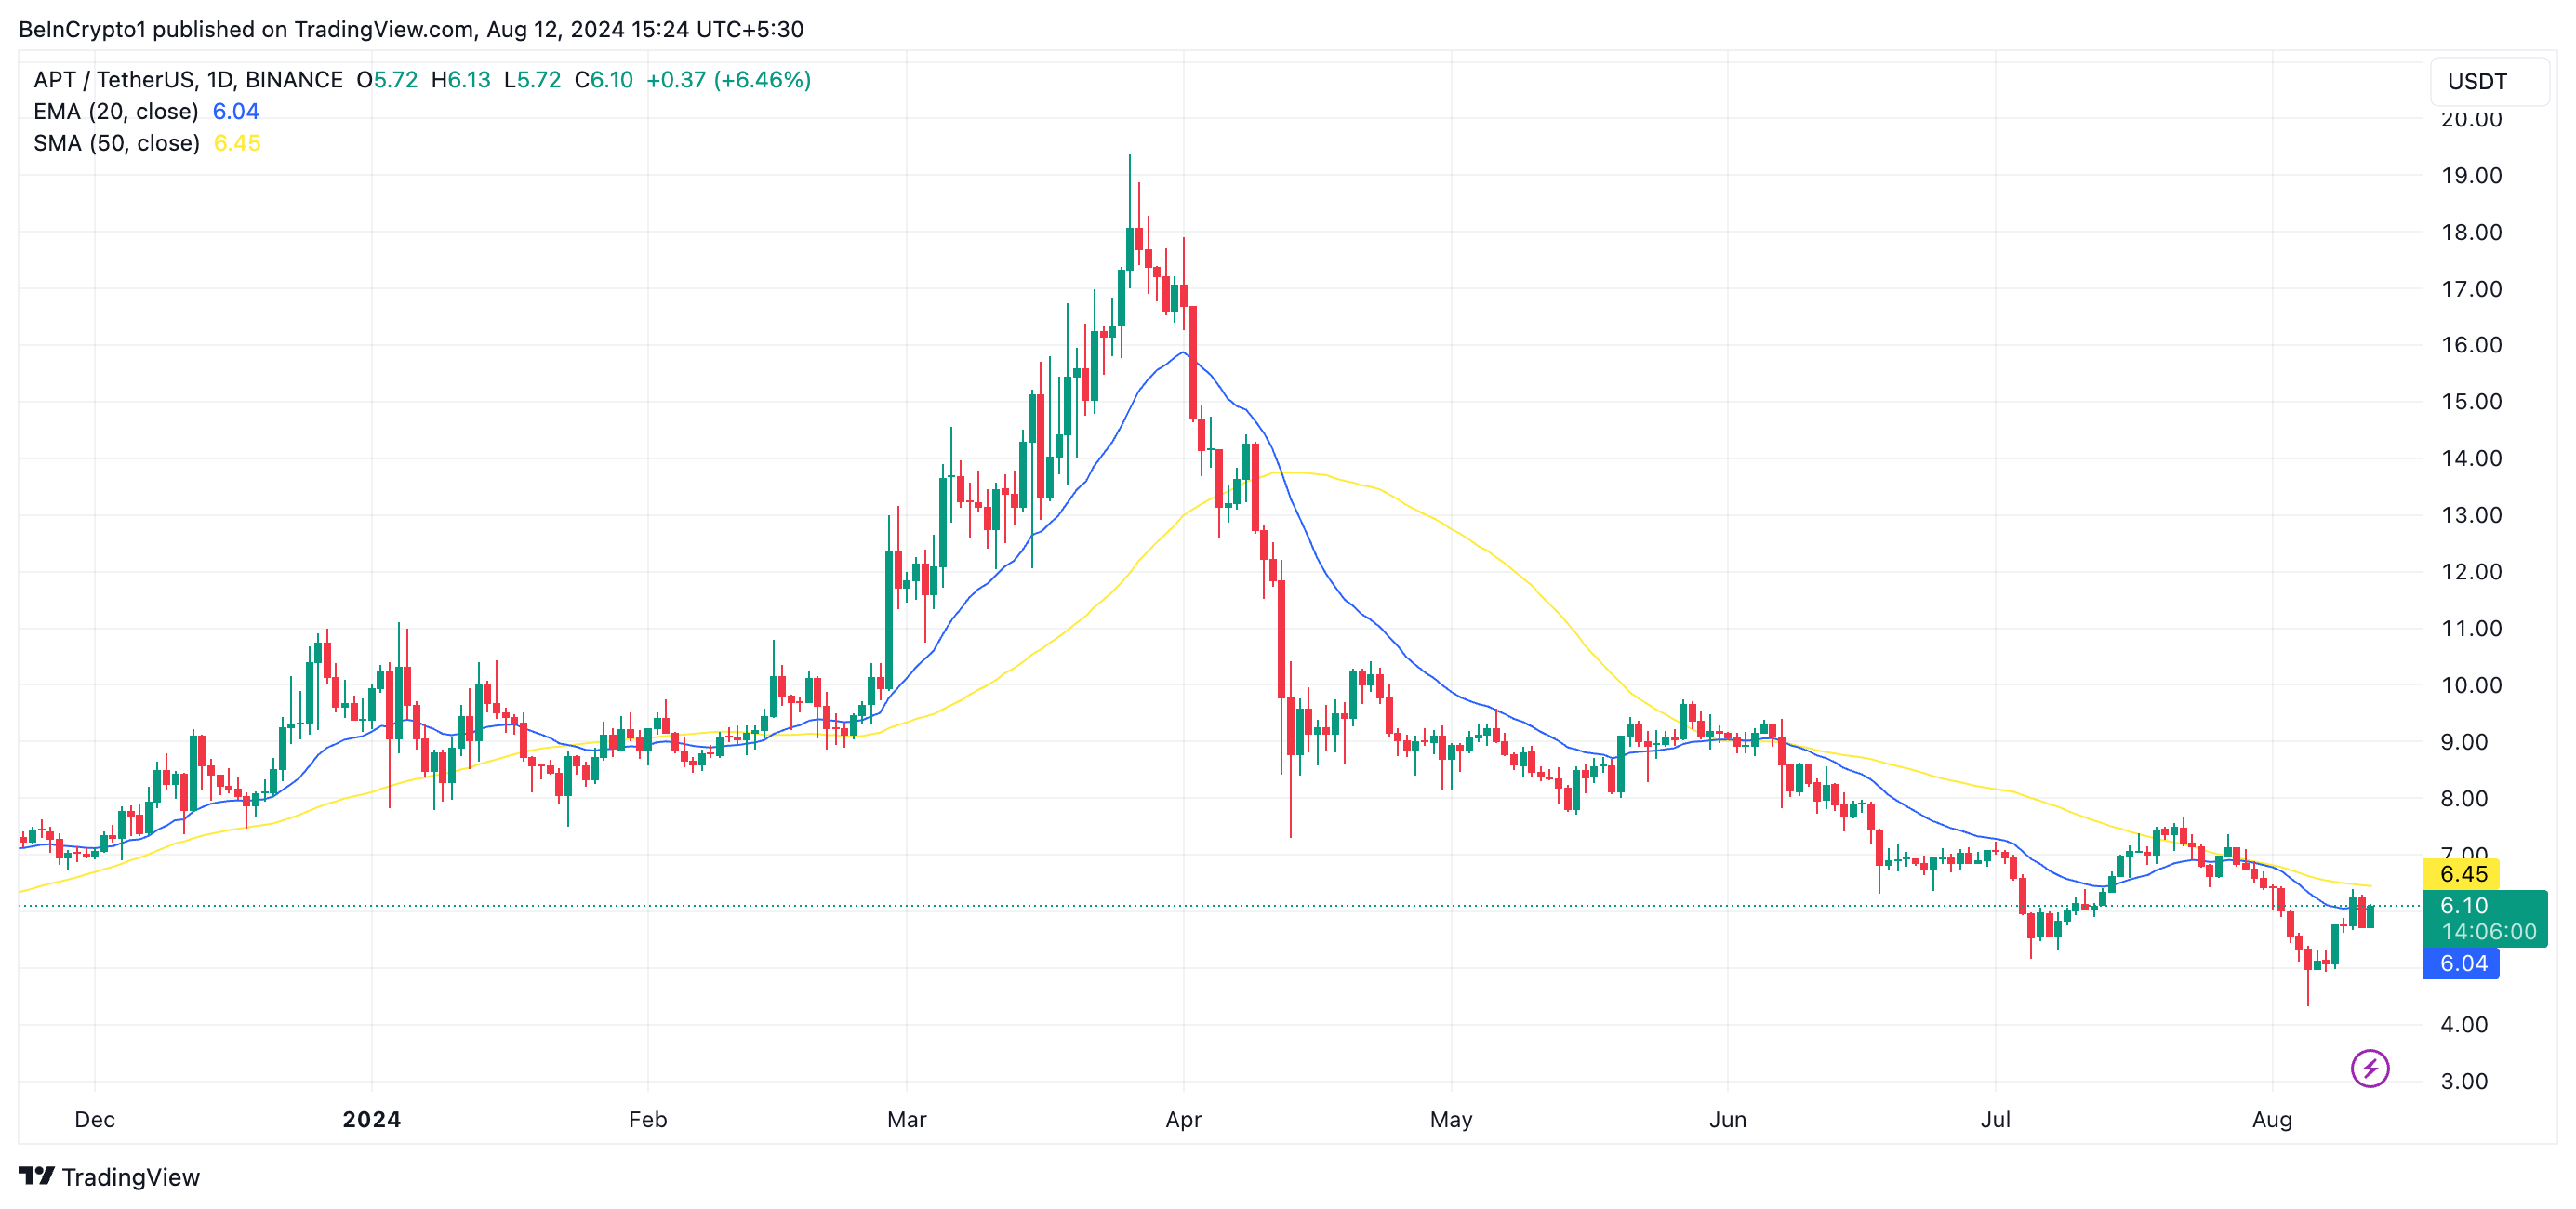
When an asset’s price rises above its 20-day EMA, it indicates the beginning of short-term bullish momentum. If the price approaches and surpasses the 50-day SMA, the uptrend may extend beyond the short term.
As of this writing, Aptos’ ($APT) 20-day EMA is set at $6.04, with its 50-day SMA positioned at $6.45. To surpass its 20-day EMA, $APT requires a 1% increase, while an 8% surge is necessary to break above the 50-day SMA.
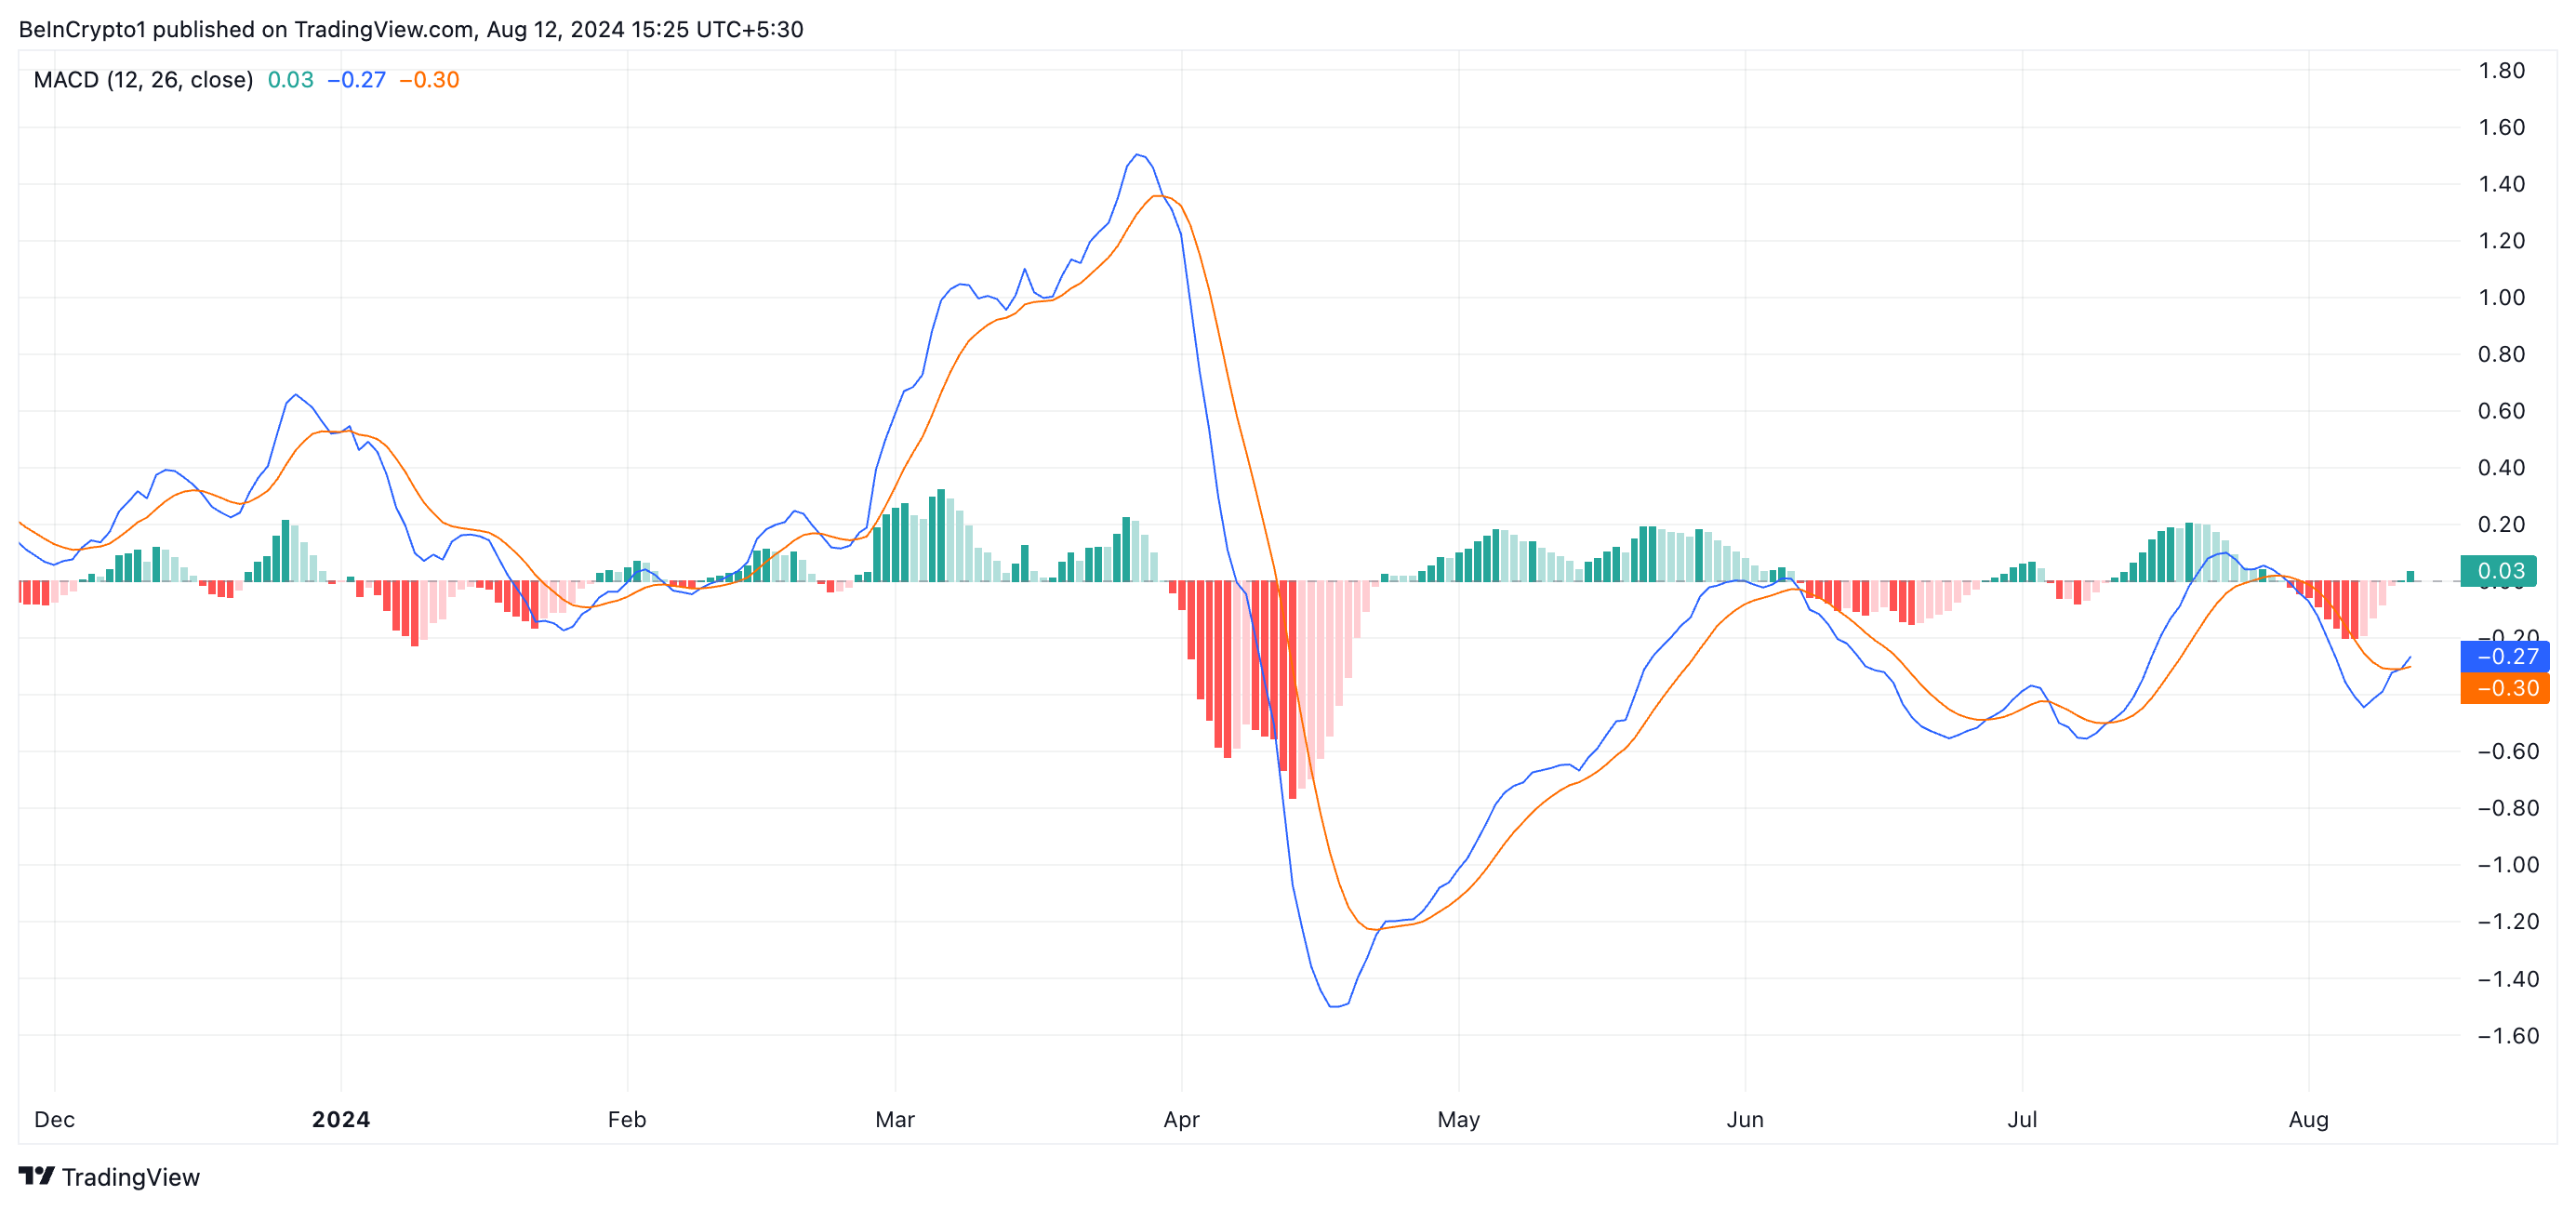
Readings from Aptos’ ($APT) Moving Average Convergence/Divergence (MACD) indicate a strong likelihood of an upcoming rally. The MACD line (blue) recently crossed above the signal line (orange), suggesting that $APT’s short-term momentum is outpacing its longer-term trend. This bullish crossover signals that $APT may continue its upward trajectory as bullish sentiment strengthens, potentially allowing the coin to gain market control.
Further, the placement of the dots that make up $APT’s Parabolic Stop and Reverse (SAR) indicator confirms the bullish bias toward the altcoin. At press time, these dots lie below $APT’s price.
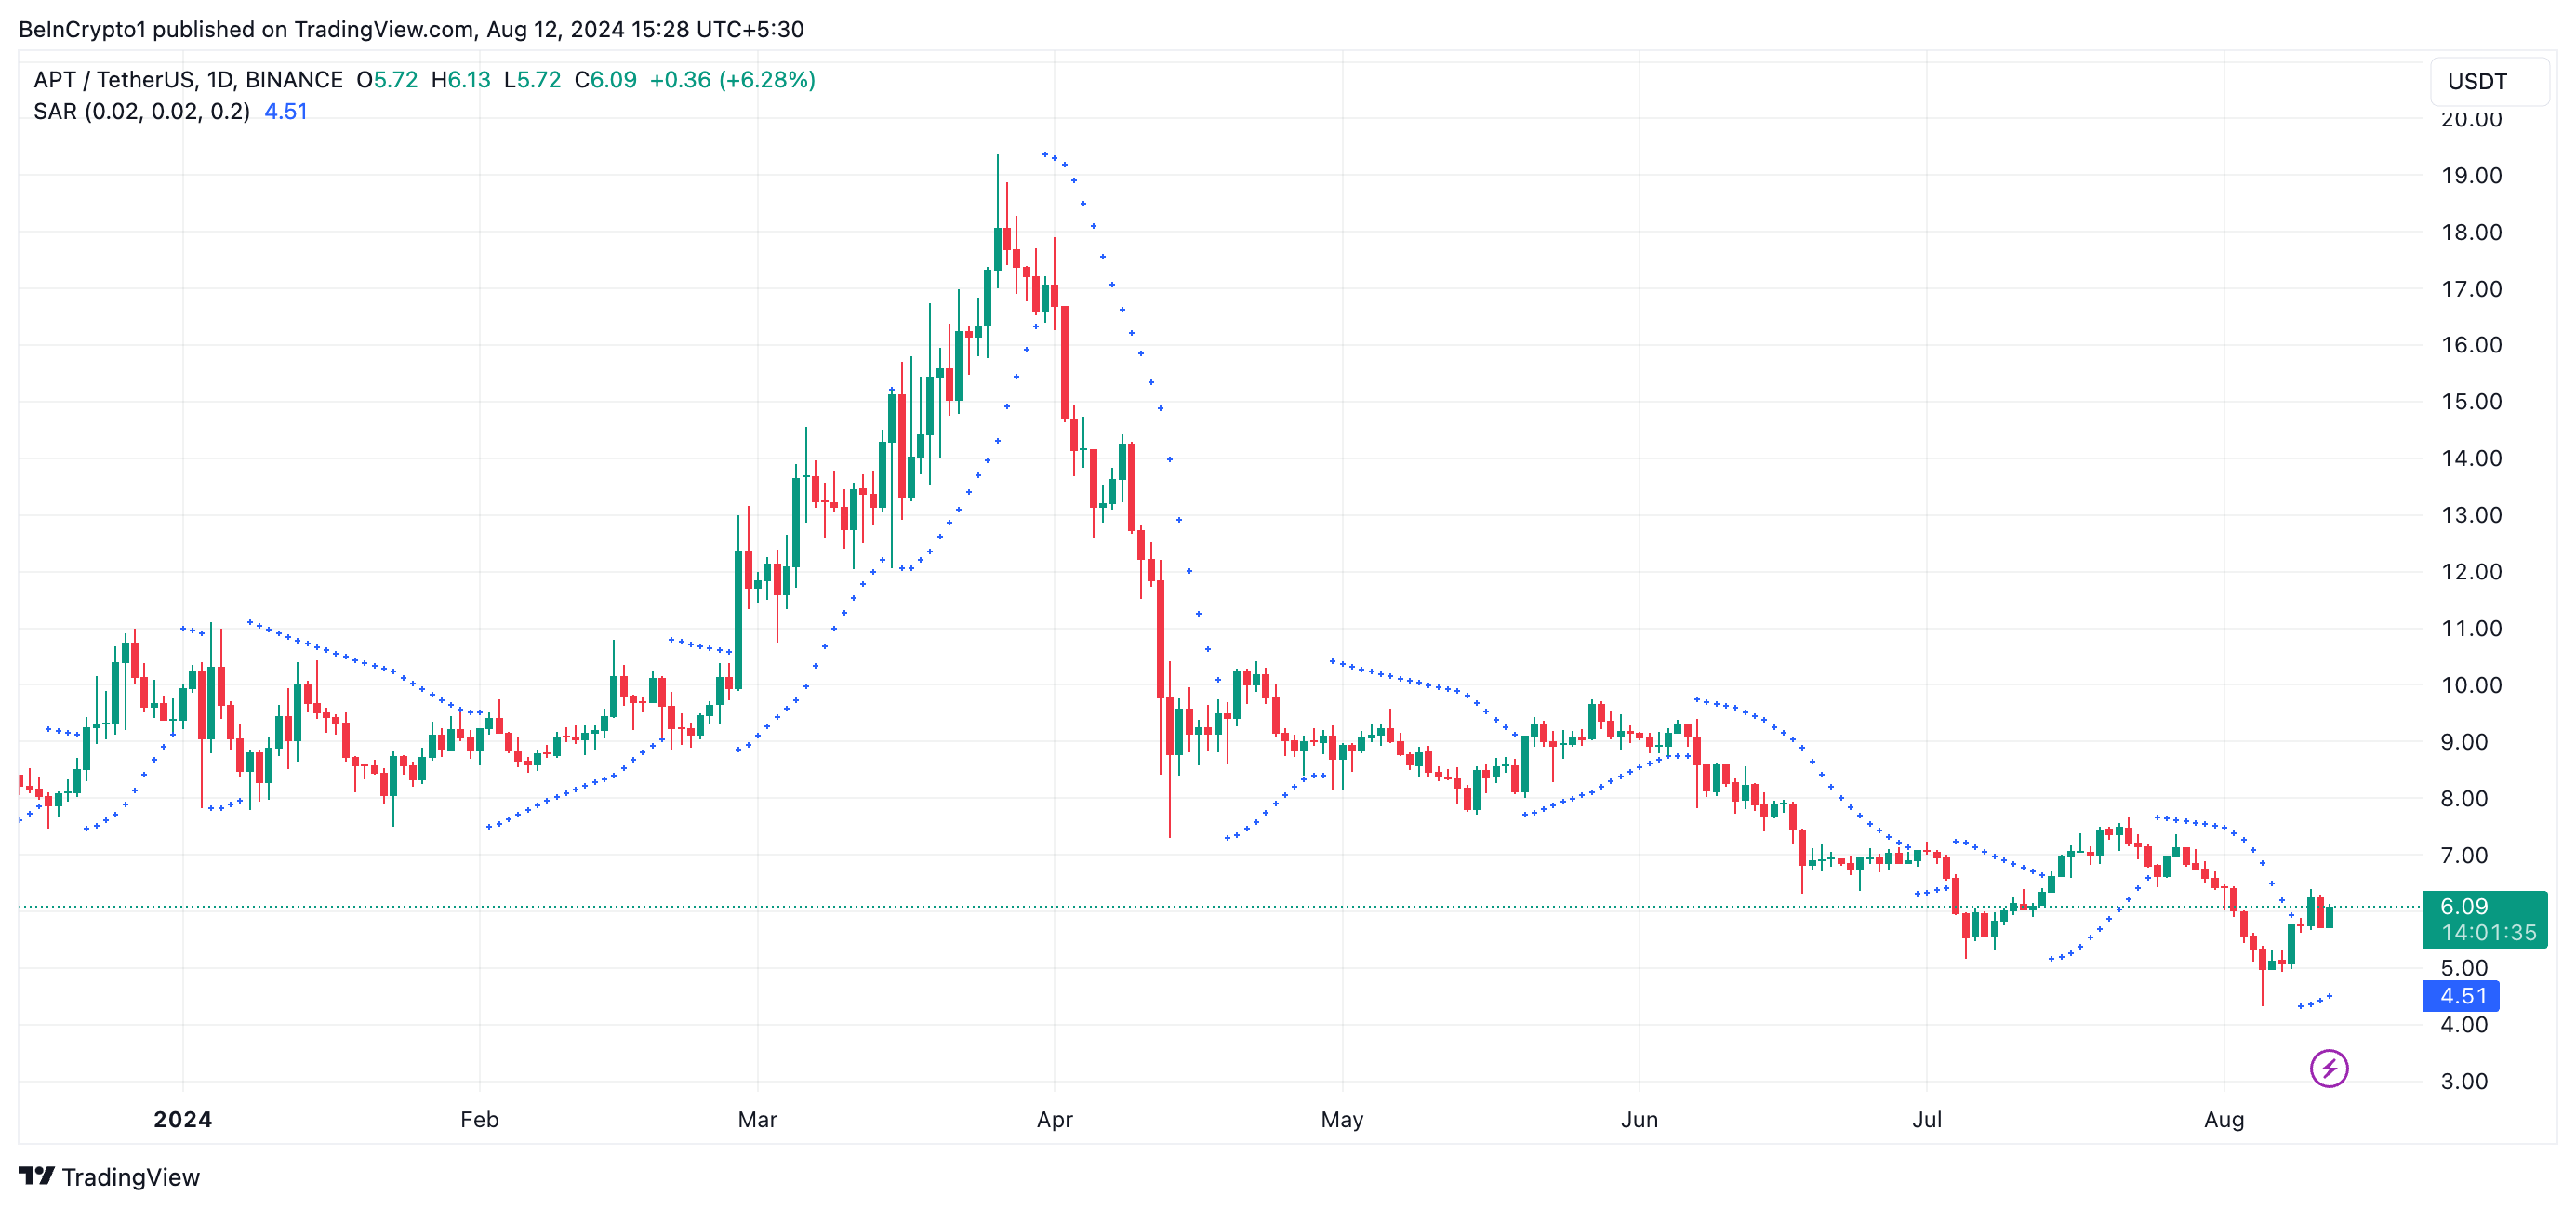
The Parabolic SAR tracks an asset’s price trends and identifies potential reversal points. When its dots are positioned below the price, the market is in an uptrend. It is a bullish signal that indicates a spike in buying activity.
$APT Price Prediction: Negative Divergence Emerges
Despite the bullish shift in market sentiment, $APT’s Chaikin Money Flow (CMF) suggests that the altcoin is at risk of shedding its recent gains. While $APT’s price climbed last week, its CMF remained below the zero line, creating a bearish divergence.
This divergence emerges when an asset’s price rallies while its CMF returns negative values. This indicates that the buying pressure behind the rally is weakening, and a correction is imminent.
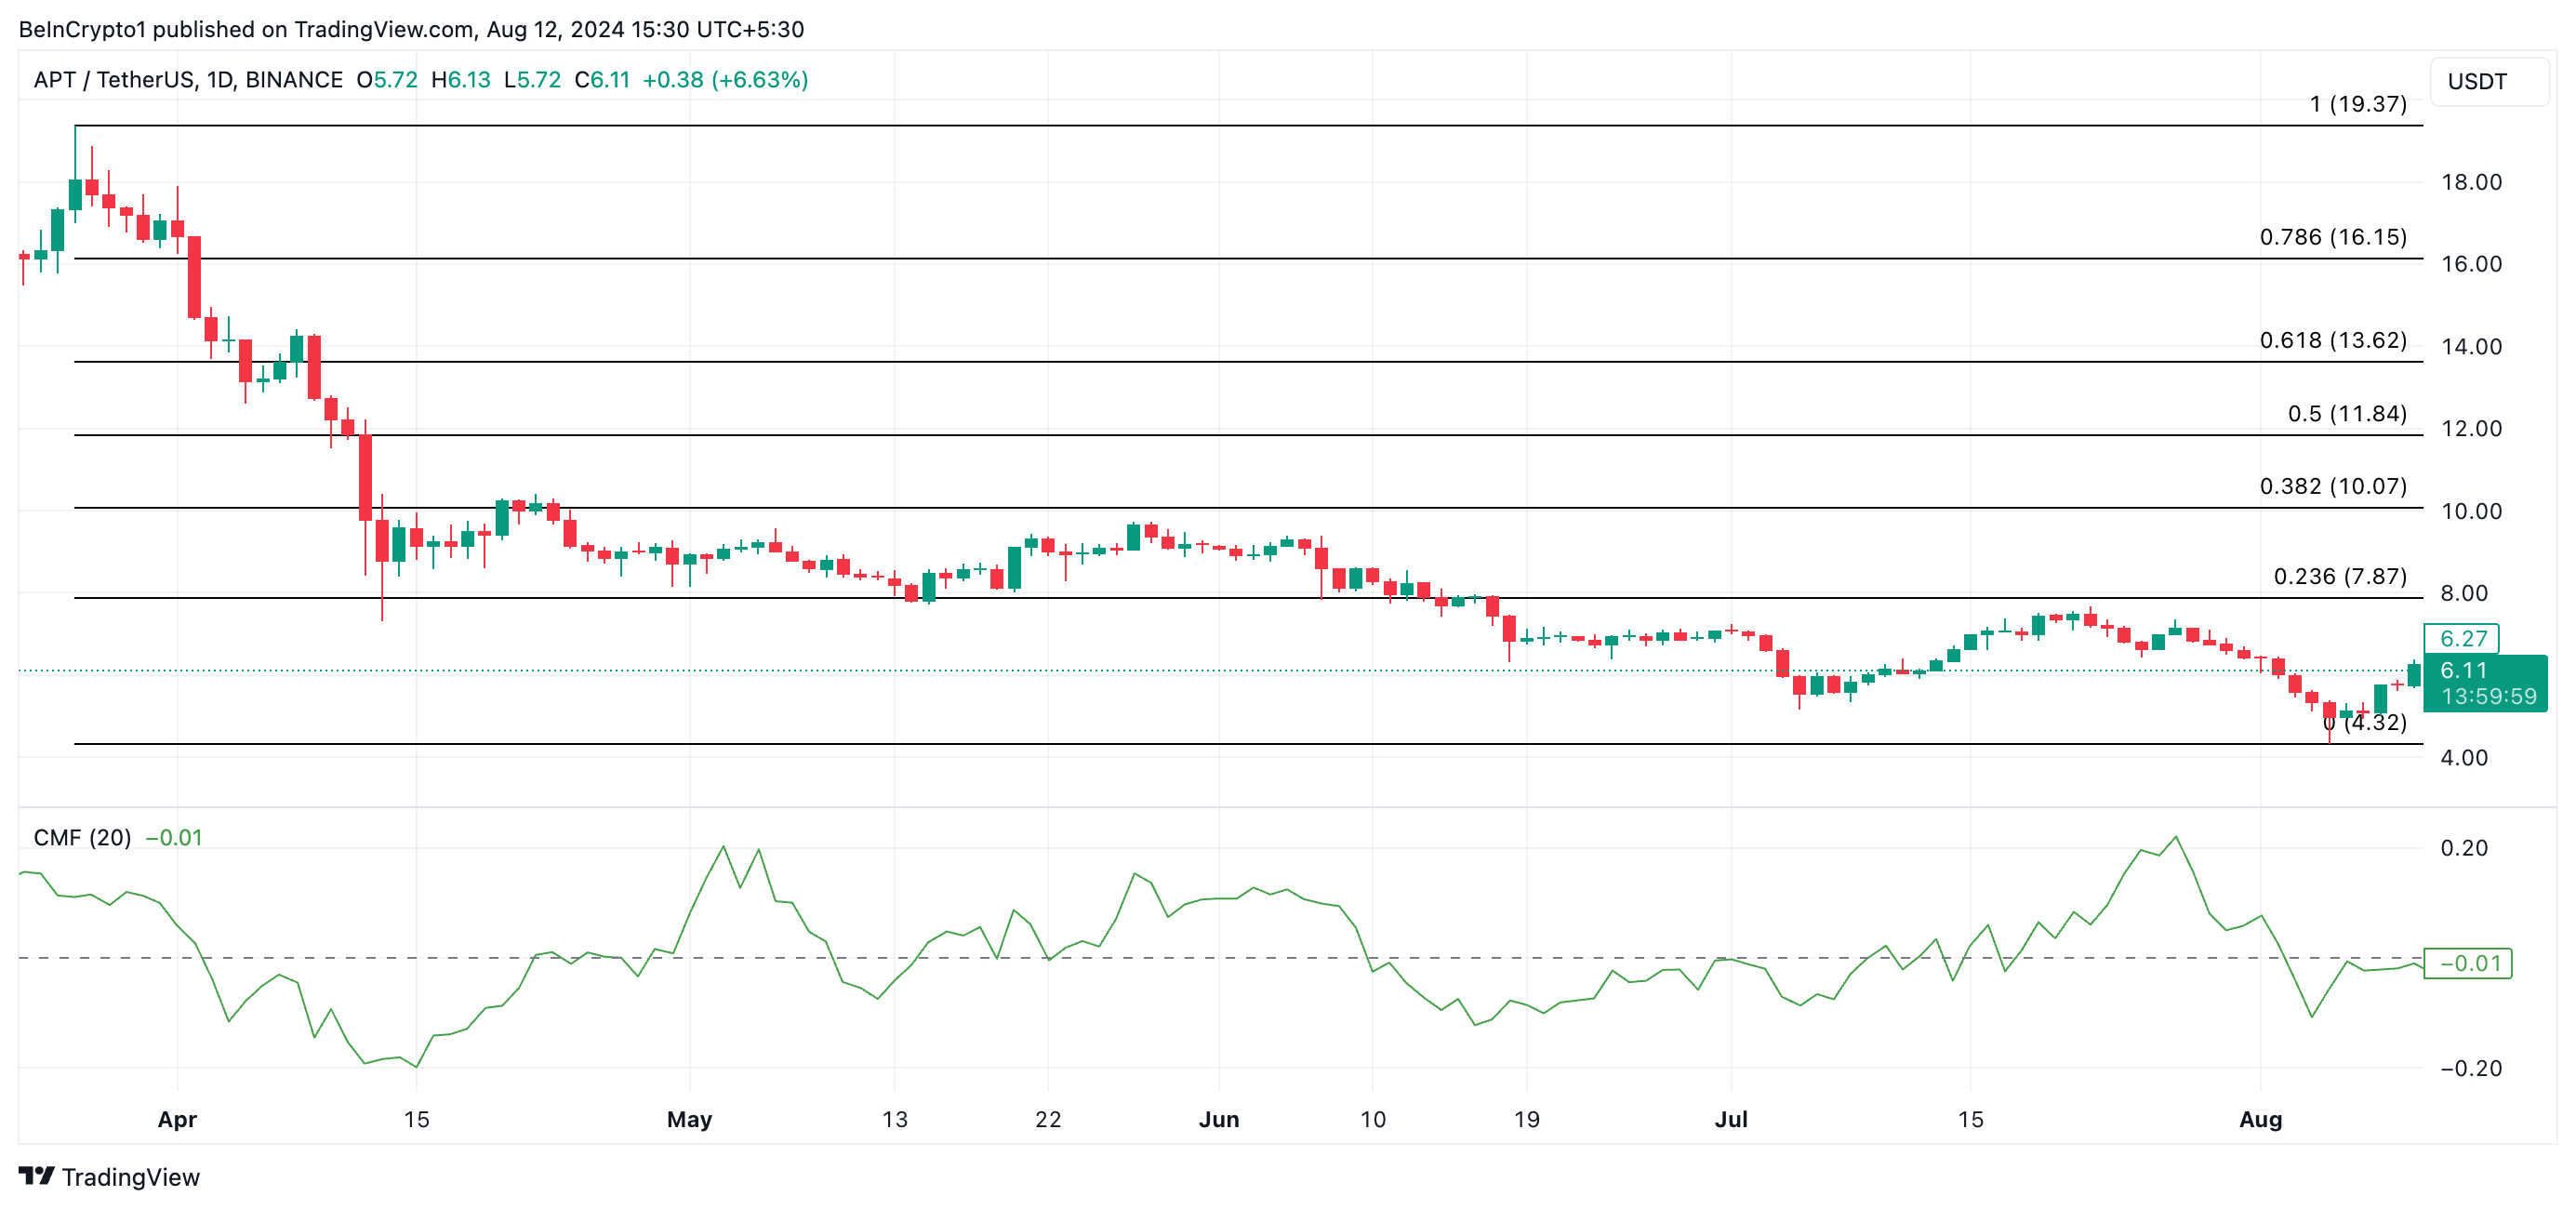
If Aptos ($APT) experiences a price correction, its value could drop to $4.32. On the other hand, if liquidity inflows surge and demand for $APT increases, its price might rise to a two-month high of $7.28.


