

 3
3
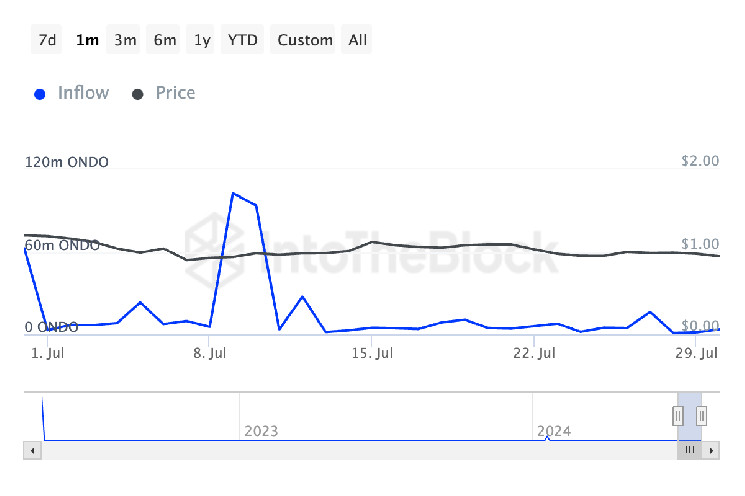
The $ONDO price declined by over 55% in the last three weeks amid global woes and sentiment. A shift in the wind has been witnessed as the price showed a liquidity grab near a demand zone, signifying impulsive buying gestures.
When writing, the price traded at $0.7243, with an intraday surge of 18%. Its market cap value was $1.005 Billion. This made it the 60th largest cryptocurrency in terms of market cap globally, dominating at 0.04%.
Also, a surge of 81% in the spot traded volume was recorded, which resulted in a traded value of $406.9 Million. This led to a massive volume/market cap ratio of 41.21%, exhibiting high liquidity in the asset.
From the beginning of February 2024, $ONDO started to witness buying, followed by strong bullish sentiment among investors. This led to a more than 450% price surge in less than four months.
How Much Supply the Top Addresses Hold?
The $ONDO floating supply was 13.89%, precisely 1.389 Billion $ONDO from the total supply of 10.0 Billion. Additionally, as of writing, the fully diluted market cap of the token with respect to price was $7.189 Billion.
Ondo Finance had a massive adoption among its users per the CoinCarp. Its holders increased rapidly from a January low of 10,000 holder addresses to 58,277 holders at press time.
The top 10 holders held 86.75% of the total supply. Moreover, Ace in the rich list was the largest token holder, holding 75.89% of the supply (7.589 Billion $ONDO tokens).
Decoding $ONDO’s Next Move on Technical Chart
The $ONDO price activity was in the upward wedge, where the low of all time was witnessed at $0.19655. The highest ever achieved was $1.48410.
On further look, the price had displayed a great uptrend. It got a major boost by mid-May 2024 from a symmetrical triangle pattern, hitting the $1.48 mark.

However, buyers lost strength from the supply level, which washed away its gains. The fall led to the formation of support at $0.87 by July 8th. The price tried to rise for a brief time, but the dynamic 50-day EMA hurdle deflected it downwards.
The overall sentiment turned bearish as its long followed-uptrend price structure in the upward channel became bearish. It formed a rising wedge, which was precisely a bearish pattern.
The fall accelerated in $ONDO, with global woes, such as the recent crash of the South Korean and Japanese stock markets. It caused market leaders like $BTC & ETH to draw down massively, which other altcoins depicted due to broader sentiment.
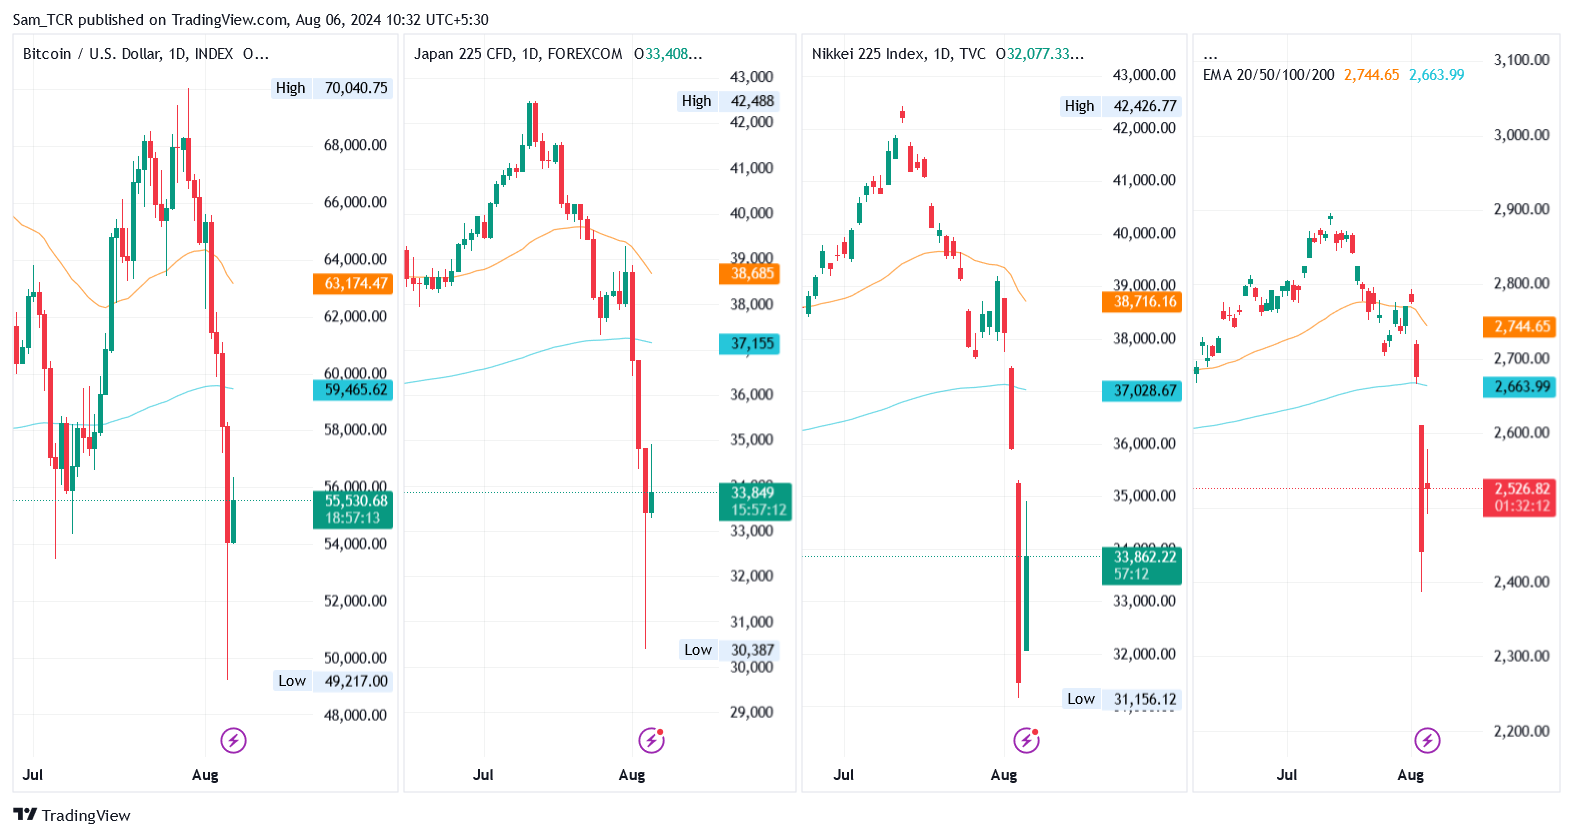
Despite the bearish sentiment, the hopes are alive as the $ONDO increased from a historically proven support level on Aug 5th. Likewise, the broader market has shown a liquidity grab candle like $ONDO, signifying massive buying occurred.
Indicator Perception and the $ONDO Price Forcast
With the recently witnessed liquidity grab candle, bullishness has been identified. However, the bullish trend would be confirmed once $ONDO reacquires the lost level of $0.875.
The EMA band of 50 days has been above the price, showcasing the price broadly in the bearish territory.
Despite that, the RSI has witnessed a resurgence from extremely oversold territory due to a liquidity grab built on the chart. It was last at 29.81.
Likewise, the MACD histogram has reduced toward the zero line. A bullish cross is anticipated based on a more bullish force.
Regarding $ONDO price advancement, the resistance could be at $0.875 and $1.042, respectively. On the contrary, the loss of the demand zone would lead to a lower low, depending on the bears’ strength.

