


 2
2
In the year-to-date period, the $BEAM token price has shown a bearish price structure on the daily chart. The bearish channel was formed as a result.
Inside that channel, the $BEAM price advanced by over 40% from the lower border to the higher border in the past month. At the higher border, it faced dynamic resistance that coincided with the 50-day EMA band.
According to CoinMarketCap, the $BEAM crypto plummeted by 5% in market value. It increased by 80% in trading volume spot inflows in the last 24 hours.
$BEAM Market Cap and Open Interest
Its market value at press time was $895.3 Million, and its trading volume was $25.826 Million. That makes it the 73rd largest crypto in terms of market cap, but it has a concerning liquidity ratio of 3%.
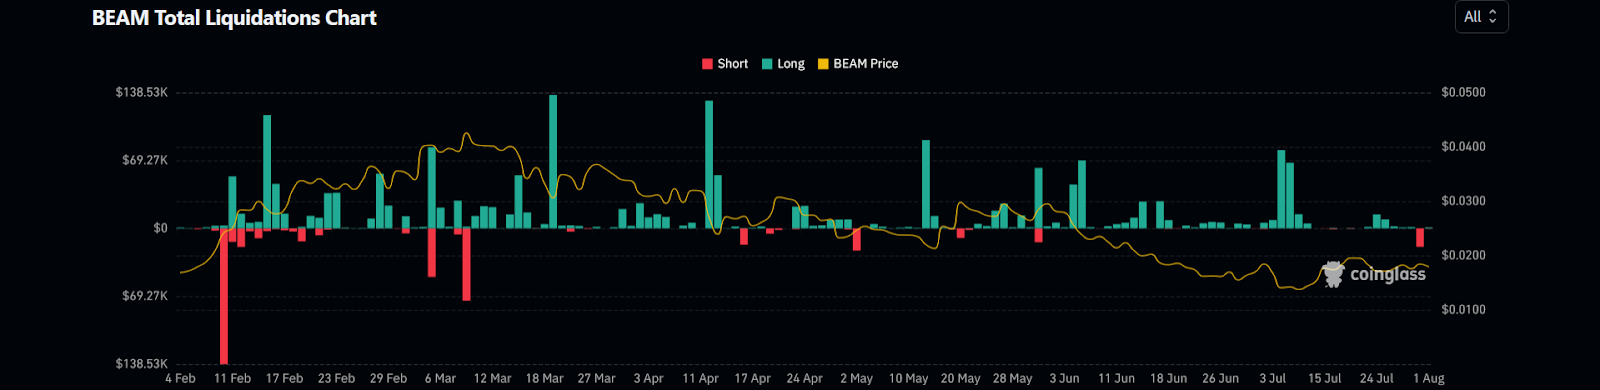
When writing, $BEAM’s open interest was $7.48 Million. As per CoinGlass, it fell by 10.65% in the previous session. The long-versus-short ratio for 24 hours was 0.9384. The short liquidation was $19.14K, versus $917.91 for the long liquidation.
Despite bears ‘ dominance, this signified a bullish angle, which could create major volatility in $BEAM. Investors and traders should be cautious and prepared (DYOR).
$BEAM Price Structure Insights
The $BEAM price traded at the $0.01798 level at press time. It revealed a pronounced downtrend, with a steady decline over the past few months.
This continuous decrease to lower levels was illustrated by the development of consistent lower lows on the daily chart. It showed a strong, bearish structure.
In the event of a price resurgence, $BEAM might encounter interruptions at higher levels. This hypothesized resistance could prompt a liquidity grab, pushing the price backward toward its previous swing lows.
Recent price actions reinforced the bearish outlook as the $BEAM price deflected from the upper border. It happened with an increased struggle near the 50-day EMA.
Yet again, the asset breakdown suggested a surged likelihood of continued southward momentum.
Indicators Perspective in $BEAM
The prevailing technical indicators and sentiment needled towards continuing the bearish trend in the near term.
Technical indicators for $BEAM displayed bearishness due to uncertainty in its price trend. The 20-day and 50-day EMAs presented a death crossover, ongoing since June 2024, signaling potential bearish momentum as of writing.
MACD has overlapped with the signal line, depicting the current struggle in $BEAM’s sideways price action.
Meanwhile, the RSI demonstrated a lack of movement, taking support at the median line. However, it already declined below the 14-day SMA, which could indicate a future fall towards oversold conditions.
Overall, it has been evident that technical indicators like EMAs and RSI depict bearish momentum despite some short-term gains. Moreover, an inclination was observed in perpetual trading volume inflows, which hints at potential volatility.
Therefore, the Beam price might take support at the $0.1251 and 0.1501 levels. It might face resistance at the $0.0331 and $0.0401 levels.


