


 4
4
Bitcoin Cash price rebounded above $368 on July 11, marking a 23% rebound from last week’s bottom. On-chain data shows how increased media traction from the Mt.Gox payouts could further propel the rally.
Bitcoin Cash bounces 27%, printing 4 Consecutive Green Candles
In the first week of July, the global crypto market suffered intense FUD (Fear, Uncertainty, and Doubt), triggered by a sell-off from the German government and the $9 billion payouts to Mt Gox creditors denominated on Bitcoin and Bitcoin cash.
Bearish headwinds from these events saw $BTC and $BCH sink to historic lows during widespread market liquidations on July 5. However, since then, buying momentum has gradually returned to the $BCH markets again amid dovish Jobs reports and inflation data published by US Authorities this week.
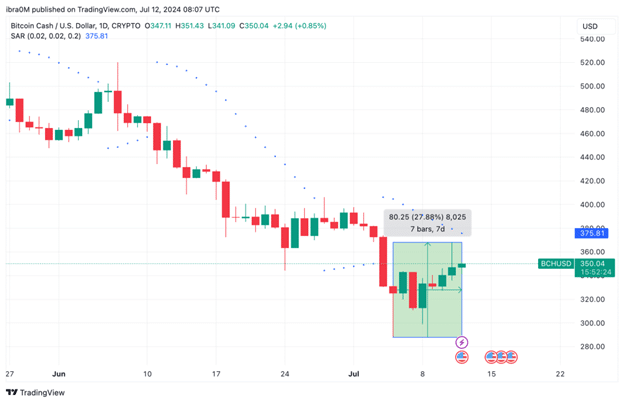
The chart above illustrates how Bitcoin Cash has swung into a steady uptrend since the US Non-Farm jobs data was released on July 5.
At the time of writing on Friday, July 12, $BCH price is trading above the $350 level, having climbed as high as $368 within the 24-hour timeframe. More so, $BCH has now printed 3 consecutive green candles, a move that affirms the bulls stronghold on the short-term market momentum.
Mt Gox Links Has Propelled $BCH up the Trend Tables
When it was announced that the $9 billion payouts to Mt Gox creditors would be done in $BTC and $BCH, it triggered widespread short-term sell-offs, as expected. But as the market FUD subsides amid positive macroeconomic reports from the US this week, the media buzz generated by the Mt Gox payouts could be driving up $BCH prices.
The IntoTheBlock chart presents the daily trends of Bitcoin Cash ($BCH) hits across relevant search engines like Google. A rising search trend often implies increased interest from existing investors or discovery by potential new entrants, and vice versa.
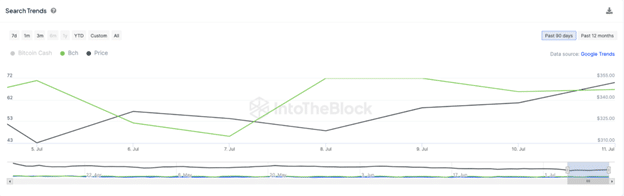
The chart above shows that the search score for “$BCH” stood at 46 as of July 7. But as the Bitcoin Cash’s involvement in the Mt Gox payouts dominated the news reels, there has been a significant increase in Google users’ search hits for information on $BCH.
At the time of publication on July 12, $BCH search score has now surged to 67, reflecting a 46% increase over the last 5-days alone.
Historically, increased search interest for a particular asset often leads to a demand surge from both existing investors and new users who may discover the project on the trends tables.
Unsurprisingly, the 46% surge in $BCH search score over the last five days, has coincided with a 27% price bounce. Hence, as bulls regain control of the crypto markets following positive US economic indices in July, the rising search trends could propel $BCH price further toward the $400 level in the weeks ahead.
$BCH Price Forecast: Bumpy Road to $400
Bitcoin Cash ($BCH) is currently trading at $349.47, showing a slight increase of 0.68% over the past day. The price has experienced a notable recovery of 27.88% over the past week, signaling a potential bullish trend. The Auto Fib Extension levels provide a clear roadmap for $BCH’s price action, highlighting key resistance and support levels.
The immediate resistance for $BCH lies at $360.46, corresponding to the 0.236 Fibonacci retracement level. A break above this resistance could propel the price towards the next significant resistance at $406.18, the 0.0 Fibonacci level, marking a potential target of $400.
If $BCH can sustain its momentum and break these resistance levels, it could pave the way for a more extended rally.
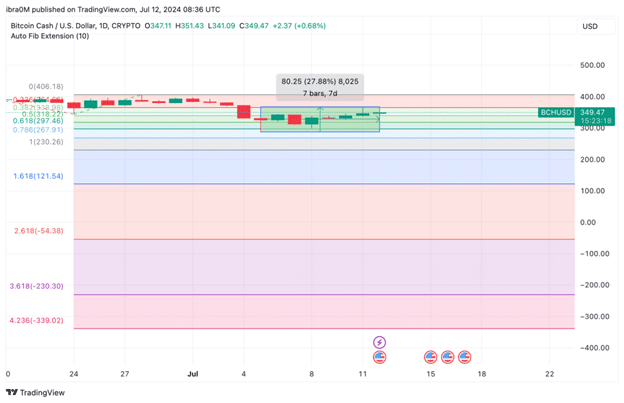
On the downside, key support levels are crucial for maintaining the bullish outlook. The first support level to watch is at $338.98, the 0.382 Fibonacci retracement level. A drop below this level could lead to a retest of the $318.22 support, the 0.5 Fibonacci level. If $BCH fails to hold these support levels, it could signal a reversal and a move towards lower support at $297.46, the 0.618 Fibonacci level.
In summary, Bitcoin Cash shows promising signs of recovery with the potential to reach the $400 mark. Traders should closely monitor the resistance levels at $360.46 and $406.18. On the flip side, maintaining support at $338.98 and $318.22 is crucial for sustaining the bullish momentum. A break above the key resistance could signal a strong upward move, while failure to hold support could lead to a bearish reversal.

