
 1
1
Bulls have regained control of the markets as cryptos end the week on an uptick. This is seen from the 2.75% increase in the market cap in the last 24 hours to stand at $1.59T as of press time. The trading volume has also jumped by 7% in the last 24 hours to $51.9B globally.
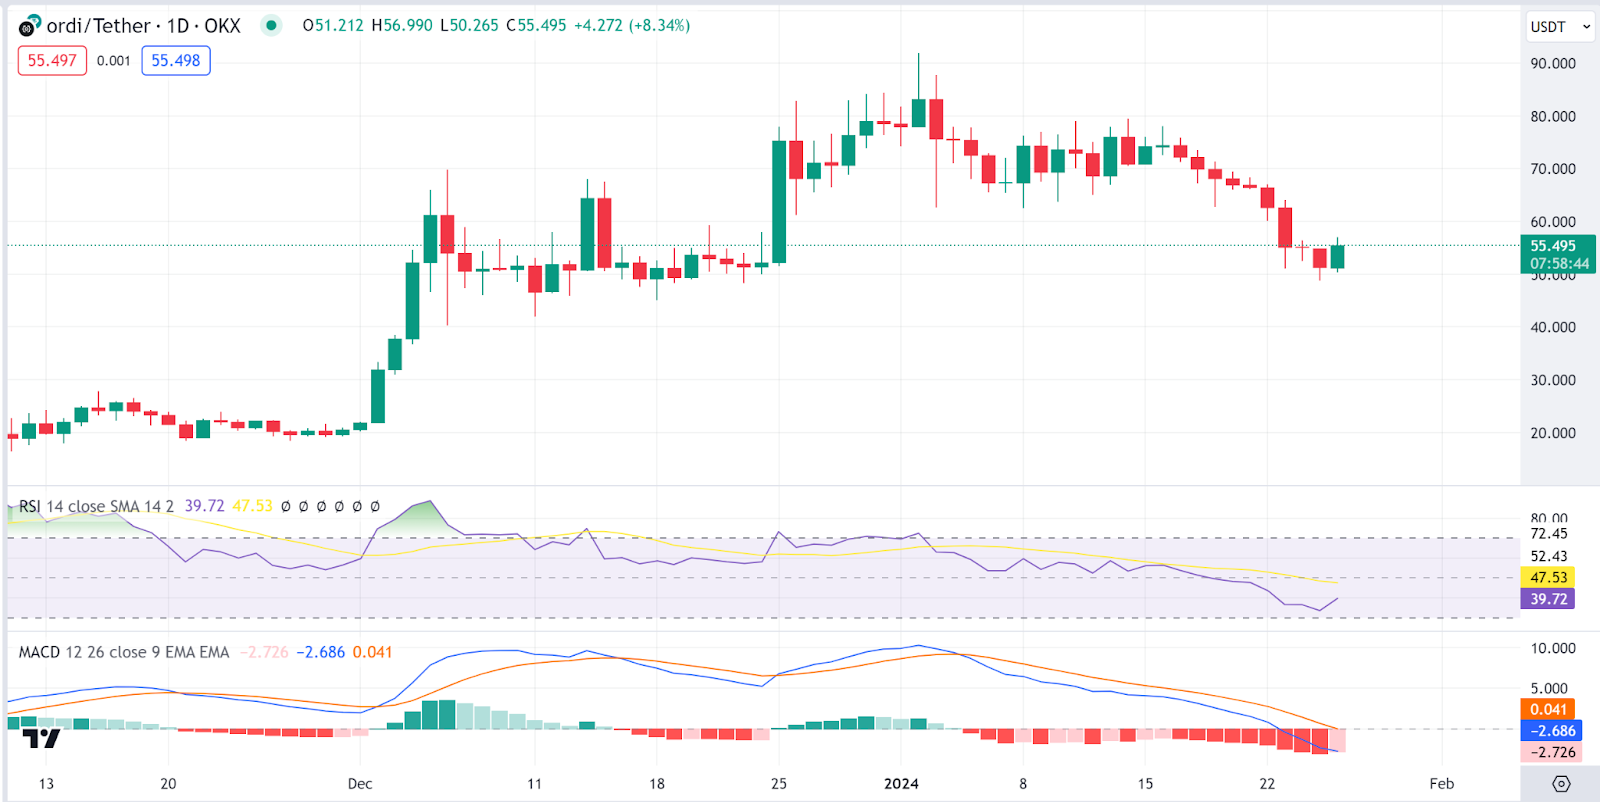
$ORDI Price Analysis
$ORDI ($ORDI) is our first gainer today, as the $ORDI price stood at $55.17 as of press time, representing a 10.4% increase in the last 24 hours to bring the weekly drop to 18%. The trading volume has jumped by 11% to $269M.
Analyzing 24-hour $ORDI/$USDT charts, we see that bulls are now dominating the altcoin. This is seen from the MACD, which is reverting towards the green zone showing buying pressure. The Relative Strength Index indicator is also headed for the oversold region asserting bullishness on the $ORDI price.
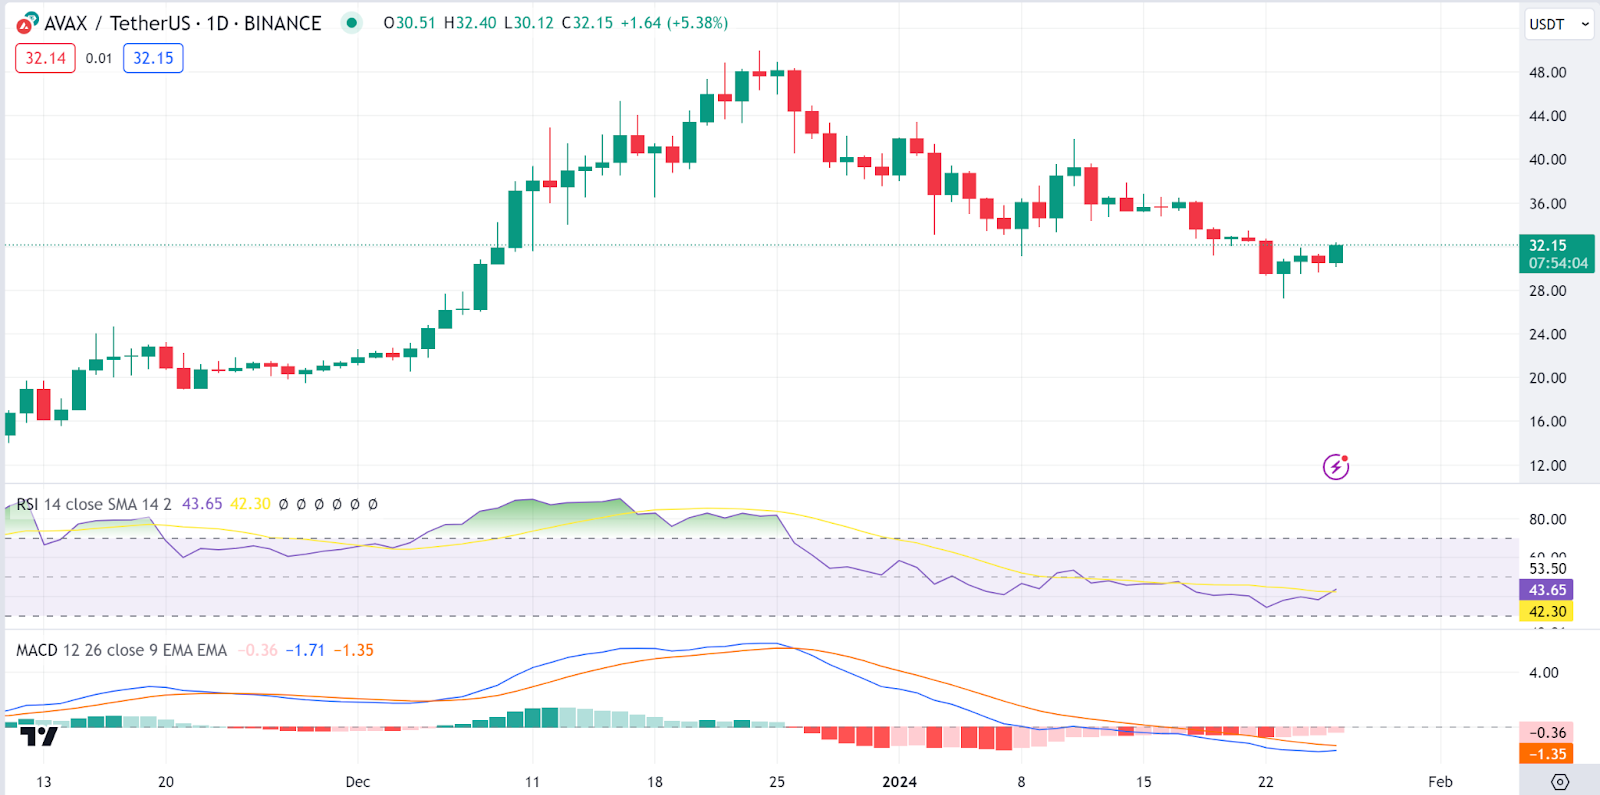
Avalanche Price Analysis
Avalanche ($AVAX) is our second gainer today, as the Avalanche price stood at $32.11 as of press time, representing a 7.2% increase in the last 24 hours to bring the weekly drop to 1.4%. The trading volume has jumped by 5.5% to $496M.
An analysis of 24-hour $AVAX/$USDT charts shows that bulls are now dominating $AVAX. This is seen from the MACD, which is reverting towards the green zone, showing building bull momentum. The Relative Strength Index indicator is also headed north as it approaches 50, asserting bullishness on the $AVAX price. Don’t miss an opportunity to read our short 2023 market recap including Avalanche ($AVAX).
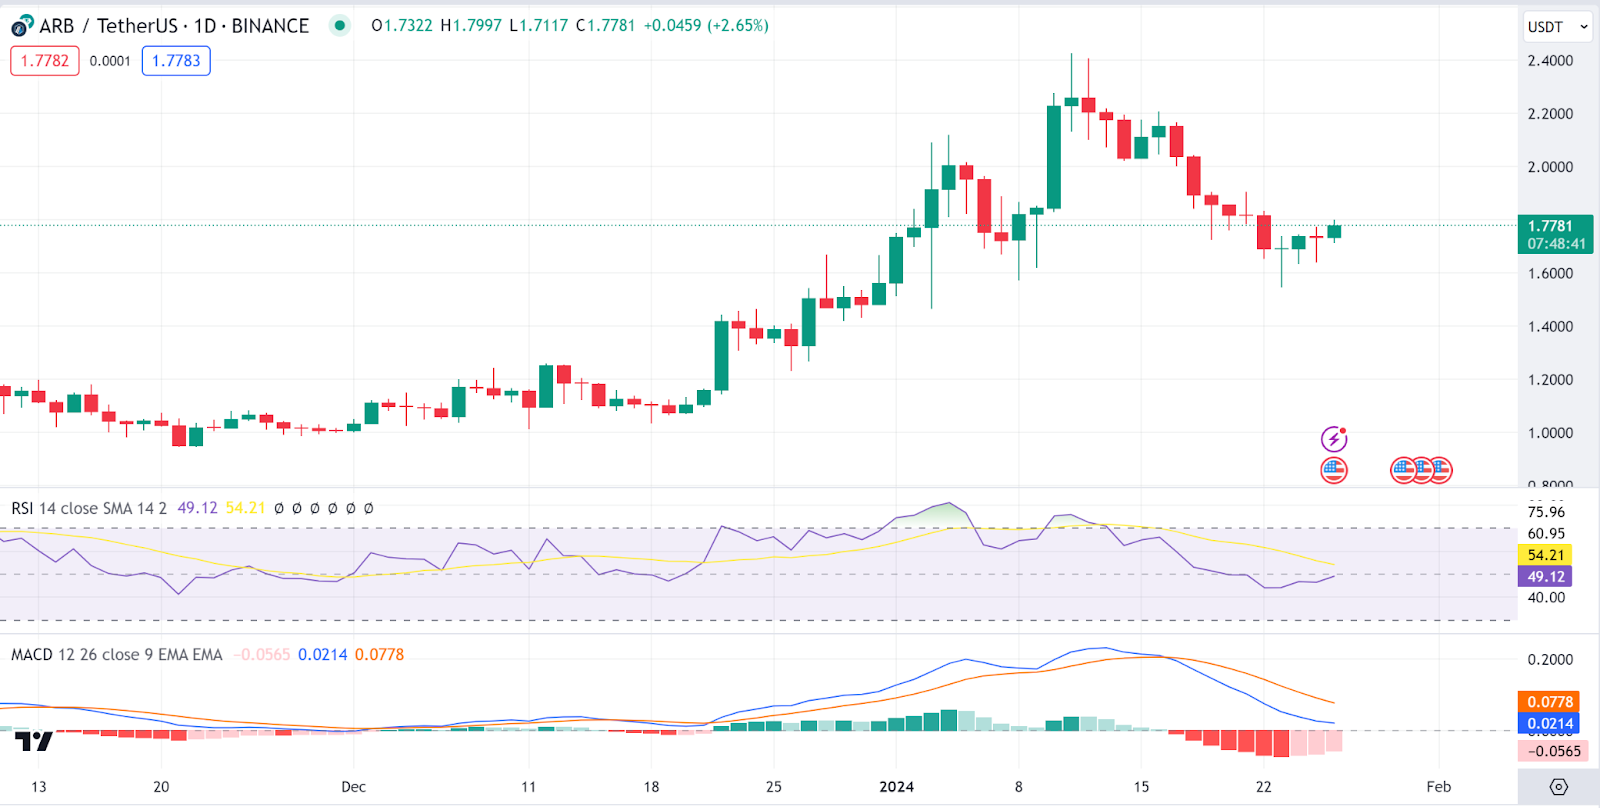
Arbitrum Price Analysis
Arbitrum ($ARB) is another gainer today, as the Arbitrum price stood at $1.77 as of press time, representing a 6.9% increase in the last 24 hours to bring the weekly drop to q.7%. The trading volume has jumped by 31% to $556M.
Analyzing 24-hour $ARB/$USDT, we see that bulls also control $ARB. This is seen from the MACD, which is close to a shift to the green zone, showing building bull momentum. The Relative Strength Index indicator is also headed north as it approaches 50, asserting bullishness on the Arbitrum price.
$UMA Price Analysis
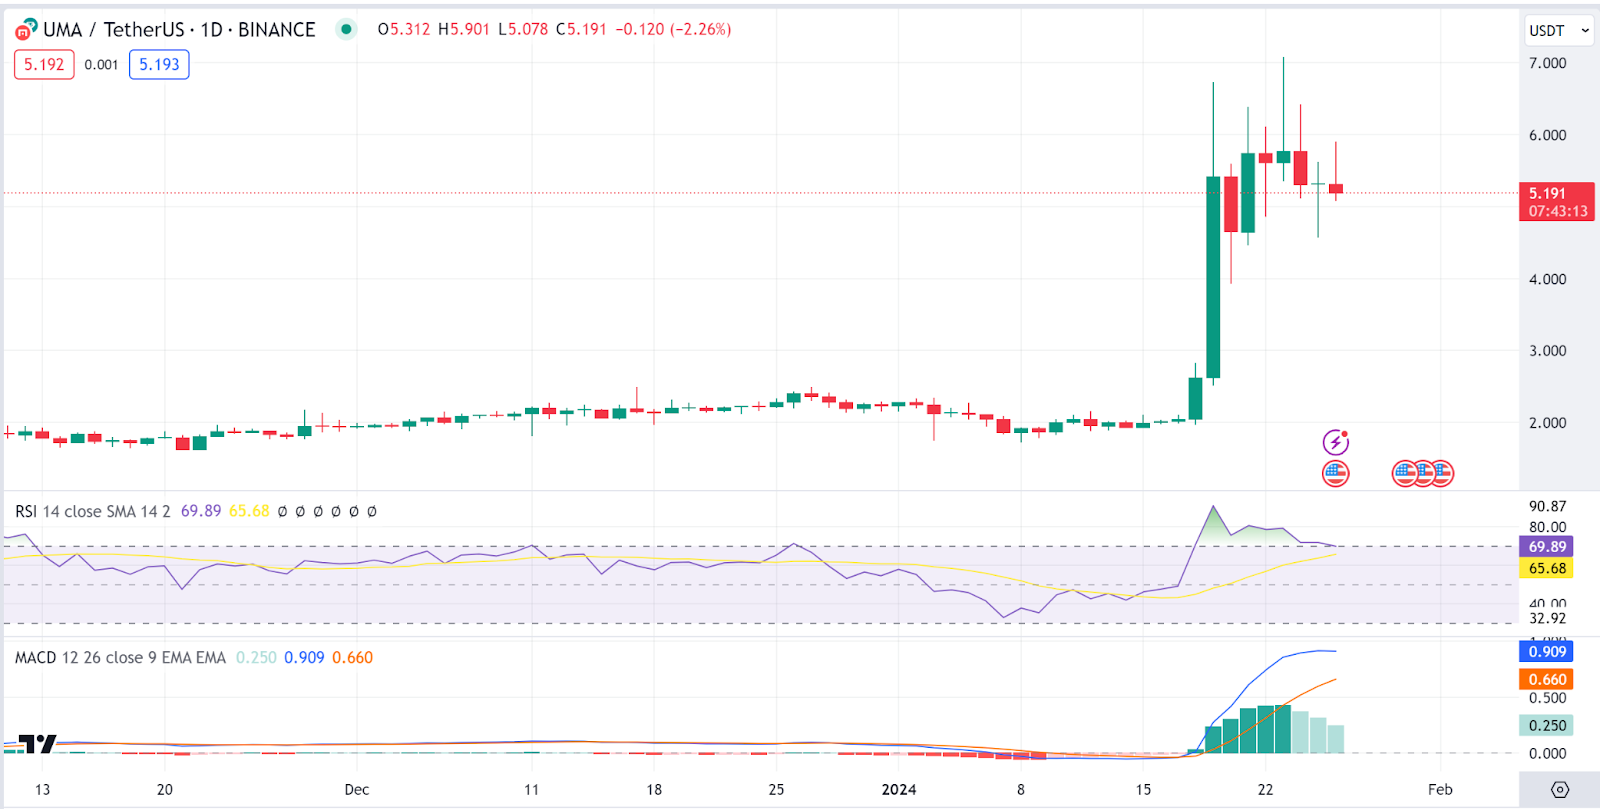
$UMA ($UMA) is also on the gainers list today, as the $UMA price stood at $5.2 as of press time, representing an 11.6% increase in the last 24 hours to bring the weekly rise to 6.9%. The trading volume has jumped by 66.9% to $247M.
Analyzing 24-hour $UMA/$USDT charts, we see that bulls are now losing dominance on $UMA. This is seen from the MACD, reverting towards the red zone, showing fading bull momentum. The Relative Strength Index indicator is also headed south as it exits the overbought region, asserting bearishness on the $UMA price.
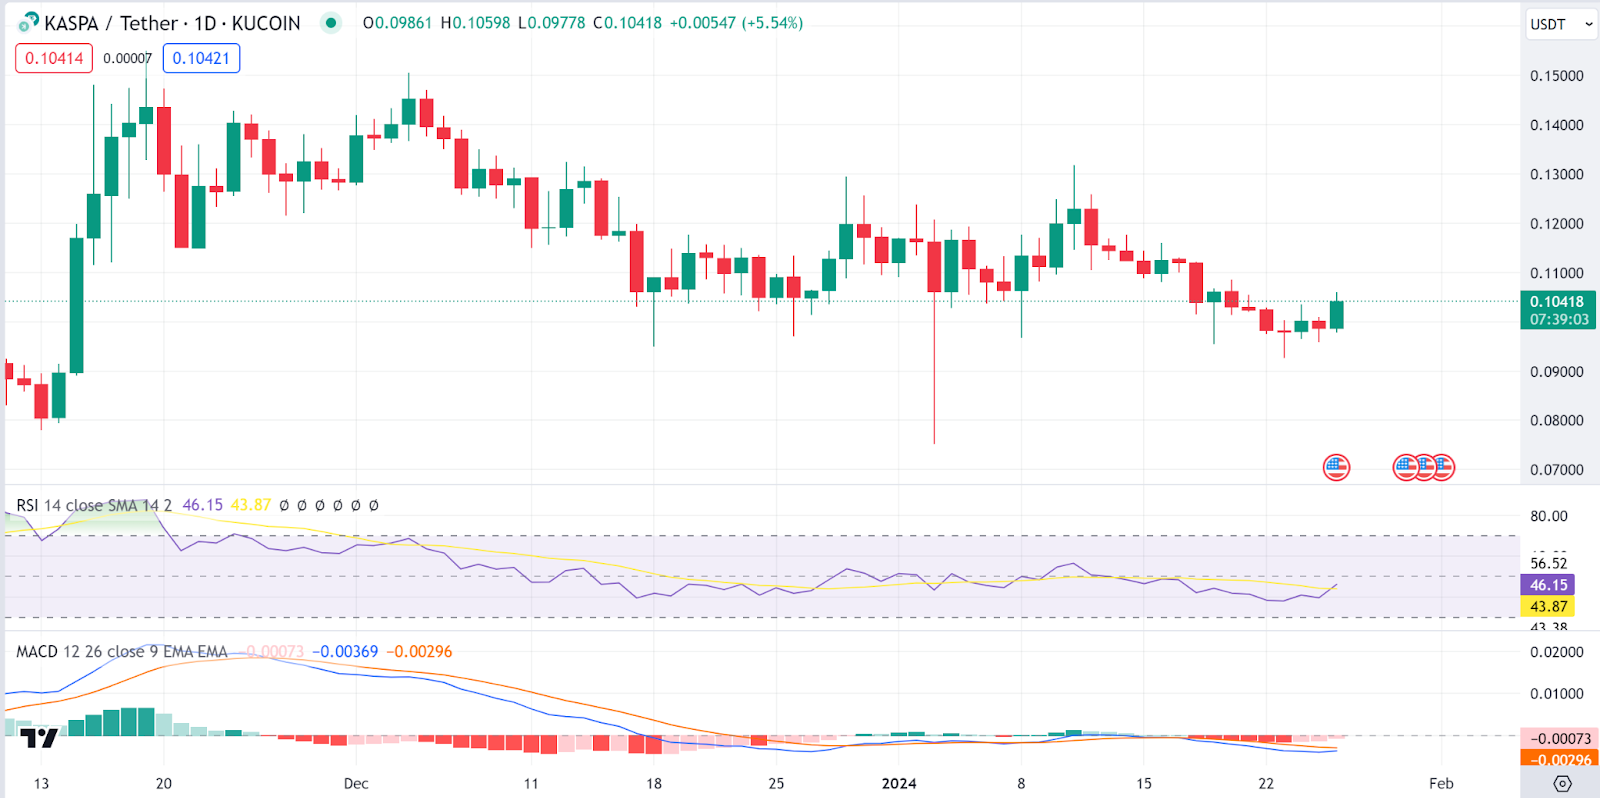
Kaspa Price Analysis
Kaspa ($KAS) wraps up our gainers list today, as the Kaspa price stood at $0.104 as of press time, representing a 7.7% increase in the last 24 hours to bring the weekly rise to 6.4%. The trading volume has jumped by 12.2% to $19.4M.
Analyzing 24-hour $KAS/$USDT charts shows that bulls also control $KAS. This is seen from the MACD, which is close to a shift to the green zone, showing building bull momentum. The Relative Strength Index indicator is also headed north as it approaches 50, asserting bullishness on the Kaspa price.