

 2
2
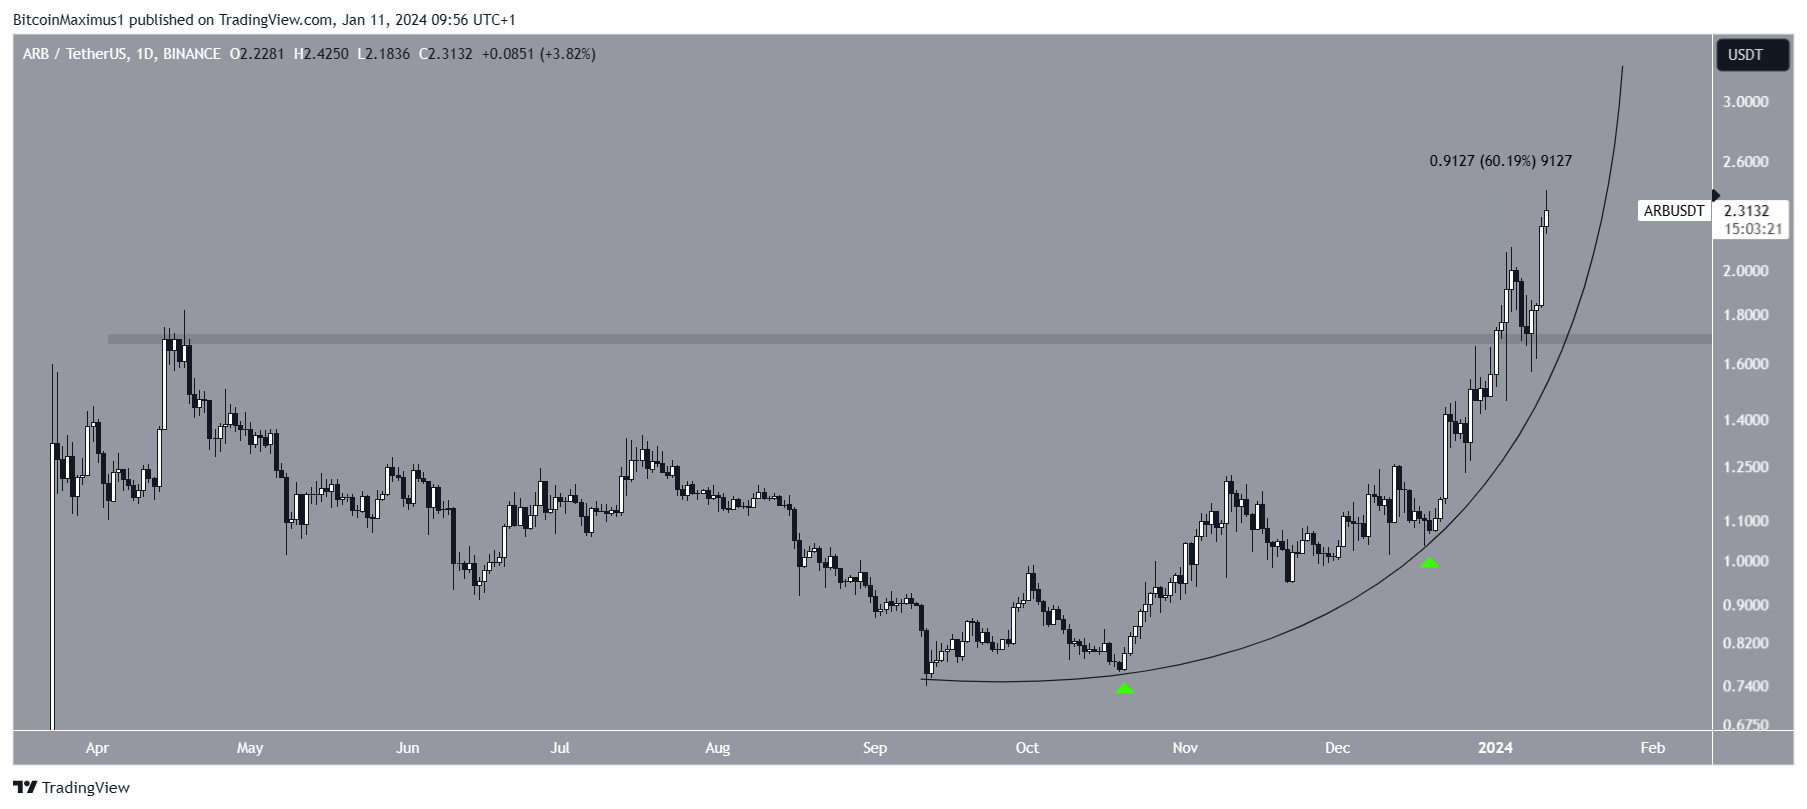
The Arbitrum ($ARB) price has increased swiftly in 2024, reaching a new all-time high price of $2.42 today.
The increase has become entirely parabolic, and $ARB has not experienced any retracement this year.
Arbitrum Reaches New All-Time High
The $ARB price has increased alongside a parabolic ascending support trend line since September 2023. The trend line has been validated numerous times (green icons), most recently in December.
Afterward, $ARB accelerated its rate of increase further. At the start of 2024, it broke out from the previous all-time high resistance at $1.70 and validated it as support. Since then, the $ARB price has increased by 60%, culminating with a new all-time high of $2.42 today.
Cryptocurrency analysts and traders on X are extremely bullish on the future $ARB trend.
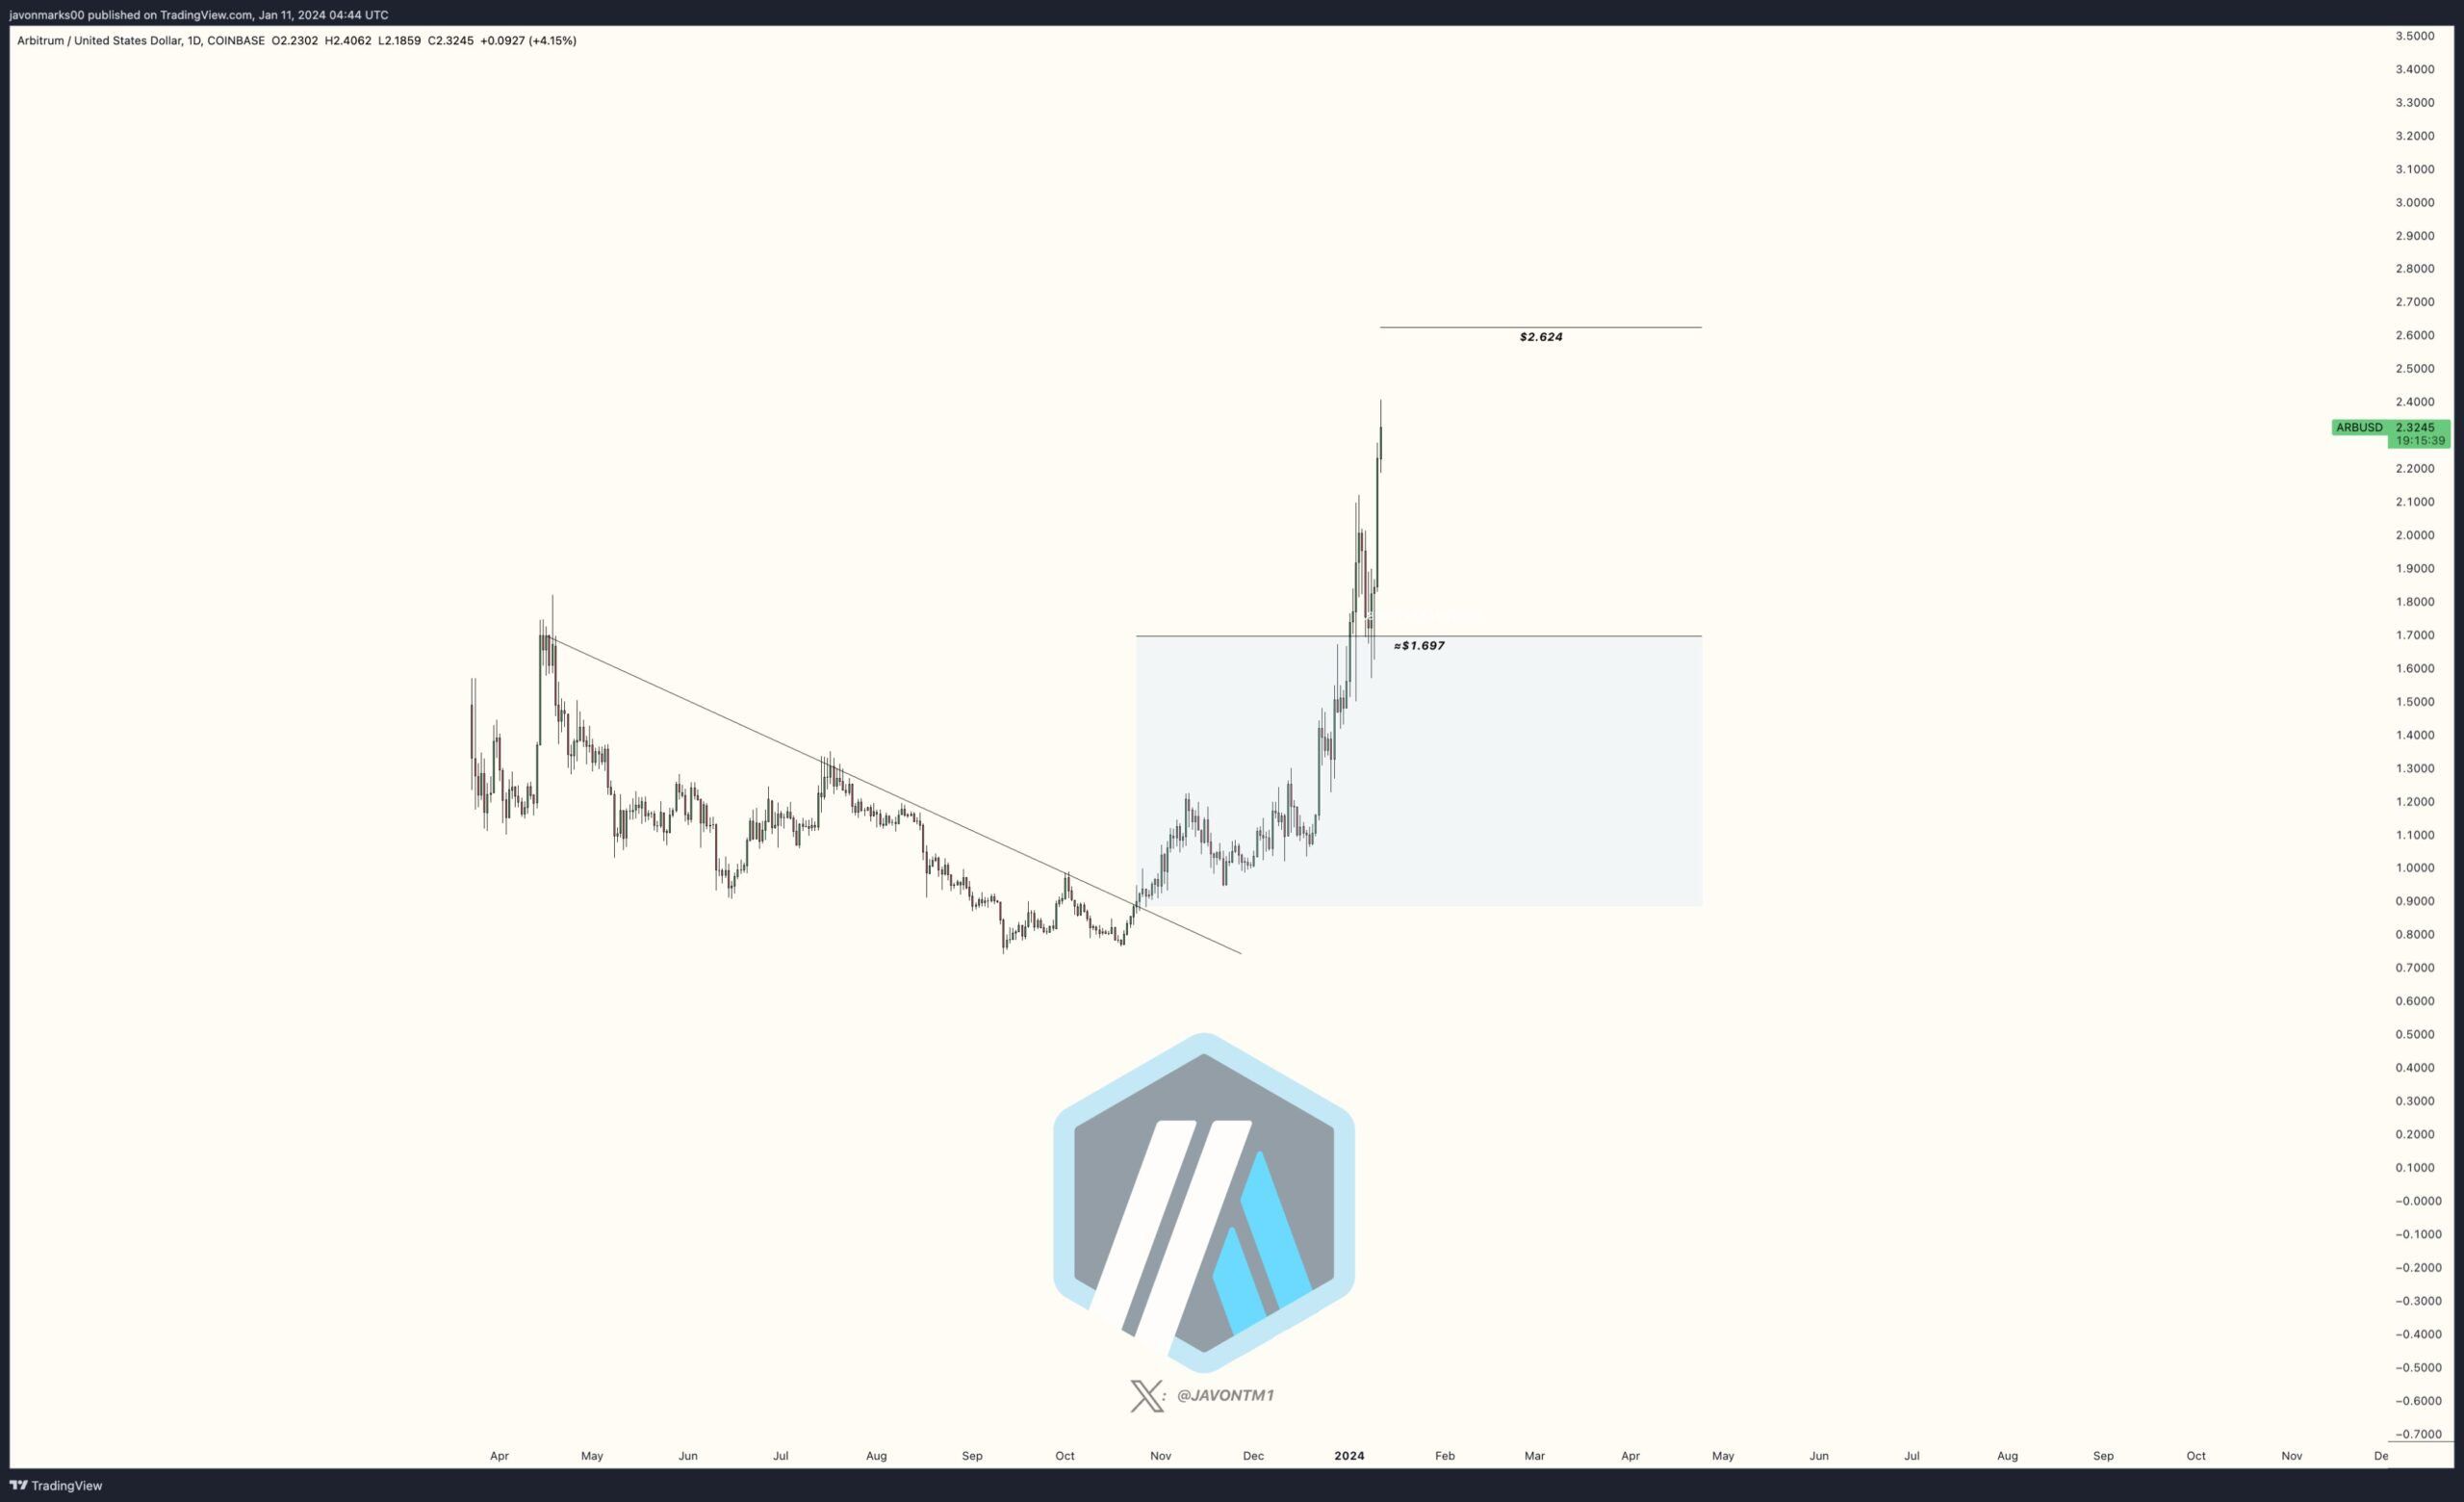
Javon Marks believes that the price will increase to at least $2.60.
Crypto Tony also noted the pump but did not give any targets for the increase. Coin Mamba flexed that he has more than $600,000 in unrealized profits in a leveraged $ARB trade.
Jolly Green believes that $ARB will lead the way in the Ethereum ecosystem pump. He tweeted:
As predicted
The entire $ETH ecosystem is ripping
$ARB and $OP will lead the way as the large caps.
$ARB Price Prediction: Can $ARB Reach $3?
The technical analysis of the daily time frame suggests that the $ARB price trend is still bullish, though it shows signs of a potential local top.
Technical analysts utilize the Elliott Wave theory to ascertain the trend’s direction by studying recurring long-term price patterns and investor psychology.
The wave count suggests that $ARB is in wave three of a five-wave upward movement. Wave three has extended and is nearly 2.61 times the length of wave one. The rapid ascent of wave three has created a parabolic upward movement.
The daily RSI shows signs of a local top since it has generated a bearish divergence (green line), supporting the possibility that a top is close.
So, the first level for a local top is at $2.65, 15% above the current price. If wave three extends further and has 3.61 times the length of wave one, $ARB can increase by 45% to the next resistance at $3.28.
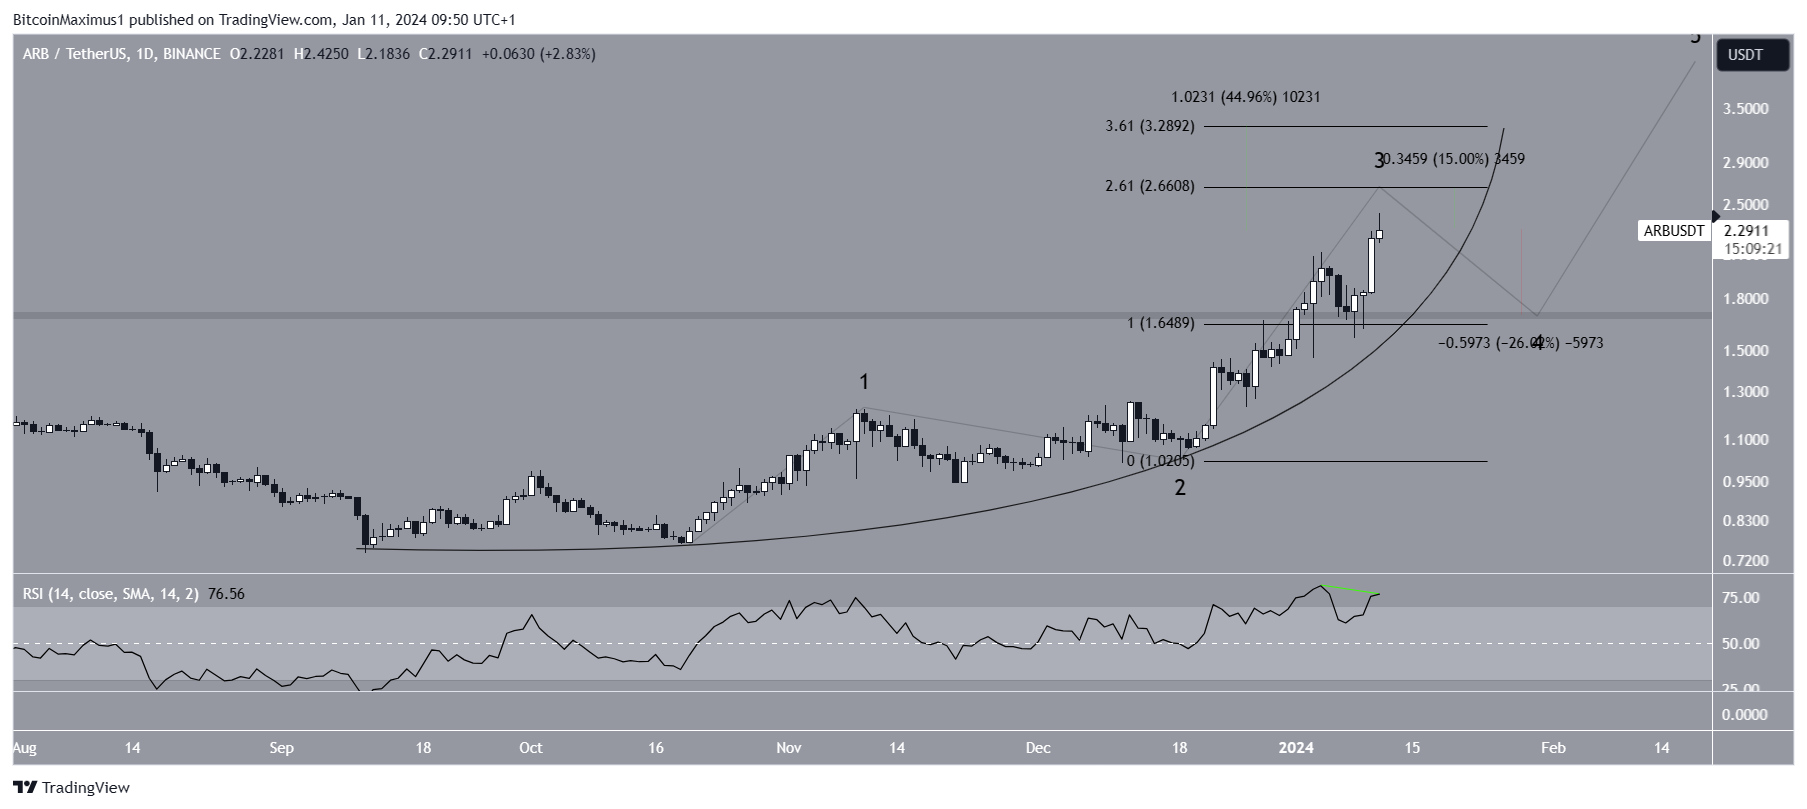
Despite this bullish $ARB price prediction, a breakdown from the parabola will mean wave three has ended. Then, $ARB can fall 26% to the closest support at $1.70.
For BeInCrypto‘s latest crypto market analysis, click here

