

 1
1
The Arbitrum ($ARB) price has increased swiftly since December 26 and is approaching its all-time high.
$ARB broke out from a horizontal resistance area and faces only one more resistance on the way to its all-time high.
Arbitrum Breaks Out From Resistance
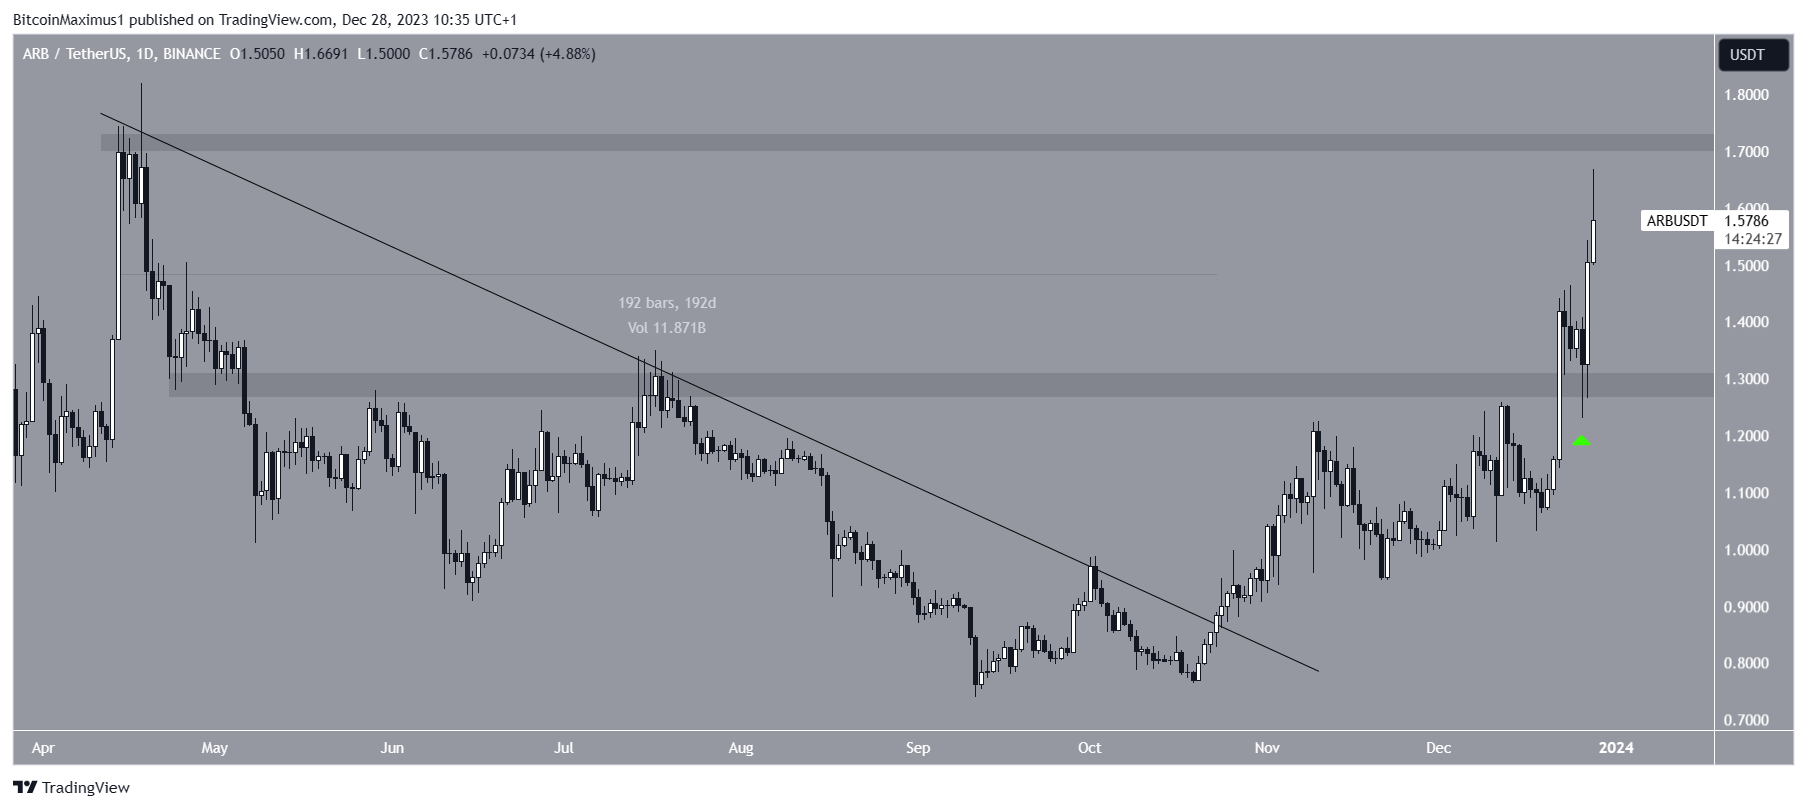
The $ARB price has increased since falling to a low of $0.74 on September 11. The price created a higher low on October 19 and accelerated its rate of increase afterward.
The price broke out from a descending resistance trend line on October 23. Before the breakout, the trend line had been in place for 192 days.
Initially, $ARB struggled with a pivotal horizontal resistance area but finally broke out in December, validating it as support on December 26 (green icon) and creating a long lower wick.
$ARB is approaching its all-time high resistance of $1.82.
Cryptocurrency analysts and traders have a positive outlook for the future $ARB trend. Route 2 FI believes a rotation toward the Ethereum ($ETH) ecosystem is underway. He tweeted:
Interesting to see $SOL, $INJ, $SEI, $TIA, and $AVAX taking a break here. Seems like Ethereum and $ETH betas are the future of France again. $ETH betas: $ARB, $OP, $LDO, $MATIC.
Both Shardi B and CryptoKnight are bullish because of the price action. Due to the lack of overhead resistance, they suggest the rally can become parabolic once the price breaks its all-time high.
$ARB Price Prediction: Will Parabolic Rally Continue?
A closer look at the daily time frame shows that the price action and Elliott Wave readings are bullish.
The wave count indicates that the $ARB price is in the third wave of a five-wave upward movement. The sub-wave count is in white, showing an extended third wave, creating a parabolic movement.
Due to the length of the first sub-wave, wave three may extend to 2.61 times the length of wave one. This $ARB upward movement of 40% would lead to a high of $2.25.
The daily Relative Strength Index (RSI) also supports this possibility since it broke out from its bearish divergence trend line (green) and is increasing.
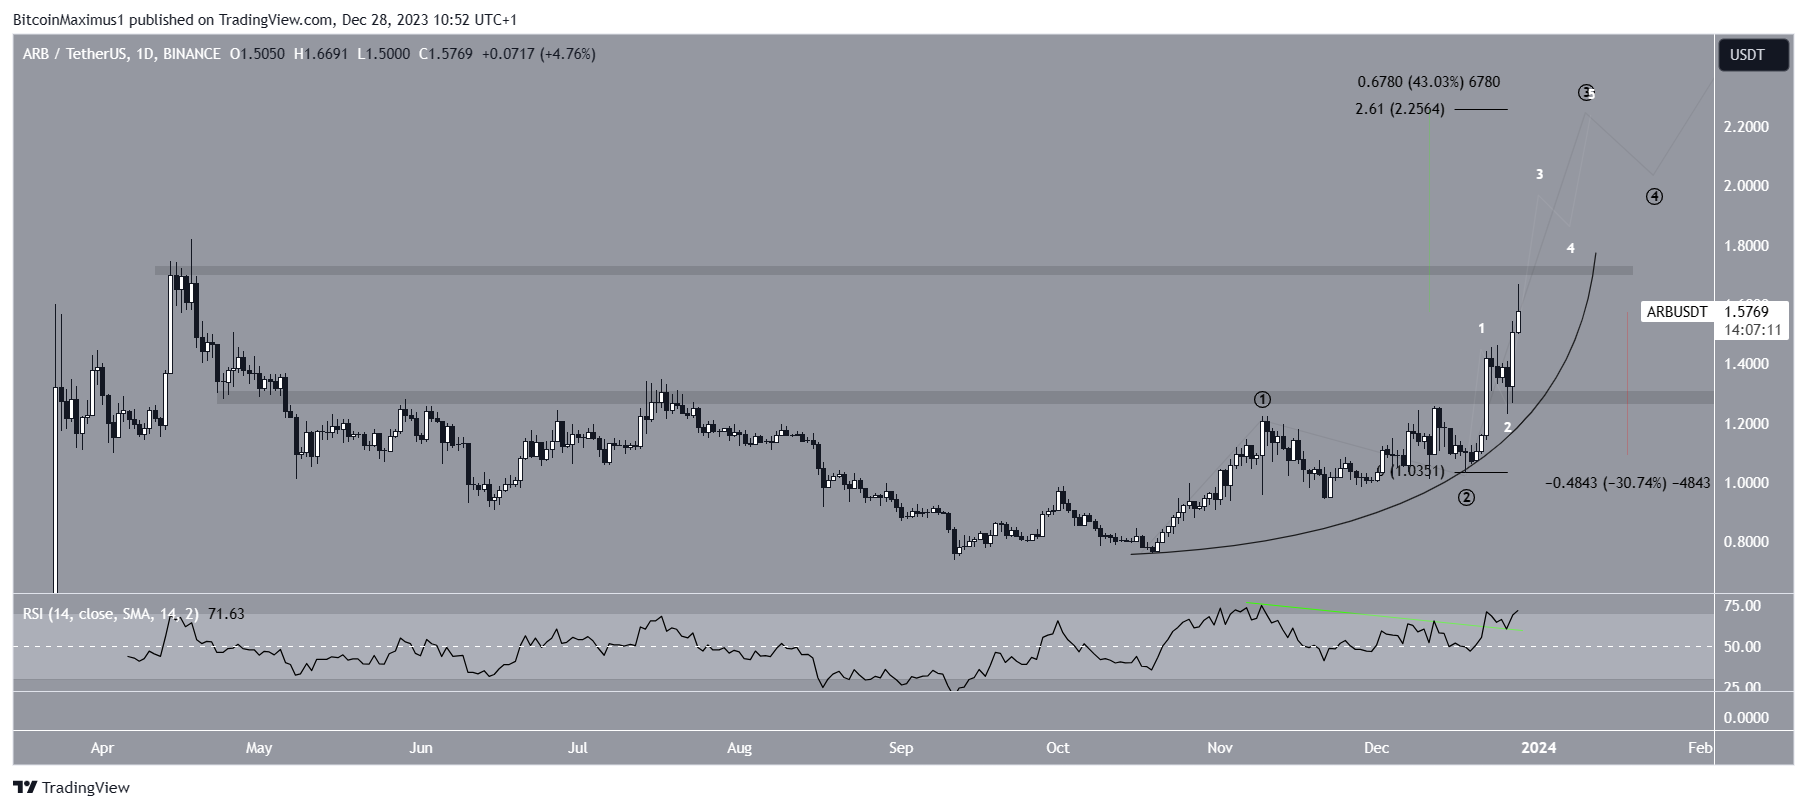
Despite this bullish $ARB price prediction, a breakdown from the parabola will invalidate the wave count. $ARB could then fall by 30% to the closest support at $1.10.
For BeInCrypto‘s latest crypto market analysis, click here


